[Tool Launch] Free Chrome Extension: Transform Screener.in Data Into Professional Charts Instantly (Zero Data Collection)

Finmagine Trader v1.4.0 — Tight Volatility Filter

v1.4.0 adds one focused feature: a server-side ATR contraction filter for the Near 52W High scan.

The thesis

Minervini’s SEPA methodology and his VCP pattern share one observation — stocks that coil before breaking out (volatility contracting, range tightening) produce more reliable and powerful moves than stocks breaking out from wide,
choppy bases. The Tight Volatility filter quantifies this.

The condition: ATR(14) < ATR(50)

Recent 14-day Average True Range must be below the 50-day ATR baseline. This is a relative, self-referential comparison — it judges each stock against its own medium-term volatility, not an absolute threshold. This is important for
Indian markets where a 5% ATR stock (KPIT, BSE Ltd) can be a perfectly valid momentum winner that an absolute threshold would incorrectly eliminate.

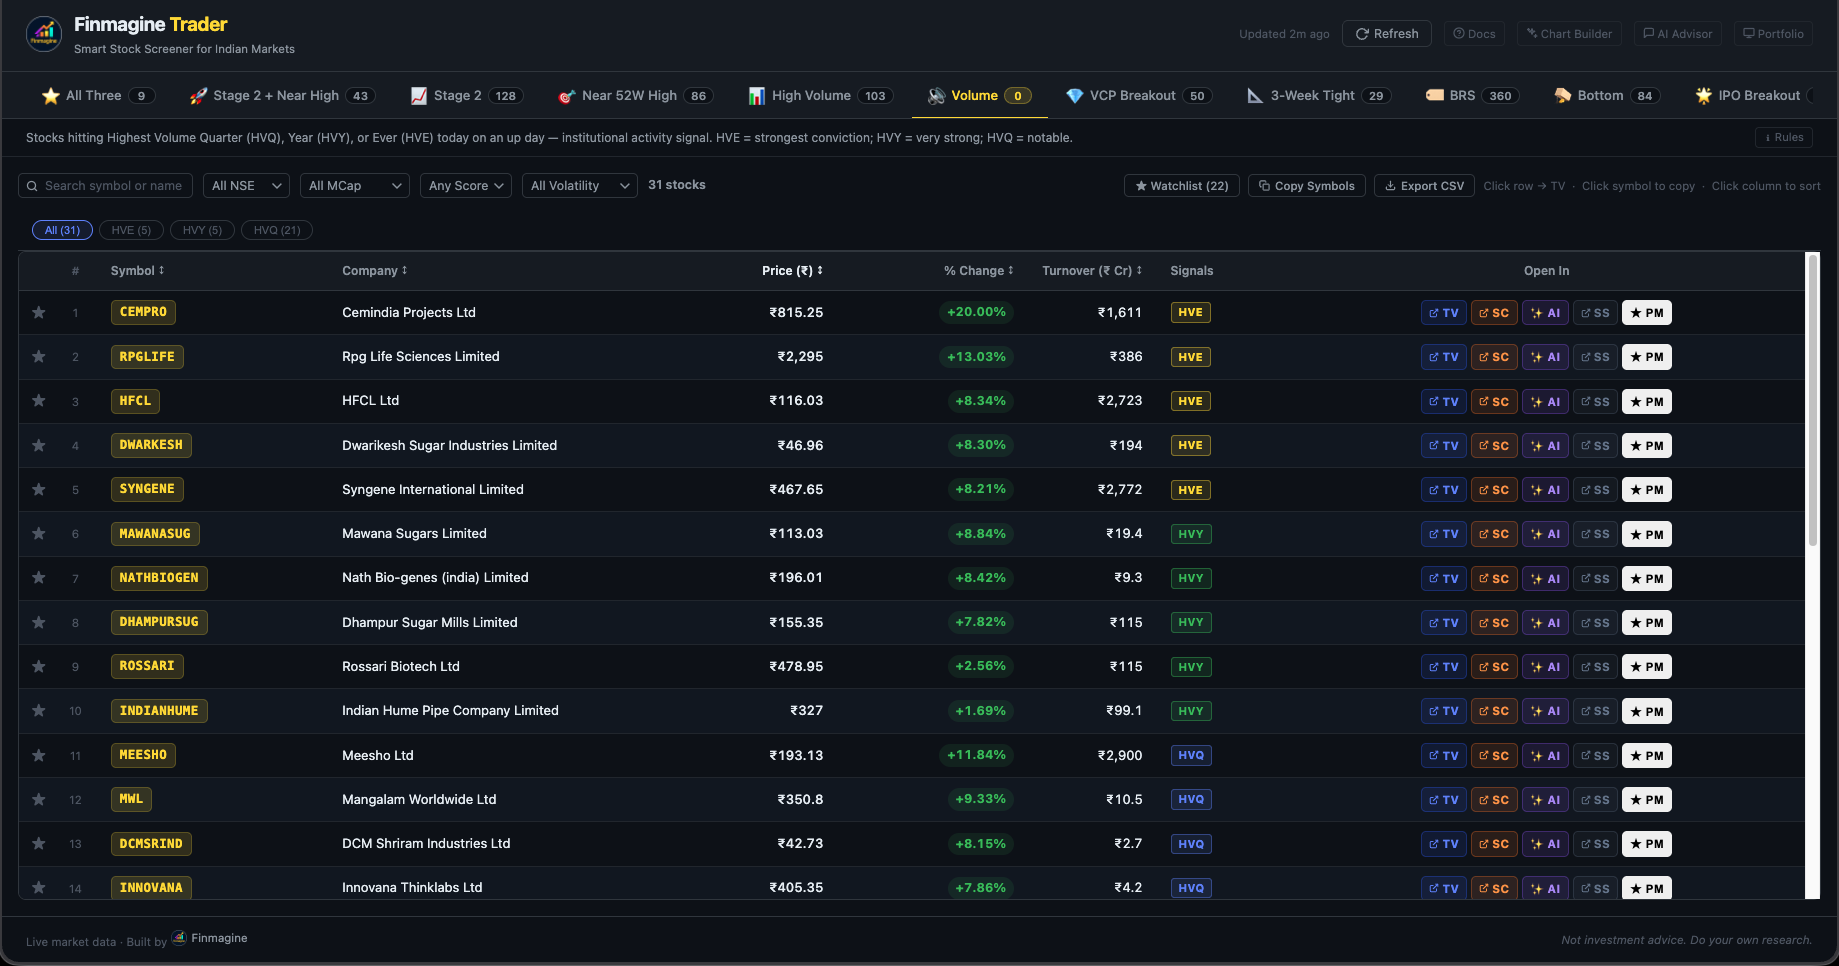
What it does in practice

On a typical scan day, Near 52W High returns ~50–80 stocks. With Tight Volatility ON, this drops to ~5–15. The stocks that survive are the ones where supply is being absorbed quietly — the range is compressing while price holds near
its highs.

The filter is applied server-side in the ChartInk scan clause — no extra API calls, no slowdown. It propagates naturally to the Stage 2 + Near High and All Three tabs through set intersection. Off by default.

Detailed guide (ATR theory, why relative not absolute, DSL implementation, tab propagation):
Tight Volatility: Find Stocks Coiling Before the Breakout | Finmagine Trader

Install / update:
https://chromewebstore.google.com/detail/finmagine-trader/ndkonkooaokgngjhjjefnnkdbmhgekkf

Landing page:
Finmagine Trader - Free Chrome Extension for Indian Stock Momentum Scanning

Would appreciate feedback on the filter — does the ~5–15 stock count feel right, or too aggressive? Happy to add a “Mild / Strong” intensity dropdown in a future version if the community finds it useful.

@gaurav_aggarwal1 — good ask on liquidity.

The extension already shows a Volume column (number of shares traded today). What you’re describing as “volume turnover” — the ₹ value traded — is volume × price, which gives you traded value in ₹ Cr. That’s the more useful liquidity signal for position sizing.

Both fields are already in the ChartInk API response (volume and close), so the turnover column can be computed client-side with no extra API calls. Will add it to v1.5.0.

The column would show something like:

┌────────┬────────┬───────┬──────────┬──────────┐
│ Symbol │ CMP │ Chg% │ Volume │ Turnover │
├────────┼────────┼───────┼──────────┼──────────┤
│ KPIT │ ₹1,840 │ +3.2% │ 8,45,000 │ ₹155 Cr │
└────────┴────────┴───────┴──────────┴──────────┘

That gives you both the share count and the ₹ liquidity number in one row. Would that cover what you need?


Finmagine Trader — NSE Momentum Scanner
Finmagine Trader - Free Chrome Extension for Indian Stock Momentum Scanning
Install: https://chromewebstore.google.com/detail/finmagine-trader/ndkonkooaokgngjhjjefnnkdbmhgekkf

Yes sir and thank you. Today i noticed that there seems to be a small issue in the sector section. I checked Stage-2 where Bliss Pharma is appearing, but when I click on the sector, the stock is not listed there. Could you please check if there is any issue with the sector table mapping?

Is this version live now in the new update?

Thanks for the clear repro — spotted the exact issue.

BLISSGVS (Bliss GVS Pharma) was missing from our sector mapping table. The stock
appears correctly in the Stage 2 scan results because ChartInk returns it fine, but
when you click a sector chip the extension uses a local sector map to match stocks to
sectors — and since BLISSGVS wasn’t in the map, it was silently excluded when the
Pharma filter was applied.

Fix is in — BLISSGVS added to Pharmaceuticals & Biotechnology. Will go out in the
next release.

If you spot any other stocks that appear in the scan but disappear when you click
their sector chip, same root cause — drop the NSE code here and I’ll add them.

Finmagine Trader - Free Chrome Extension for Indian Stock Momentum Scanning

1 Like

Not yet — v2.8.0 is currently pending Google’s review (submitted Mar 7). The float
button redesign and Profile tab are v2.9.0, which goes in right after v2.8.0 clears.

Google’s review usually takes 2–10 days. Will tag you here the moment v2.9.0 is live.

Finmagine Chart Builder - Free Chrome Extension for Screener.in Financial Visualization

Thank you sir for fix the root cause.

Sir, are there any plans to add a Multi-Year Breakout filter? Stocks that break out after 6–7 years often generate multibagger returns, so such a filter would be very useful for identifying long-term breakout opportunities.

Great suggestion — multi-year breakouts are genuinely a different category from the regular near-52W-high scan. The thesis is solid: when a stock consolidates for 5-7 years and then breaks out on volume, the overhead supply is fully absorbed and the move tends to be structural, not just a momentum trade.

The technical approach would be: price crossing above the highest close in the last 5–7 years (roughly 1,250–1,750 trading days in ChartInk’s DSL), with volume confirmation. The challenge is whether ChartInk’s screener engine supports historical max lookback that far — their near-52W-high scans work fine but I need to verify if multi-year max functions are supported before committing to it.

Adding it to the roadmap. Will update here once I’ve tested the ChartInk query and confirmed it returns meaningful results.

Finmagine Trader - Free Chrome Extension for Indian Stock Momentum Scanning

Great work. A feature request, if possible, would be very useful.
Example: If we open a company in Screener and it also comes under the predefined scans of Finmagine Trader, is there a way to directly see the list of scans it is getting qualified into from Screener itself, maybe on the Finmagine AI Advisor tab or Finmagine Chart Builder tab?

Like here, ABSLMC is fulfilling many predefined scans and we can see the list of all on screener itself, which scans what’s coming into it.

@karanshah137 — submitted for review today! Both extensions updated.

What’s live in v2.6.0:

When you open any Indian stock on Screener.in, a Trader Signals bar now appears at the top of the AI Advisor panel — showing which of the 8 momentum scans that stock currently qualifies for:

:star: All Three · Stage 2 + Near High · :chart_increasing: Stage 2 · :bullseye: Near 52W High · :bar_chart: High Volume · :gem_stone: VCP Breakout · :triangular_ruler: 3-Week Tight · :glowing_star: IPO Breakout

One glance before you generate your prompt tells you whether the stock you’re about to deep-dive is also a live momentum candidate right now.

Bonus: Trader now auto-refreshes scan data in the background every 6 hours — you don’t need to open the Trader popup at all for signals to appear.

Both extensions are pending CWS review — should be live within a few days. Will update this thread once published.


1 Like

Sir is planning to release a bottom-out scanner for traders and investors that will identify stocks which have fallen more than 50–60% and are trading near their 3–4 year support levels.

Thanks @gaurav_aggarwal1 — good suggestion. The challenge with a “bottom-out scanner” is the “near 3–4 year support” part. Programmatically identifying multi-year support levels requires historical OHLC data and pivot detection that ChartInk’s screener API doesn’t expose — so a reliable, low-noise version isn’t practical with the current data pipeline.

What you can do today with the existing tools:

  • Price Analysis tab (Chart Builder) — shows 1Y/3Y/5Y CAGR, drawdown from 52W high, and cyclical position. Stocks with deeply negative CAGR + high drawdown are effectively your “beaten down” filter.
  • Finmagine Trader already flags stocks near 52W highs — the inverse (near 52W lows) is one filter away on Screener.in directly.

If ChartInk adds support-level detection in future, a dedicated tab becomes viable. Will keep it on the radar.

1 Like

Is it live v2.6.0? I’m Unable to see the Trader Signals in new update

@karanshah137 — good catch, my mistake in the earlier post. The Trader Signals bar in AI Advisor v2.6.0 requires a companion update to Finmagine Trader that’s currently pending Chrome Web Store review. Once that clears, the signals will appear automatically if you have both extensions installed. Will post here when it goes live. We’ve done the same for Chart Builder as well, but have not been able to submit it for reiew yet because the pipeline is still
blocked!

1 Like

ValuePickr Thread Announcement

Finmagine Chart Builder v2.9.0 released — Profile Tab + Trader Signals Ribbon incoming

Two updates to share:


Profile Tab — shipped (v2.9.0)

On any Screener.in company page, Chart Builder now has a 7th tab: Profile. It pulls the company’s About description (with citation noise stripped), and the Screener Pros and Cons list into a two-column layout — directly in the panel, without leaving the page.

Useful when you want the qualitative narrative alongside the quant. No context switching.


Trader Signals Ribbon — in Google review (v2.10.0)

This one is for people who use both Chart Builder and Finmagine Trader.

Once v2.10.0 clears CWS review, a persistent ribbon will appear above the Chart Builder tab bar on Screener.in, showing which momentum scans the stock currently appears in — Stage 2, Near 52W High, VCP Breakout, IPO Breakout, and All Three (the highest-conviction signal, highlighted in gold).

The practical value: right now, if you’re reading financials on Screener and want to check if the stock has a technical setup, you need to open Trader separately and search. With this, the
signal is already there — visible on every tab, without switching tools.


Both extensions are free. Chart Builder works on Screener.in, Google Finance, stockanalysis.com, and Perplexity Finance.

:link: Finmagine Chart Builder - Free Chrome Extension for Screener.in Financial Visualization
:link: Finmagine Trader - Free Chrome Extension for Indian Stock Momentum Scanning

1 Like

Yet another Feature Request:

As I have exhausted my free unlock insights feature on the screener, I simply wrote these metrics in the Ask Me Anything pre-built Finmagine AI advisor. And got the same and exact results, as all these values are extracted from ConCall, the investor deck, and annual reports.

But the issue was I had to do this for every company. Can we just make a separate prebuilt block or merge this to another existing block in Finmagine AI Advisor, which extracts metrics from the screener page of Insights and finds answers from the document and makes the same table that the screener builds?

Thanks for this great suggestion, @karanshah137! :folded_hands:

We’ve implemented exactly what you described — and it will be live in AI Advisor v2.11.0 (just submitted to Chrome Web Store).

What’s new: Business KPIs template

  • When you open AI Advisor on any Screener.in company page, the extension now automatically reads the Operational Insights table (CPCU, Conversions, Device Reach, Patent data, etc.)
  • A new template called “Business KPIs Deep Dive” includes all these metrics in a structured prompt
  • Works best with Claude or ChatGPT — produces a full KPI trend table, red flags & hidden strengths analysis, peer benchmarking, and a 5-parameter investment score

We tested it on Affle 3i Ltd — Claude pulled the Q2 FY25 concall transcript, built a guidance vs. actuals table, and identified a hidden signal (OCF doubling to ₹426 Cr in FY25 — a 63% step-up not visible in the P&L headline).

The Chart Builder extension (v2.11.0, also being submitted) pushes the same Insights data for users who don’t have AI Advisor installed.

Give it a try once the CWS update rolls out — usually a week to 10 days for review. Would love your feedback on the output quality!

Learn more at https://finmagine.com

1 Like

Excellent. Thankyou So Much for Doing this.

Sounds good. Waiting for hands-on experience of AI Advisor v2.11.0

Also, any updates to v1.9.0 of Finmagine Trader? When is it going live?

Glad you’re looking forward to it! On timeline — CWS review can vary and 1–2 weeks is more realistic.

Trader v1.8.0 has been in review since Mar 23 — so it should be live within the next week or so (CWS reviews typically take 1–2 weeks). Once that’s published, we’ll share what’s planned for v1.9.0. Watch this space!

1 Like