
Its now been close to 4 years since I have maintained my investing records, the performance according to calendar years is shown below.
| Calendar year | My returns | Nifty returns | 100 invested in Harsh folio | 100 invested in Nifty |
|---|---|---|---|---|
| 2018 | -0.63% | 3.15% | 99.36629809 | 103.1512625 |
| 2019 | 11.83% | 12.01% | 111.1261021 | 115.5428994 |
| 2020 | 27.18% | 14.89% | 141.3329775 | 132.7468312 |
| 2021 | 27.30% | 24.12% | 179.9159566 | 164.7644355 |
A more granular performance (on monthly returns is shown below).
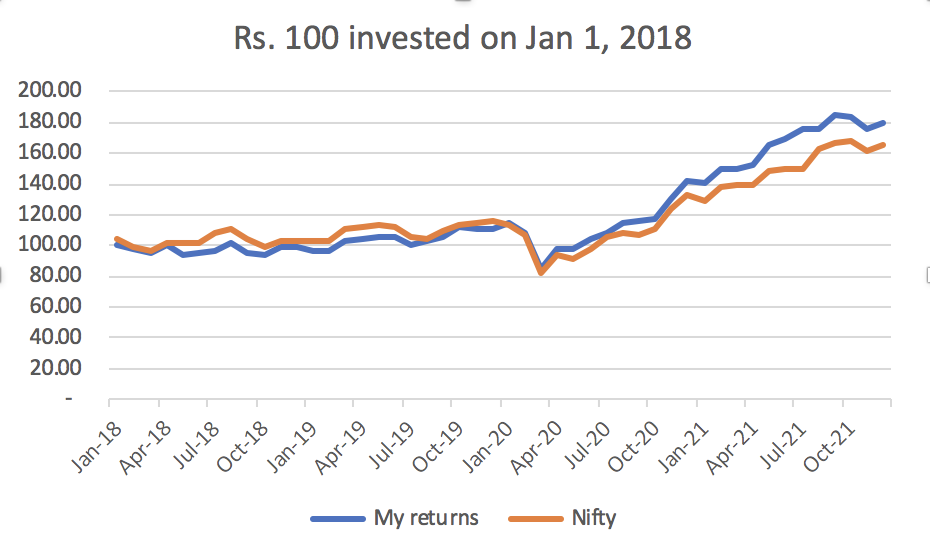
I have managed to outperform nifty over this period, with CY20 being the year with maximum outperformance and CY18 being the year with maximum underperformance. I also track other features of my portfolio. My portfolio beta has decreased over time (computed on monthly data with 1-year lookback).
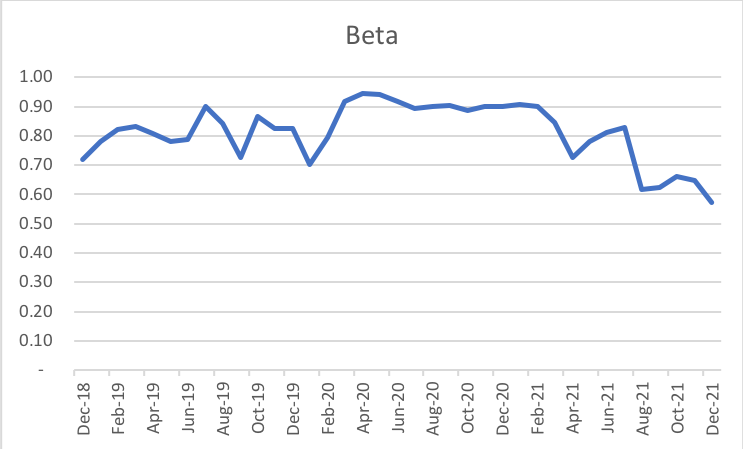
This is mainly because of increasing divergence of my returns with Nifty returns as a result of more bottom-up stock picking. This is clearly shown in the standard deviation chart which has not shown any significant divergence. It has always been slightly lower than Nifty consistently.
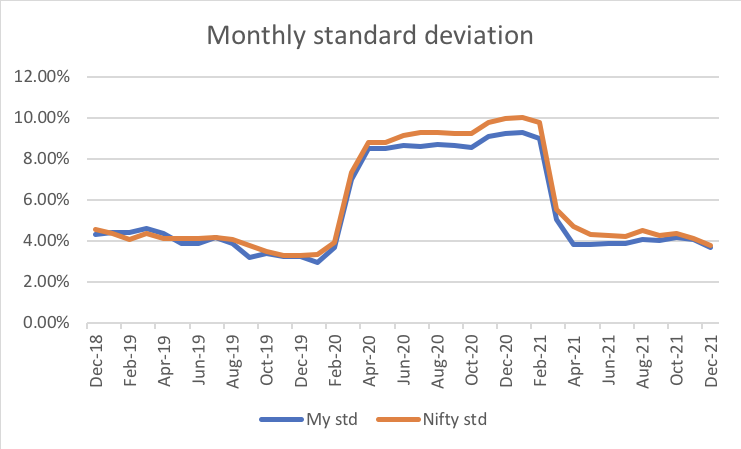
One feature that stands out in the above chart is how volatility regime changed in CY20 and is now back to normal. In changing regimes, there are lots of stock specific opportunities (so called stock picker market). This was also the time when my portfolio performance diverged the most against Nifty. We are now back to the normal volatility regime.
Over a long term period of time, I want higher returns with lower volatility and this has been achieved thus far. Lets see how things happen going forward. Wish everyone a very happy new year and loads of success in life.