No updates! Reason is that a better bet has to be found and I am not tracking markets with much interest.
Apar I do not track but there has to be a reason better than EV adoption or railway electrification for their sales. Power mech seems to be enjoying a good uptick in power demand cycle, not that interested in both.
I only book when it seems overvalued considering my target or short to medium term outlook. I do not trail my positions since they are banking mostly on fundamentals with a longish outlook.
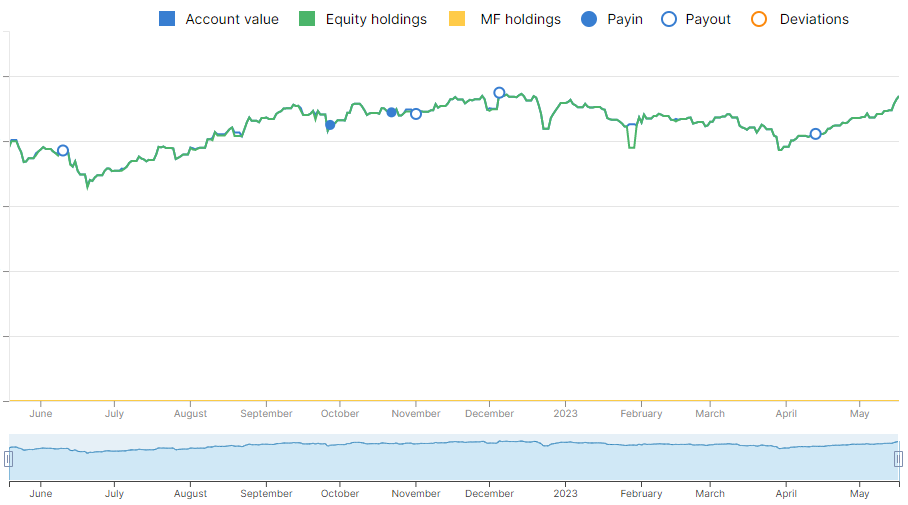
Not that bad, a ~10% gain in approx 18 months since first peak was hit in august 2021. PF at peak again, upon adding back the various withdrawals due to taxes in FY21 and FY22 since the first peak, among other reasons for periodic withdrawals. And latest temporary hit is due to Redtape shares not being valued yet, so not showing up in the value graph below. Nifty smallcap indices are 10% down since peak in december 2021.
Value-research folio service estimates a CAGR of 23% since sept 2017.
Currently the only significant lossy position is Best agro and outlook seems not so good here with monsoon troubles forecast. So a 1-2 year timeline may be required to wait for their brownfield expansion too.
Tinna has given good short term returns, so have Diamines, Shivalik and Guj Themis. Ujjivan and IDFC dominate with their top 2 position in PF, one is ~3x other is ~2x. So, the lossy trades made in recent past have impacted overall returns.
Current folio: (sorted by “% of Total”, best and simplest is to focus only on the “Current return %” since the others include the historical trades since 2017, as computed by value-research folio service)
Company name
Last price
Cost per share
% of Total
Return % pa
Total Return %
Current Return %
1
Ujjivan Financial Services Ltd.
337
124
17.6
134
167
171
2
IDFC First Bank Ltd.
67
38
11.4
74
74
77
3
KPI Green Energy Ltd.
535
431
8.2
35
24
24
4
Gujarat Themis Biosyn Ltd.
795
608
8.0
64
40
31
5
RBL Bank Ltd.
144
105
7.9
36
38
38
6
Kilpest India Ltd.
429
362
7.7
17
18
19
7
Ugro Capital Ltd.
198
173
7.0
2
3
14
8
Shivalik Bimetal Controls Ltd.
527
196
6.3
99
170
169
9
Tinna Rubber And Infrastructure Ltd.
550
381
6.1
234
44
44
10
Diamines & Chemicals Ltd.
549
416
5.3
181
56
32
11
Agarwal Industrial Corporation Ltd.
670
591
4.6
51
13
13
12
Satia Industries Ltd.
113
120
3.8
-17
-5
-6
13
Best Agrolife Ltd.
1099
1439
3.3
-52
-29
-24
14
Meghmani Finechem Ltd
948
772
2.9
16
23
23
Total Stocks
100
23
Still interested in financials, outlook is positive and valuations cheap. Maybe the smallest position gets the chop. A good company compounds, so waiting a bit long is a good thing, if the choice of buy seems to be working out ok. This strategy is given limited bandwidth, for not doing that badly.
Got bit bored holding Satia, very cheap and stable, looking at cheap alternatives found Godawari again attractive, but this will face macro issues around global ore prices, and expansion will take 2 years, it is cash heavy, so expect good dividend/buy-back while waiting.
Hence, sold Satia and bought Godawari, as smallest folio allocation. This is betting on macro bottom which is bit risky ahead of recession forecast in the west for next year, thinking China and India etc. can even out the bumps.
Also sold off Meghmani finechem which was the smallest folio allocation and bought more of Ugro. Just trying to reduce holding and concentrate on the winners. Ugro just turned profitable for me while Kacholia or some big fish just entered.
Satia is very likely a manipulated scrip, lots of local Punjabi companies holding it which have been selling and putting pressure on price, trading almost flat since 3 years.
My exits could be timed better, the issue here is that the alternate buys are also a moving target. Altogether very minor tax implications was also a big reason. Its easier following people like Ayush Mittal, he is a fan of Godawari, but of course his entry point would be much cheaper. Have made good money in Godawari previously also.
Also added a tiny bit to RBL bank, financials are now all in top 4 of folio by position size, Ujjivan, IDFC, Ugro and RBL in that order, 50% by total weight.
Needed funds hence sold off the smallest allocations, Agarwal ind and Godawari, idea being to concentrating holdings, bought Caplin point with funds, added little bit to KPI green, Kilpest, Best agro, RBL bank and Ugro in that order.
Caplin point looks like a sterile injectibles and API integration growth story tracked by valuepickr folks since 2012 with zero returns since 2017 in spite of 4x growth, consistent multi-decade growth story, expanding now into US and near east, west africa etc.
Missed at 600 level, seems pharma pack tanked then unexpectedly, found at 750 level and took a few days to get serious and make a trade.
Agarwal was mainly growing due to shipping biz which they added to their inland logistics, now they had 6 ships and 2 added a few months ago, this is the growth trigger which is getting weaker, good promotors no doubt.
Godawari is slave to iron ore prices, China slow down is a big worry, so ore can stay low and this one takes too much patience with years with no plans, they just sent their proposal for expansion to govt. They did buy back at almost double market prices, how is that helping holders of shares? Usually infy, wipro etc. do buy operations from market.
Caplin may get re-rated due to quality of execution with capex ongoing and the entry into US.
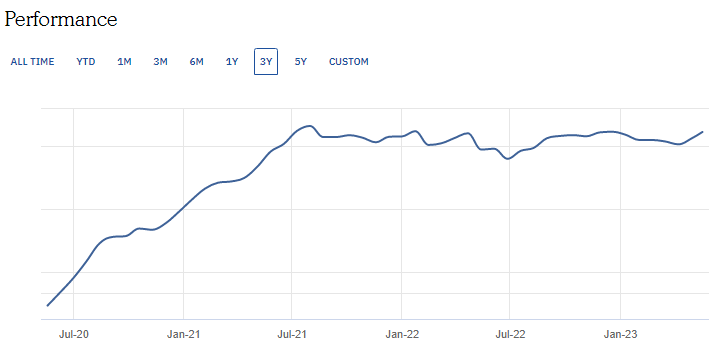
65% increase since past 4 months after almost nothing for approx 2 years! Just sitting tight and enjoying the ride!
Cagr in past 2 years is 27% a bit lower than the average cagr computed by value research folio service since inception in September 2017. Nifty has given 5% cagr in past 2 years.
Current folio: (sorted by “% of Total”, simplest is to focus only on the “Current return %” since the others include the historical trades since 2017, as computed by value-research folio service, best would be to focus on “Return % pa”, since time is of the essence)
Note:
Total 13 stocks, missing here is the value of redtape shoes which is yet to be listed and start trading. Value is decreasing due to expenses withdrawal all the time, including a second car etc. Total returns are computed by adding back the cash withdrawals and also an approximation of redtape shoes value.
PS:
Value research service doesn’t take into account the blank time period (of total sell off) in between consecutive investments in a stock, hence cagr at stock level is always shown lower.
Also it seems total returns ignore the dividends, not sure about this part. My estimate for total cagr would be 1% higher.
Apologies for Off-Topic. Will delete in some time.
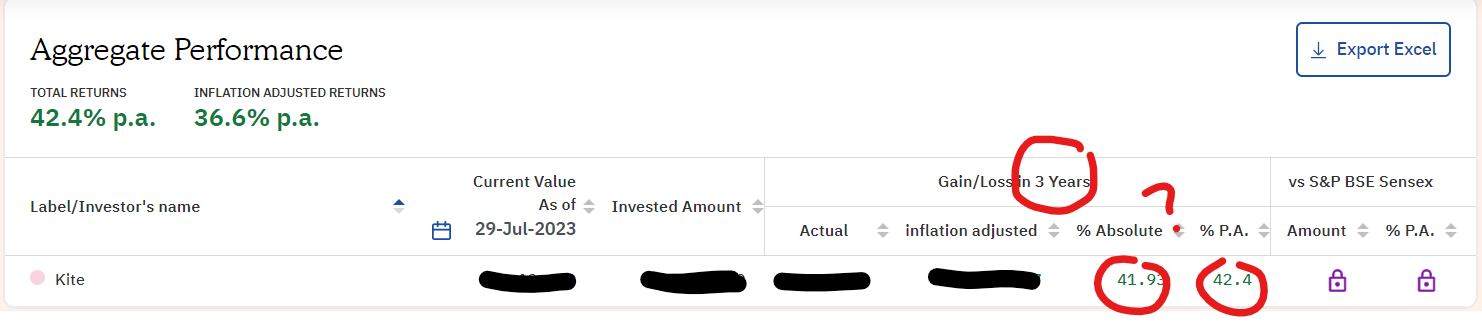
I believe ValueResearch includes dividend by default- at least their exported Excel has it listed. But I don’t know how their CAGR calculation is being done. They are showing a CAGR higher than Absolute Growth % in 3 yrs - and a number vastly bigger than the number from my excel calculations including dividend. (The current and invested amounts in VR are within 3% of same from my spreadsheet)
3 yrs in spreadsheet - (37.6% Absolute) - (13.39% CAGR)
3 yrs in VR - (41.93% Absolute) - (42.4% CAGR)
For me it’s a decent match, 28% compounding over 6 years gives a growth factor of 4.4x, which is indeed the case for my folio, so it appears value research total cagr is mostly correct. I think it errs a bit on the lower side, like by 2% or so. Adding back redtape missing values gives cagr of 31%.
Absolute growth looks to be ignoring previous transactions and only looking at current total amount invested and the delta over that.
It’s your money so you should have some clue between such wildly different numbers.
My transactions are bit easier though, mostly some lumpsum, and then lower order withdrawal only recently, fully invested all the time.
PS: I may be wrong about individual stock cagr comment for value research, looking correctly computed nowadays.
PPS: counting March 2020 bottom as starting point for cagr calculation, the figures are 15x or 145% pa
Sold off IDFC Bank and split the funds equally between fusion micro finance and arman finance.
Both are micro finance, Arman is quite small, technically seemed good point for entry. IDFC bank was only bought coz it had fallen to 30.
Have invested in Arman before, it’s a legend in micro cap investing circle, Fusion listed recently and seems a better bet than satin, spandana etc. IDFC Bank seems technically ok for exit, it’s likely to consolidate below 100 for a while.
Basically got greedy, IDFC can do 20% cagr easy for next 5 years but if credit cycle lasts that long then riskier companies can do better, IDFC was my only mid cap bet, now all are small cap. Being careful though in choosing better ones in a risky sector, the growth trend is just coming back. Anyway had been reducing IDFC slowly by selective sell for the largest withdrawals.
Thanks for mentioning this, indeed CreditAccess is a close competition/good deal compared to Arman. It will be on my radar
I’m paying premium for smaller size which should translate into scope for higher growth, also RoE is almost double for Arman.
Sold out fusion micro finance since I am owning 50% financials with majority focus on similar theme. Invested in phantom digital. Very few stocks are cheap now, here maybe industry is growing at 50% so if held for more than year it can be profitable. The deployment of IPO money into hiring and fixed assets just picked up pace so outlook is good with patience.
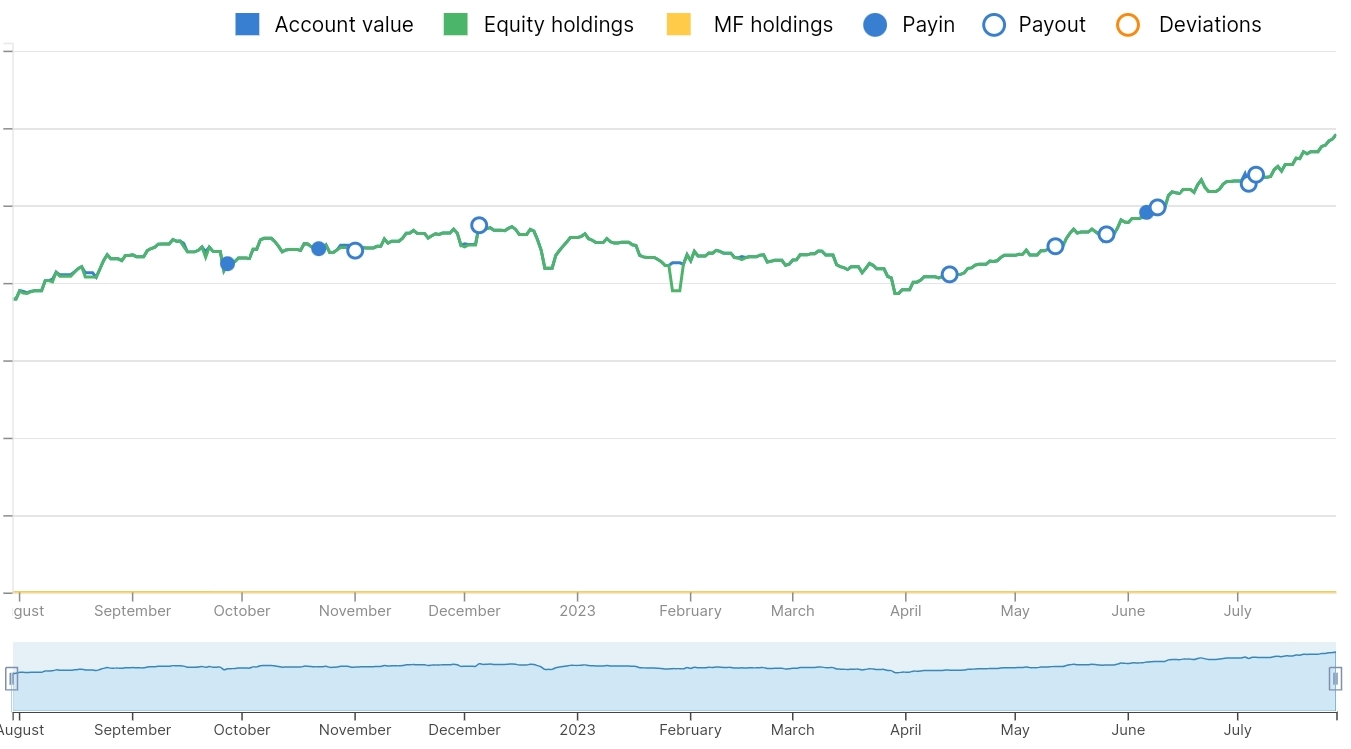
Folio has almost doubled in 5 months since April low point, holding zero cash.
PS: what’s really helped is redtape strong listing, kilpest zooming and financials like ugro, ujjivan rising, caplin showed decent performance also. All are still imho cheap or fairly priced.
Latest folio status:
85% increase in past 5 months since April low point!
Current folio: (sorted by “% of Total”, simplest is to focus only on the “Current return %” since the others include the historical trades since 2017, as computed by value-research folio service, best would be to focus on “Return % pa”, since time is of the essence)
Company name
Last price
Cost per share
% of Total
Return % pa
Total Return %
Current Return %
Ujjivan Financial Services Ltd.
509
124
17.7
158
309
311
Kilpest India Ltd.
783
366
9.9
69
114
114
Ugro Capital Ltd.
294
183
9.3
43
53
61
RBL Bank Ltd.
233
110
9.3
75
113
112
KPI Green Energy Ltd.
857
442
9.3
94
94
94
Redtape Ltd.
447
156
7.9
–
186
186
Tinna Rubber And Infrastructure Ltd.
431
191
6.4
267
127
125
Gujarat Themis Biosyn Ltd.
895
611
6.1
58
56
47
Arman Financial Services Ltd.
2286
2262
4.9
11
1
1
Phantom Digital Effects Ltd.
487
503
4.6
-84
-3
-3
Shivalik Bimetal Controls Ltd.
549
196
4.4
79
181
180
Caplin Point Laboratories Ltd.
1045
807
4.0
79
30
29
Diamines & Chemicals Ltd.
539
416
3.5
157
54
29
Best Agrolife Ltd.
1161
1376
2.9
-28
-20
-16
Total Stocks
100
29.6
145
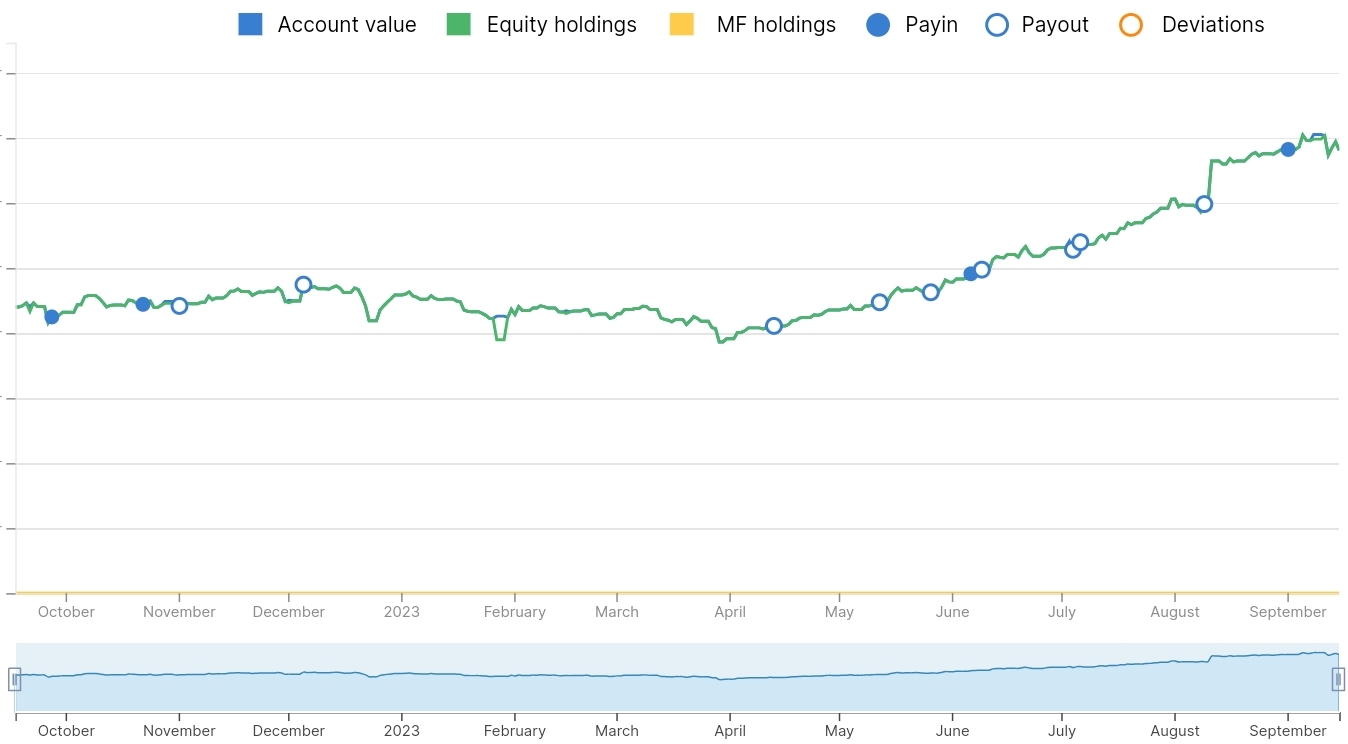
CAGR is 30% at the very bare minimum (since September 2017), also see the comment for the value graph related to Tinna. Value research folio fails to display large numbers hence Redtape shows a blank.
This growth rate gives ~6x over past 6 years.
Cherry picking March 2020 as baseline for CAGR gives 125% growth rate.
Kilpest zooming to second largest position after one year of bare breakeven, quite similar to Ugro in this aspect.
Caplin looks to provide steady growth just like the bunch of financials and KPI green, possibly Redtape and Tinna too.
Past year graph: (courtesy zerodha)
Graph may not look at exactly ATH but this is because of bonus shares of Tinna waiting to be credited.
Congrats on your superb return. More power to you. Someone who just copies your idea would have done very well indeed I had infact held on to kilpest and ujjivan because you had them in your portfolio.
One question, how were you able to allocate 17% to ujjivan especially at a time when the CEO Nitesh chugh resigned and there were couple of resignations across the board. Also that time few Finanicals going kaput was fresh in public memory. How did you build conviction on this idea.
Good choices
See, I have always been interested in the micro finance and also banking sector etc. Search for ujjivan and you can see references going back to 2020. To my naive mind, financials look cheap because the market values them mainly on book and not earning, conservative valuation, which if outlook is good then provides good opportunity.
I have acknowledged the person whose extensive write-up was the trigger.
The top guy leaving was from HDFC bank, I think systems incharge there. HDFC systems breakdowns were the talk of town, RBI had banned them from issuing credit card due to this. Ujjivan at height of COVID crisis was a career move like jump from frying pan into the fire Too much was being discounted in price by a panic mode market. FIIs like banking simply because they reflect India macro without studying too much detail of Indian markets, they started dumping stocks when rates rose in US. Due to this I got many at bargain when COVID was totally over and markets recovered, around or lower than March 2020 prices.
I have invested in RBL bank also, thinking banking is such a highly regulated business and that RBI is being extra careful and proactive coz it simply cannot allow eggs on it’s face time and again. Contrarian thinking is good for making money, with calculated bets of course.
Also the percentage of 17 is total current size in folio and not the initial invested amount size. Then I didn’t have 14 holdings but 20+, and amount in each was less.
I’m trying to keep numbers of stock in folio around a dozen or so. This limits scope of ideas. Anyway half is just financials. Will admit to missing the bus on capital goods. My excuse is that there are cycles in lots of things but capital goods can be severely cyclical, and timing cycles is quite counter intuitive. You buy when valuation ratio reach high point and sell with decline. With commodity stocks I’ve not had a good experience doing the cycles
Yes, there is a good case to liquidate Redtape, on the other hand the biz is doing well and still not valued as per fashion retail, especially with good metrics and better outlook post demerger. So, good growth with some room for rerating too. Just trying to keep a balanced view on a developing story, which may end with liquidation indeed.