To us , it seems like a stock-pickers rally.
Recovery !
We recently wrote this note somewhere else. Hope this would be helpful.
Types Of Bounces !
During recovery of the markets , one should know the type of bounces he or she is playing .
All stocks bounce during recovery but there is a fine difference .
Generally speaking there are 2 types of bounces after a stock has fallen :
Type A
-Type B
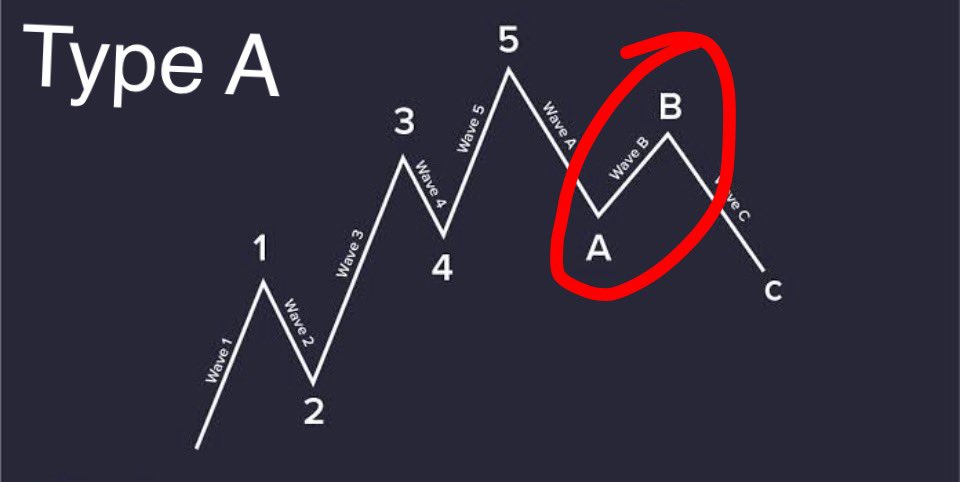
Type A
This happens in certain stocks where valuations have gone very high or some false narrative was built .
Here stock falls a lot ( leg A ) and then recovers a bit during recovery ( leg B ) because many of the retail investors find the stock very cheap ( they count the fall %ge from the top and don’t understand the valuation part and think that stock has become cheap and jump into it )
Here stocks falls ( A ) , recovers a bit ( B) and then after sometime it starts falling again ( C )
In these type of stocks , it may take years to achieve their previous high -levels or they may never achieve it .
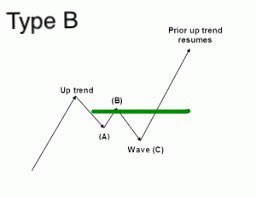
Type B
These are those stocks that had also gone up , valuations were good ( not extreme ) , but these stocks also fall along with the market .
And they complete their fall during the first part of correction .
Value buyers ( who understand fundamentals ) find them cheap and start accumulating.
These are the stocks that have high probability of crossing their last time highs .
Keep in mind - nothing happens in straight line - both type A and type B stocks would go up and down but one needs to see which is going in uptrend and which one is making dead- cat bounces in a downtrend