
Sorry to say that our count is very different.
(Quartely chart also looks very different at our end …don;t know which chart has been used in the picture above)
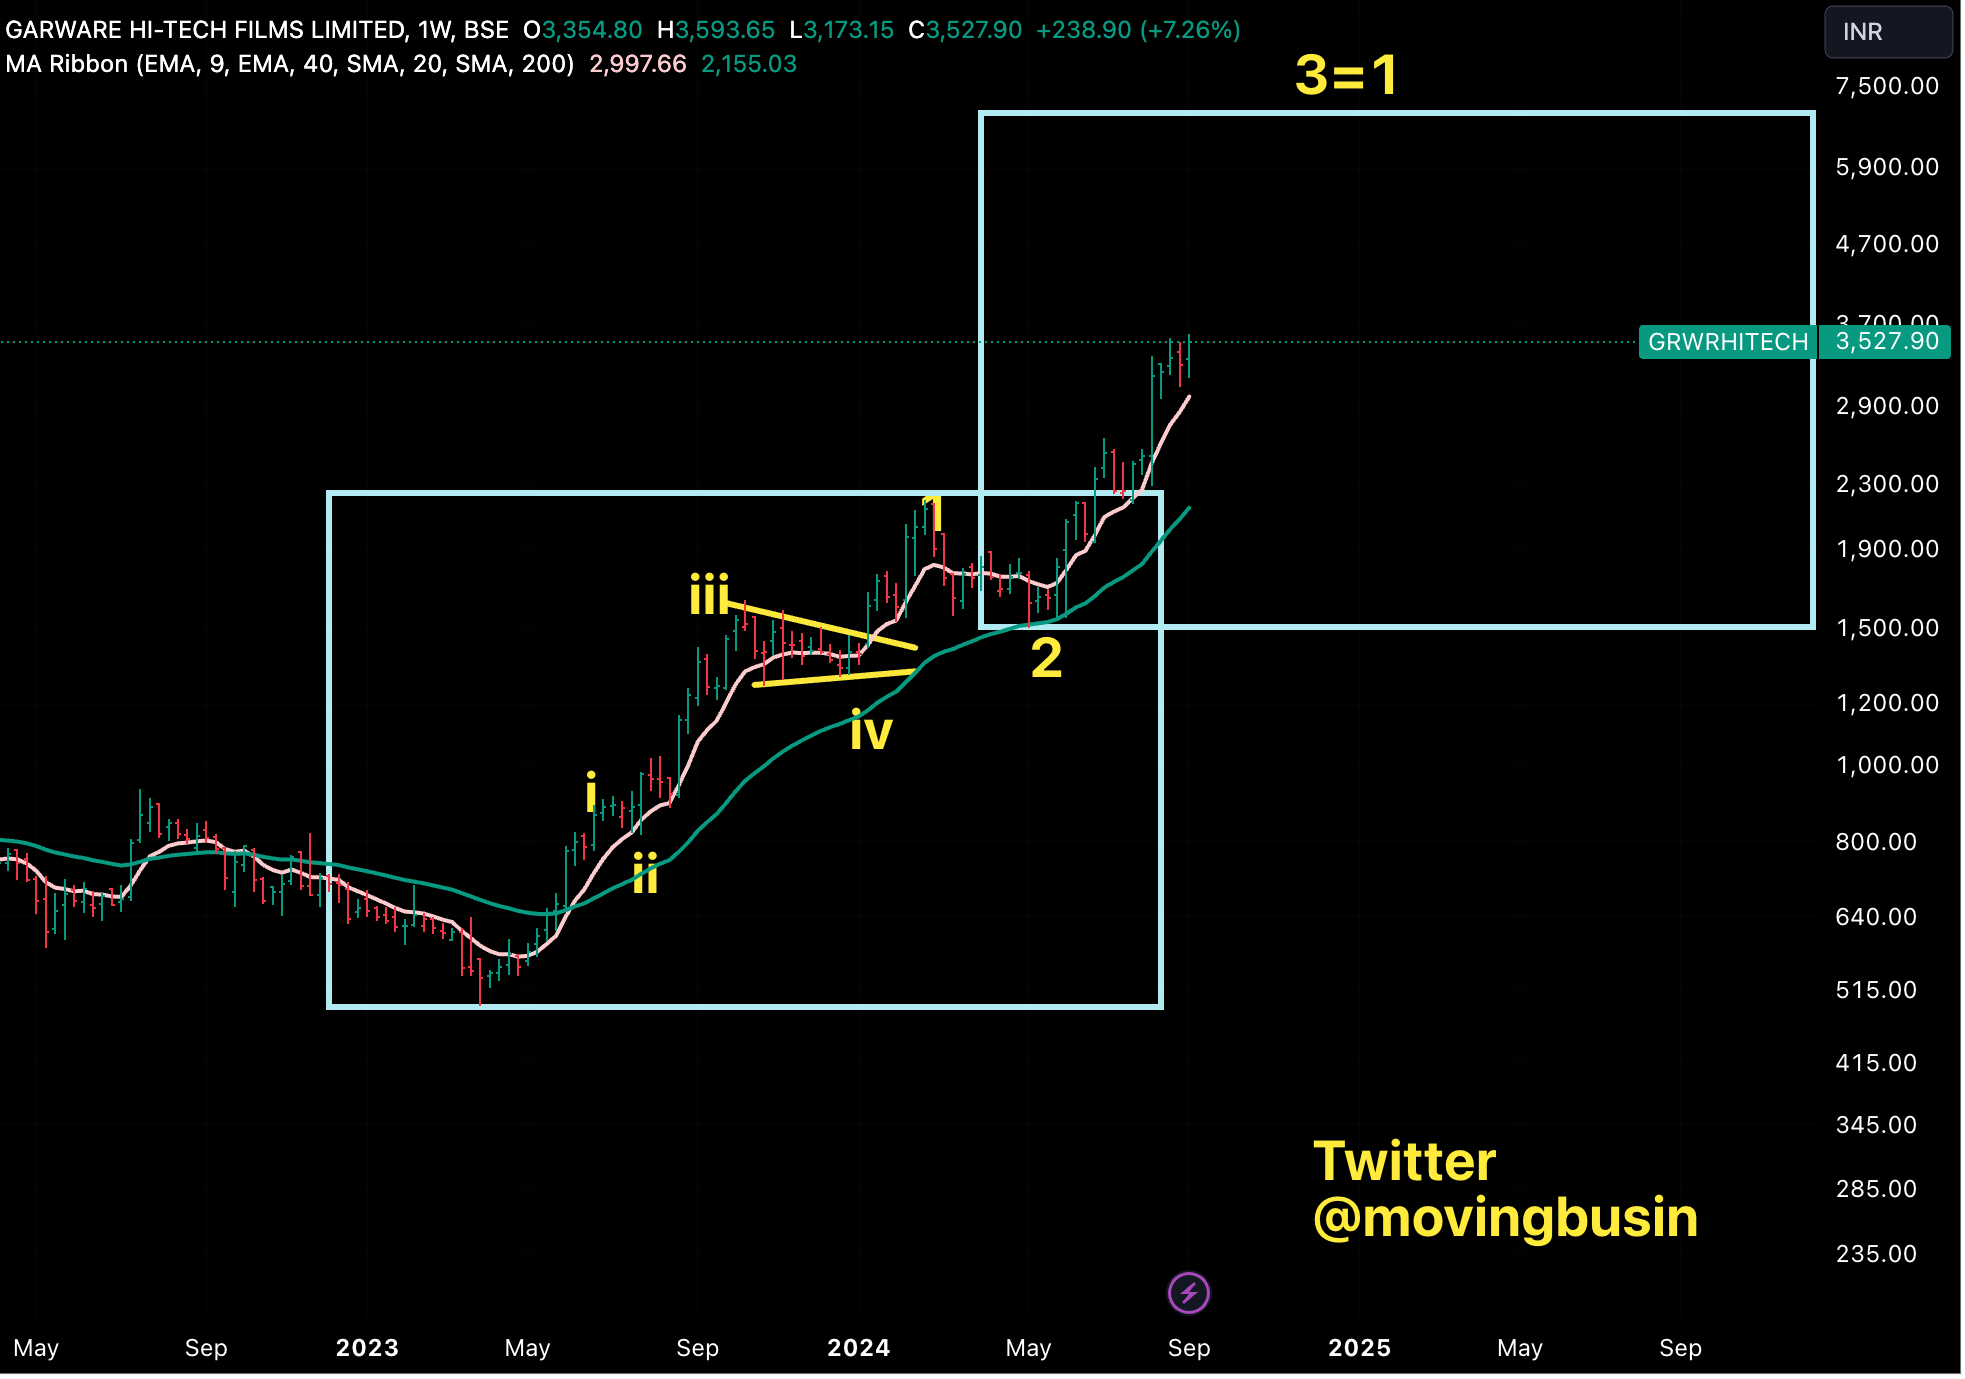
From 2023 lows.
Weekly Chart
Disclaimer : Views are personal. No buy/sell recommendations. The projection is based on our technical -probability study methods and chances of success/failure depend upon various factors.