
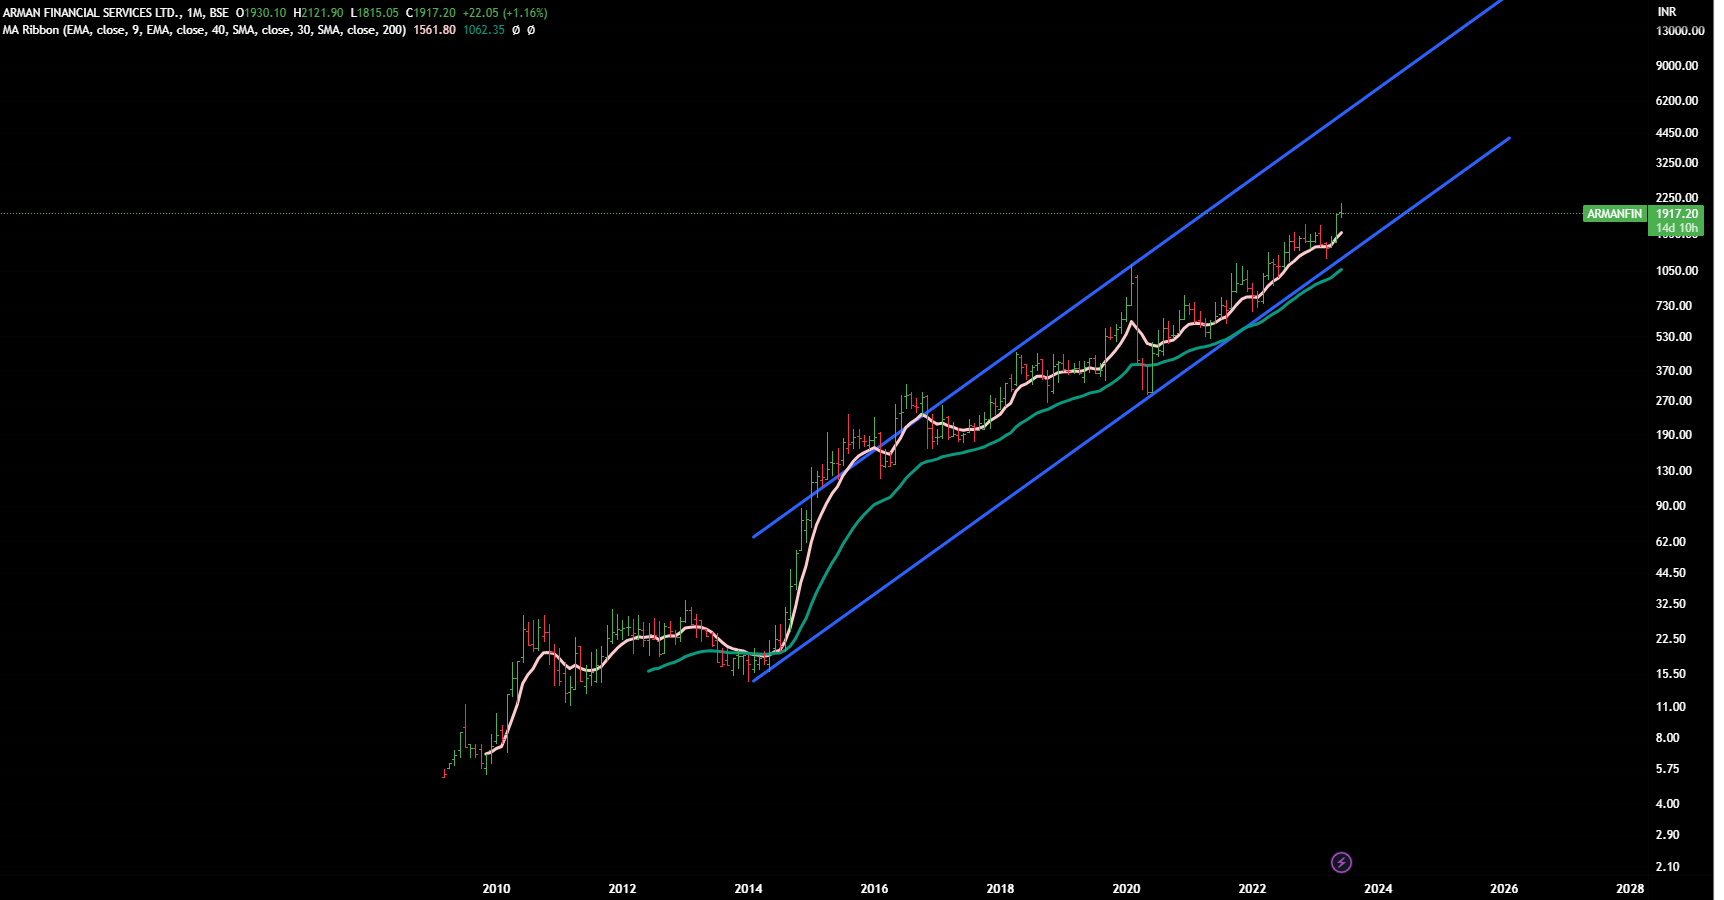
Target as per elliot waves
Arman Fin
EW counts in this chart are little complex, hence not sharing.
Just use the channel on monthly chart - the target can come anywhere between 5 -6 k .
This is a monthly chart , so no expectaions on short term basis. This can take 3-5 years to play . For us 2.5 to 3 X in 5 years is a decent return for core-portfolio as it comes to be more than 20% CAGR.
Monthly Chart
1 Like
Elliot wave is very fascinating sub part of technical analysis,anysource orbook that could be useful to learn the subject
Books might not be helpful. You need to find some good practitioner as constant feedback is required. And it might take 1-2 years to attain a decent level of expertise- passing though different market phases is also important.
Hi…U had replied for one of my query regarding Tejas networks months back…could u pls share your view now as price is reaching ATH
1 Like
June 20th Update
1.PB Fintech
2.PayTm
3.ZenTech
4.Sonata Software
5.Sandur
6.Ujjivan
7.Equitas
8.Dynemic Products.
9.Aarti Pharma (special situation )
10.GRSE
11.Apcotex
12. Carysil
13.Mahrastra Seamless
14.Newgen
15.Wabag
16.Neuland Labs
17. Cochin Shipyard
18. Arman Fin
19. Suyodaya
20. Shriram Finance
21 .HDFC AMC
22. Swaraj Engine
23.Car Trade
24 .Xpro
25.Happiest Mind
Exits : Camlin Finechem ,Apollo Sindoori -Relative strength is lower vs Market
New Entries : HDFC AMC, Happiest Mind ,Shriram Finance
- 2 Tracking postions -MSTC , Isgec Engineering ,
90% Invested.
No Buy Sell reco
6 Likes
I don’t find Godrej property in the list ? Is it sold off due to lower strength?
1 Like
Oops…it is there. Missed it in while posting the portfolio.
2 Likes
can you please share your views by looking at the Chart of Aarti Drugs and IDFC ltd.
TKS. How is Bharat Rasayan placed now ? Bottom formed ?
How id Suryoday & Fivestar business finance placed brother?
@StageInvesting - Request you to please let us know why is it mentioned Aarti Pharma (Special Situations)? because of the de-merger?
Yes, it was demerger. Mid & large cap mutual funds had to sell Aarti Pharma and it provided a mismatched opportunity.
1 Like
Aart Pharma came up with a investor presentation now. I think their growth projection ~15% range didn’t enthuse the market much. Any views ?
I guess the opportunity still exists as there has been not much price action in the stock. It is yet in the discovery phase right? Open for other views
When you put that box Wave 3 = Wave 1 , how do you draw that box ? Is it based on the exact price difference between top & bottom of wave 1 or is it the box height ? What is the chart scale used here ? Arithmetic scale will give the price delta while log scale will not . So , how do you do that ? Which is correct to use arithmetic or log scale while drawing out that Wave 3 target box ? Also , sometimes fibonacci multiple of Wave 1 length is used for Wave 3 . So , how do you draw that ? Do you use arithmetic scale or log scale chart for this ?
Boxes are made on log charts.
Just draw the box from bottom to top of a wave and jsut copy/paste it where bottom of the copied boax coincides with the level from where the new starts.
Bharat Rasayan
It is still in sell -mode on weekly/monthly charts.
1 Like
Suryodaya , FiveStar
Both look good …Sfirst one is our portfolio also . Latest Portfolio shared on June 20th.
1 Like
Thanks for confirming that Box is drawn on log chart. I have seen many practising this using aritmetic scale chart . In that case the box height is just the price delta of Wave 1 & therefore it becomes insignificant in higher waves 3 or 5.
One more query if you could help on this. I have seen many saying wave 3 extension to be 161.8% of wave 1 or sometimes 261.8% , 461.8% which are fibonaaci numbers. Now these extensions are nothing but extension of price delta of wave 1 if I understand it correctly.
In practise , which one is more used ? Wave 3 = Wave 1 ( log chart ) or the above fibonacci extensions of wave 1 ( which is extension of price delta ) ?