Ujjivan Finance
Special Situation Investing
Via Technical Analysis
I came across this Special Situation - It is the reverse merger arbitrage. On can read more about fundamental thesis by clicking on this link -Ujjivan Financials -Reverse Merger
Like everyone else, I like Special Situations -especially in a sideways /bearsih market as these sitaution provide some basic safety in the form of value unlocking ( in bull-markets, I tend to get into these situations only at critical junctures as these things take time to work-out and capital is limited).
So how I plan to play this situation 
Route 1
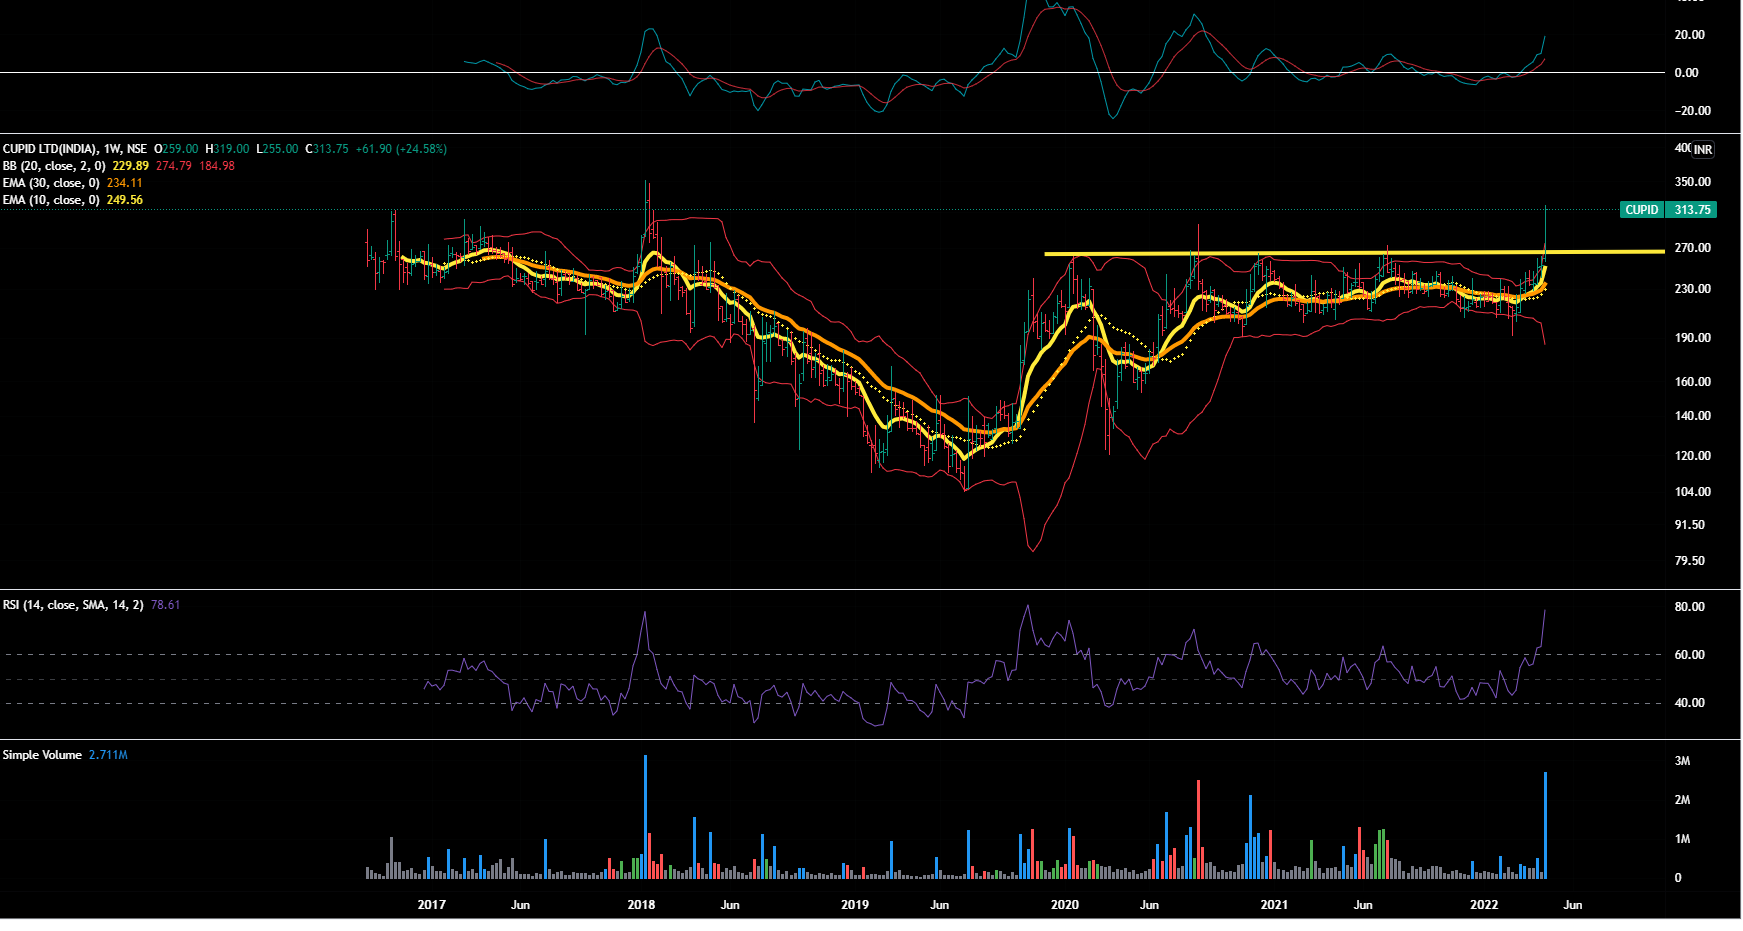
Stage Analysis and basic Technical Stuff
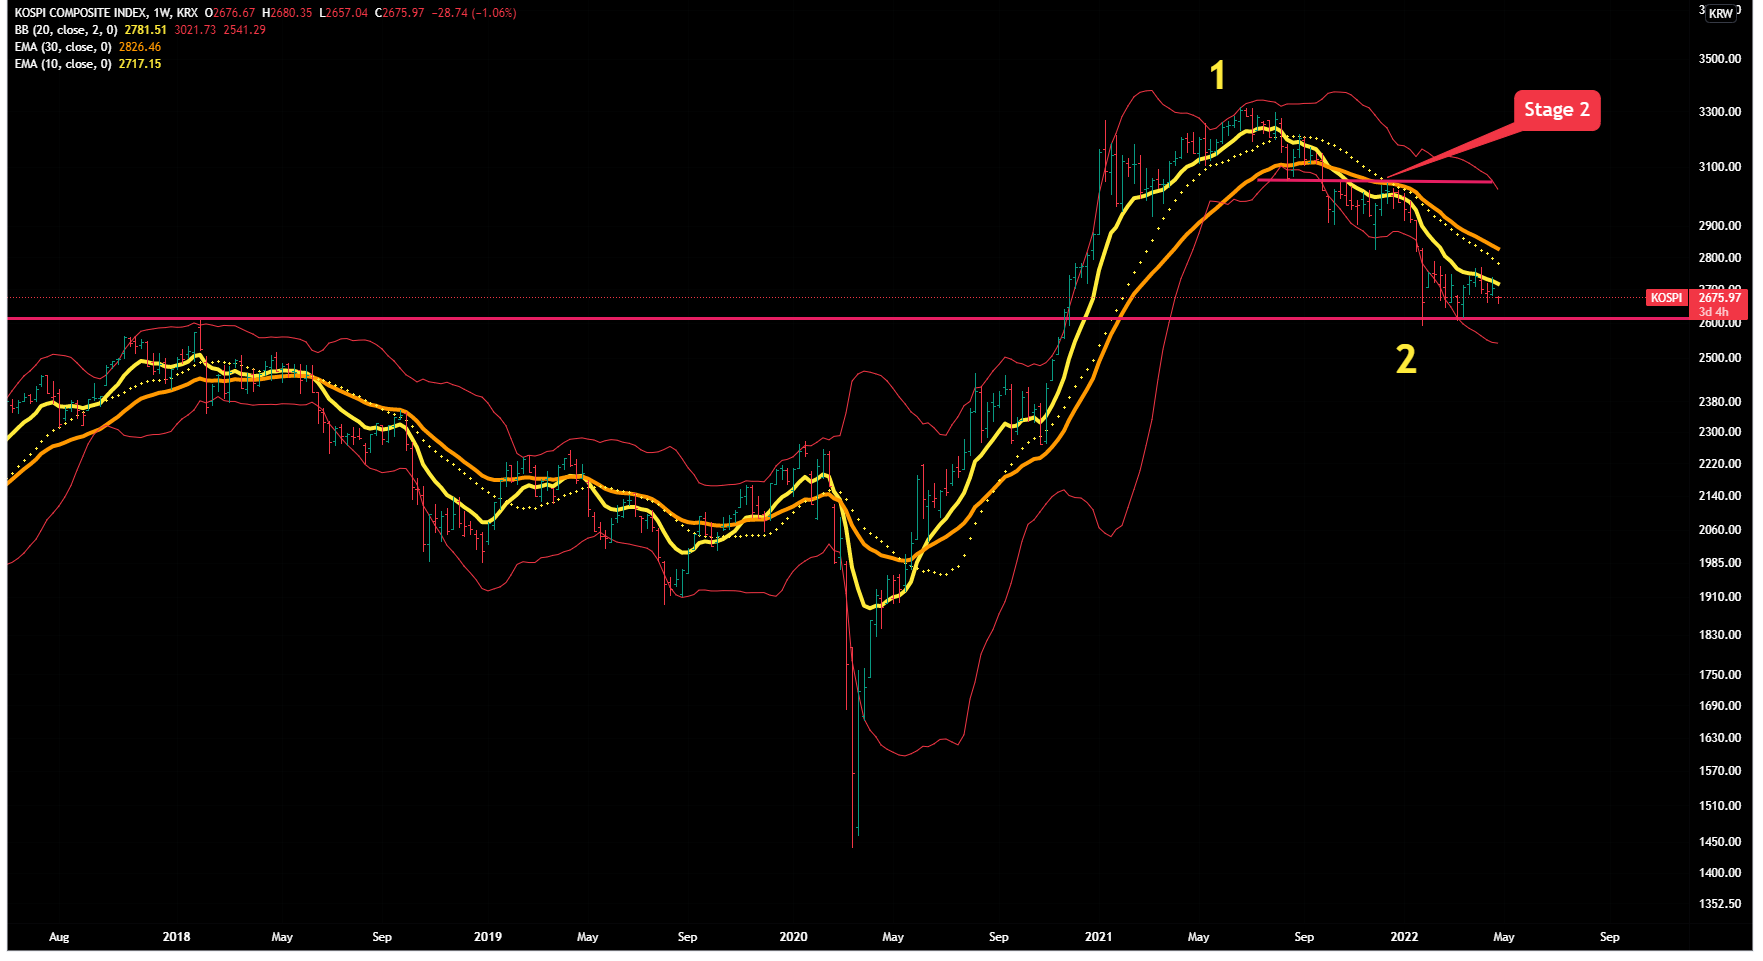
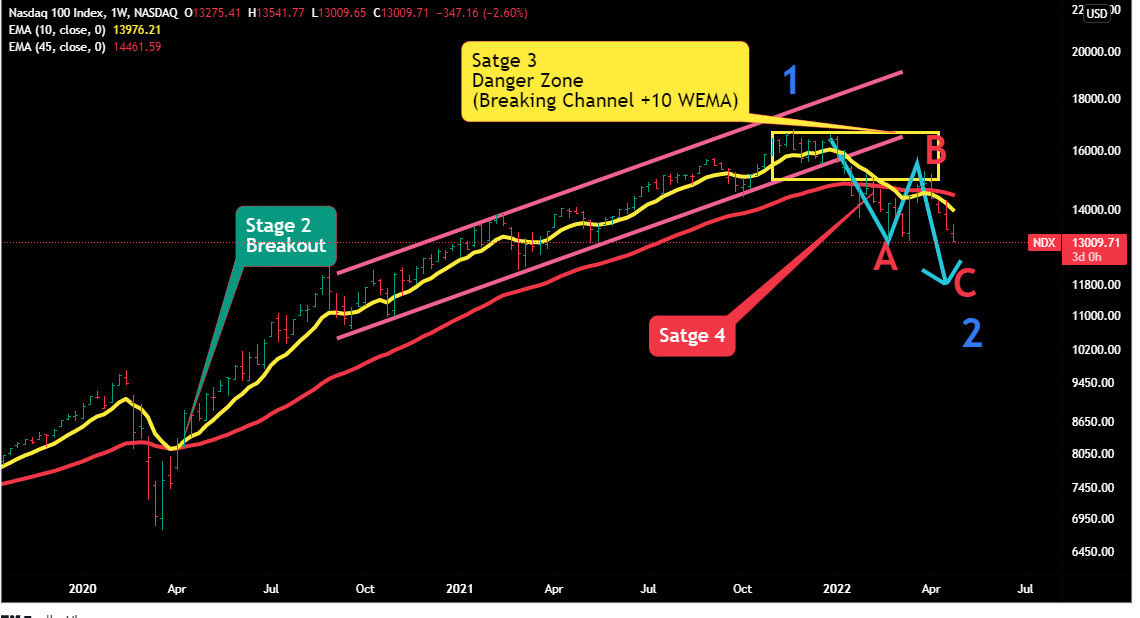
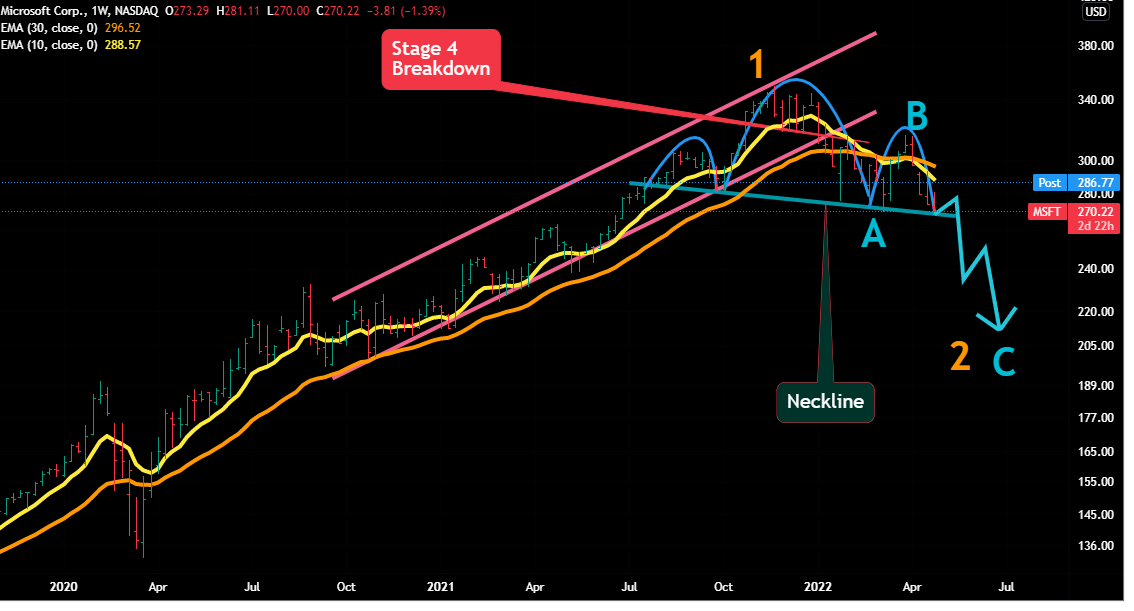
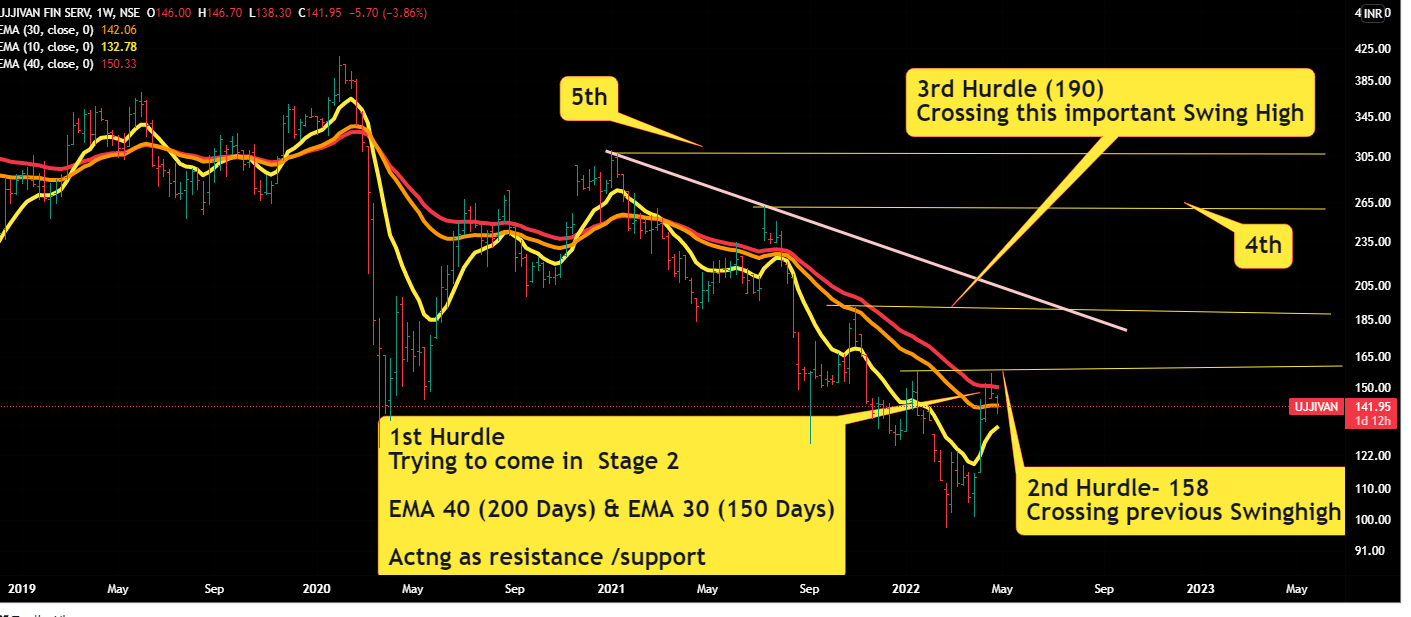
As per stage analysis, this stock is in S3 ( oscillating between S2 & S4- trying to form a base - and that is a good thing- a stock should consolidate in S3 for sometime so as to shake out the weak hands.
Keep in mind ,the longer the base i.e. S3 , faster the upward thrust when it breaks out S 2) - it is trying to breaksout in S2.
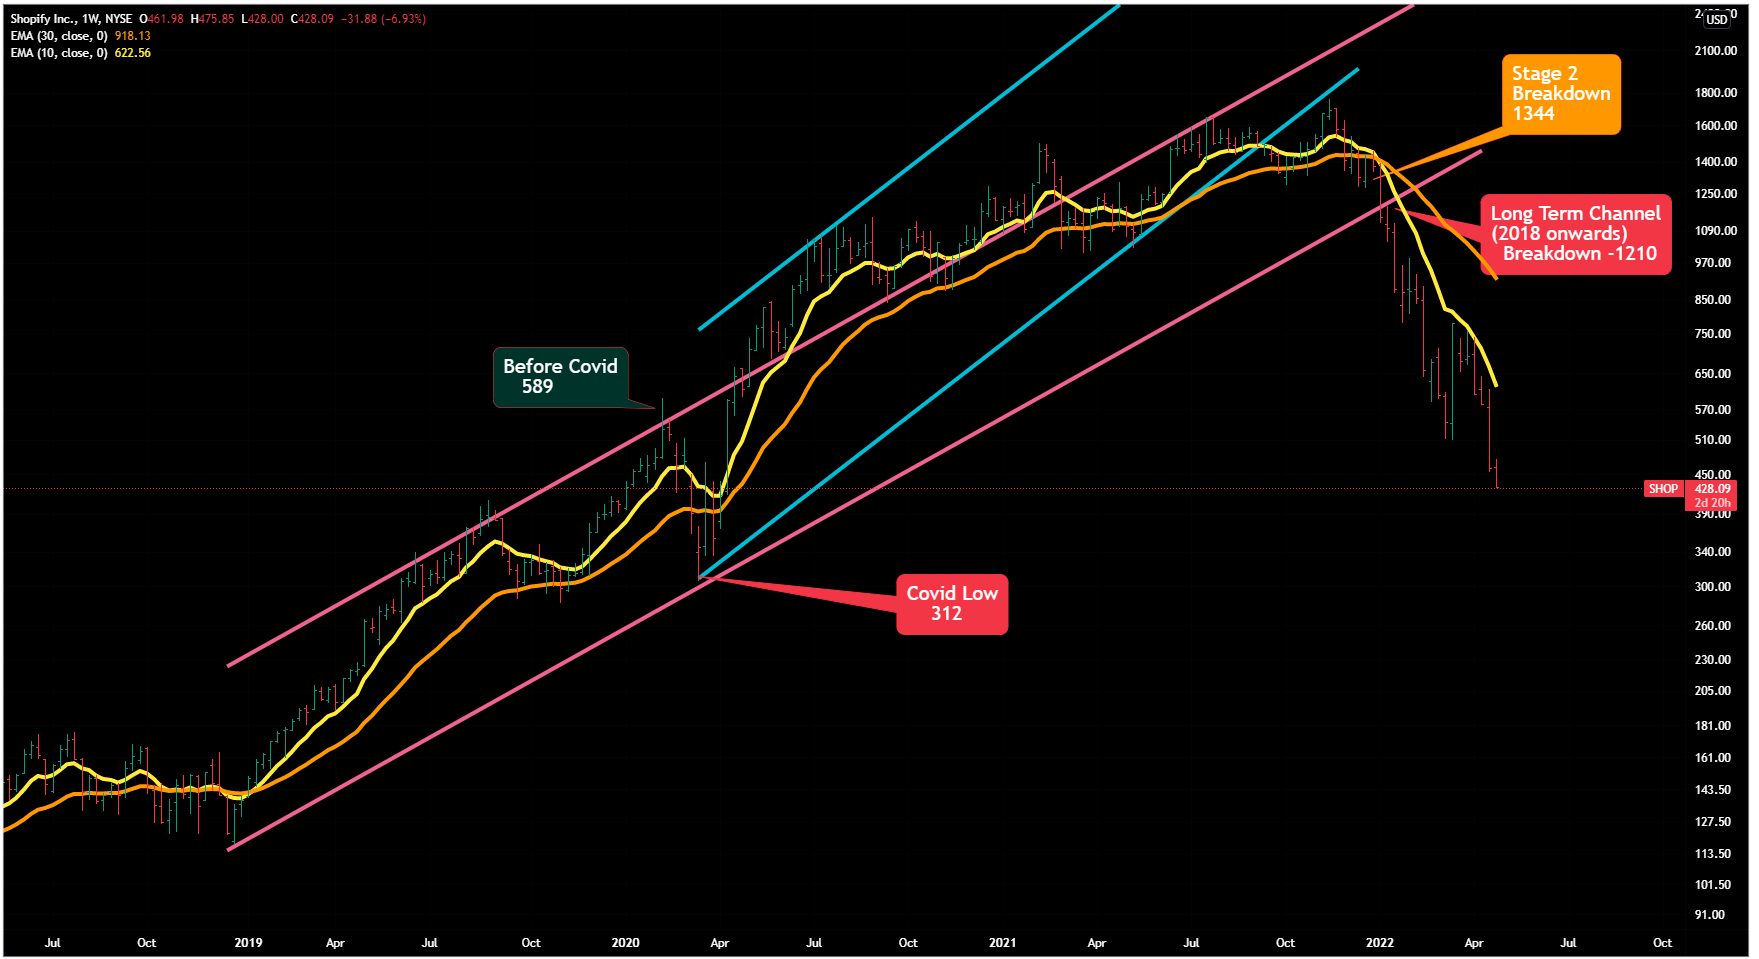
Look at the chart, there are lot of resistances on the left- if it was not a special situation, i try to avoid these kind of stocks ( more of the left -side- resistances, slower the upward movement )
So it has few resistances- I would add certain % position after it crosses each hurdle . As the arbirage -profit window is narrow, i would be aggressive when it crosses initial hurdles.
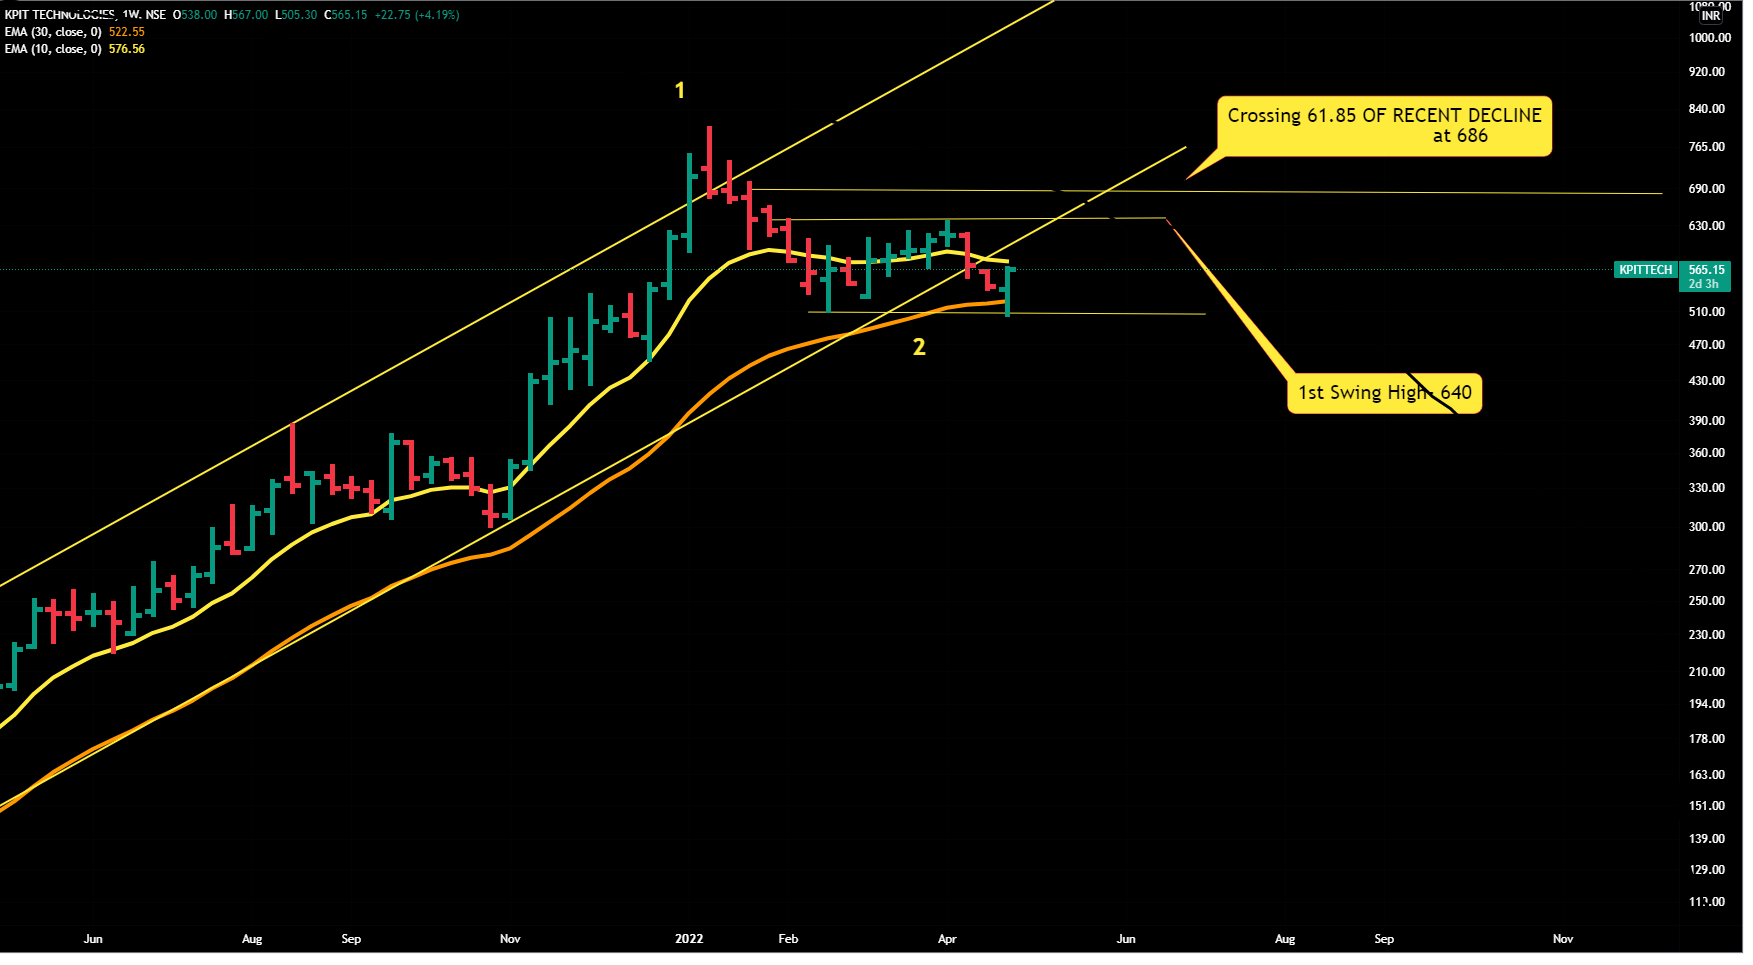
Another hurdle ( that is not shown in the chart) is this one crossing 61.8% of recent decline - but that is near 225 -so i wont worry about that as of now .
Route 2
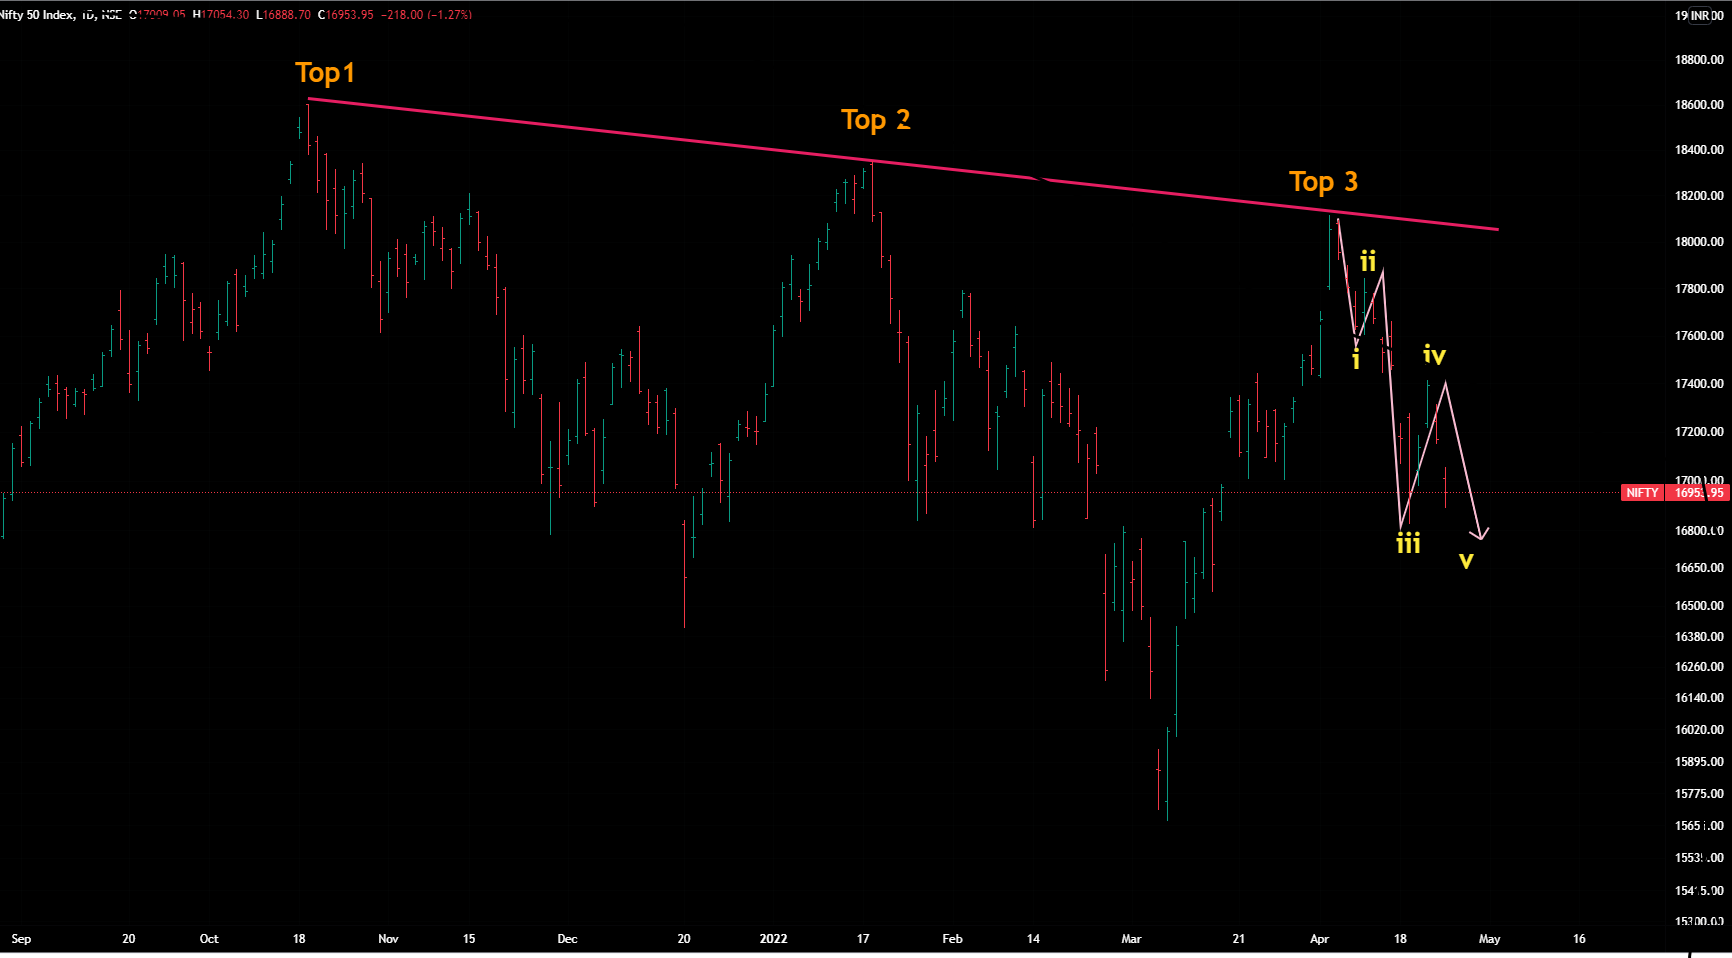
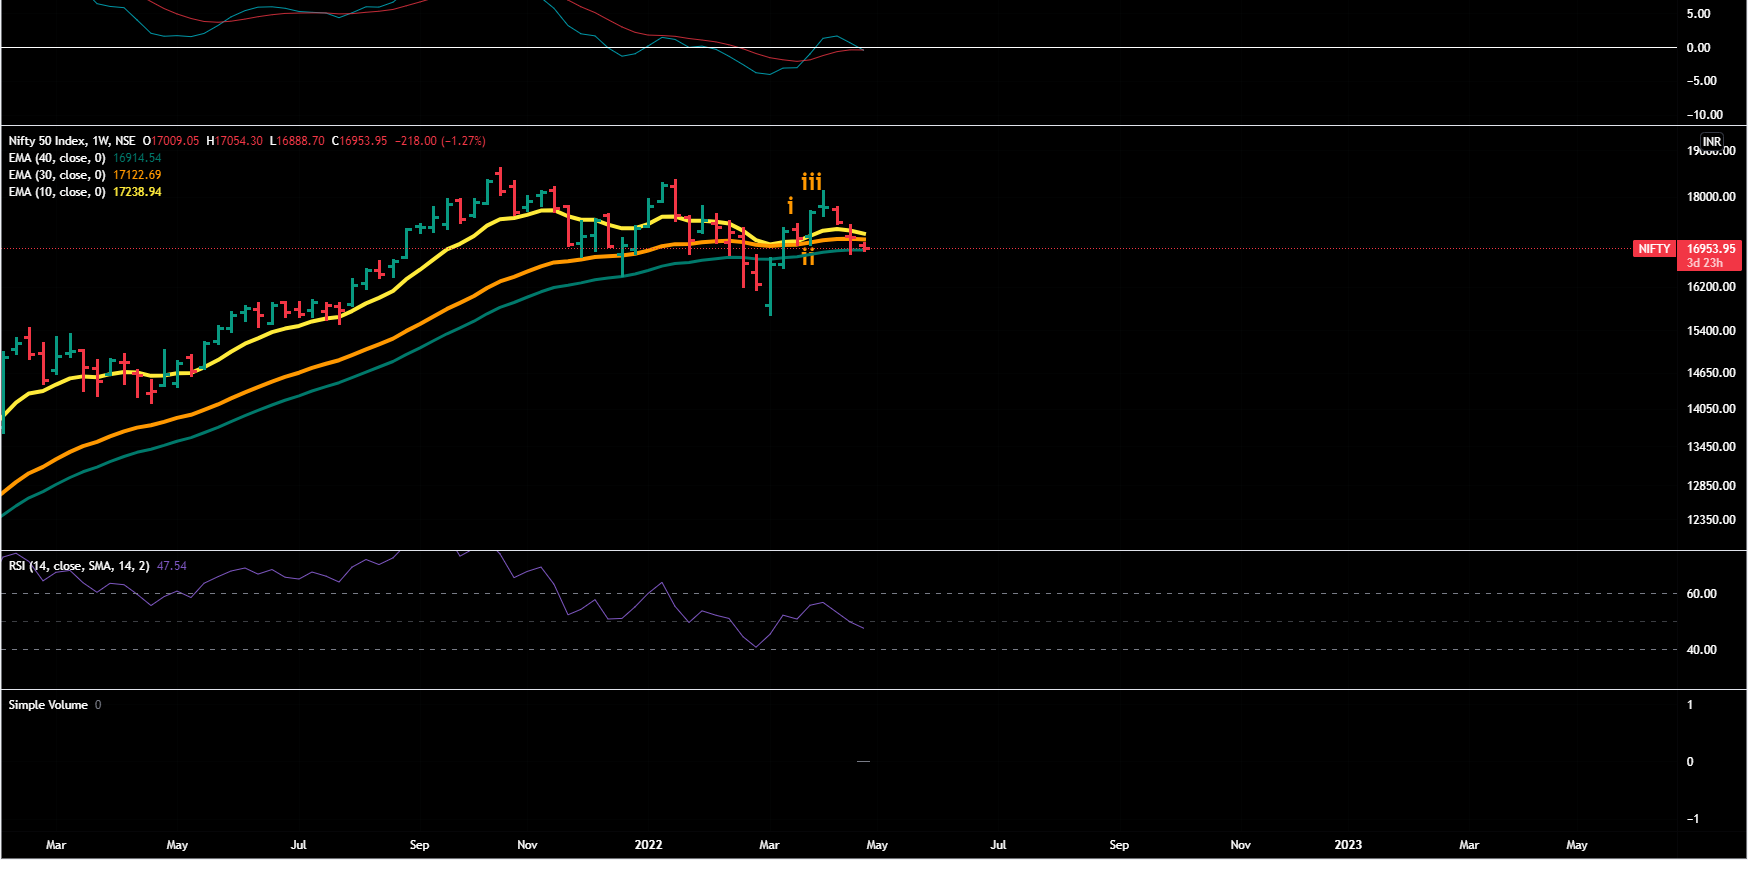
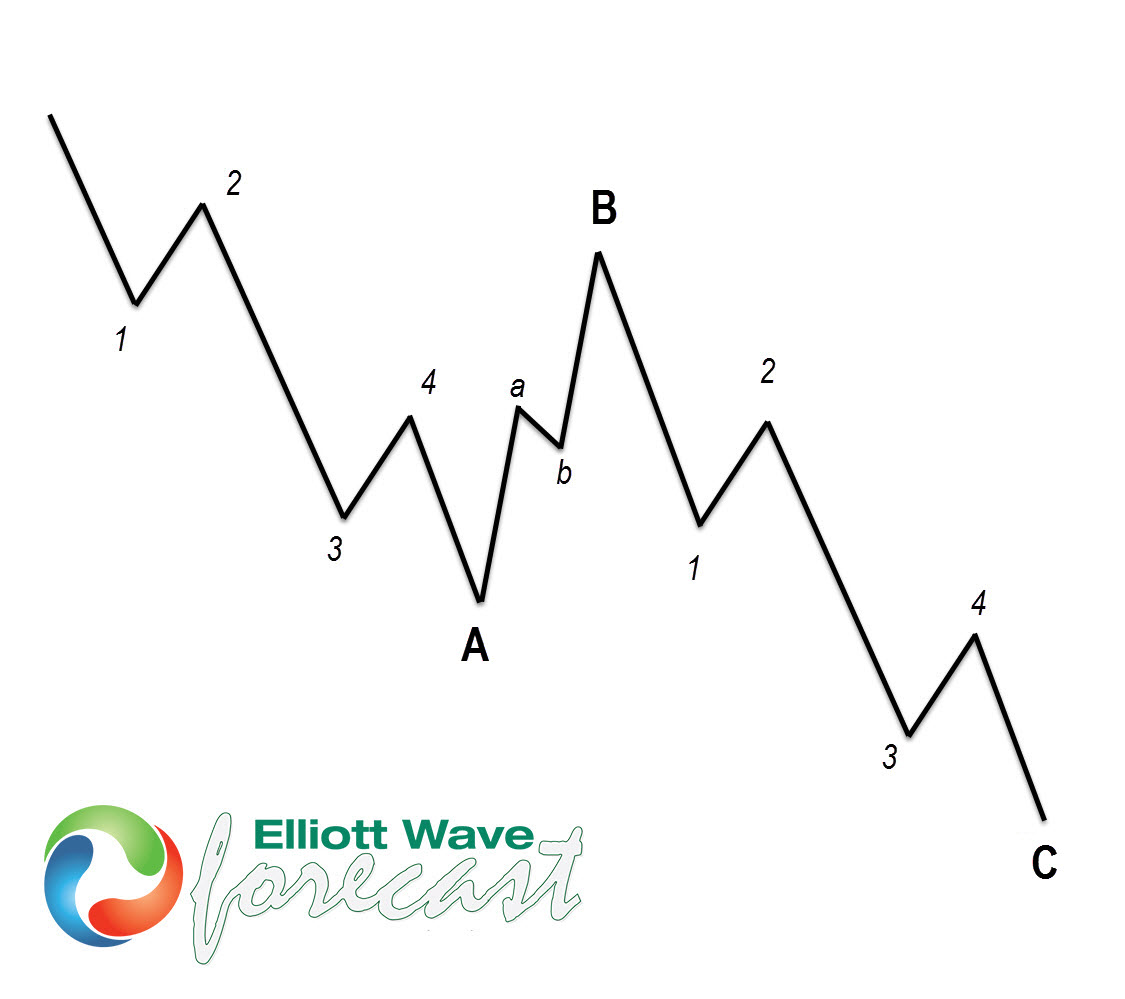
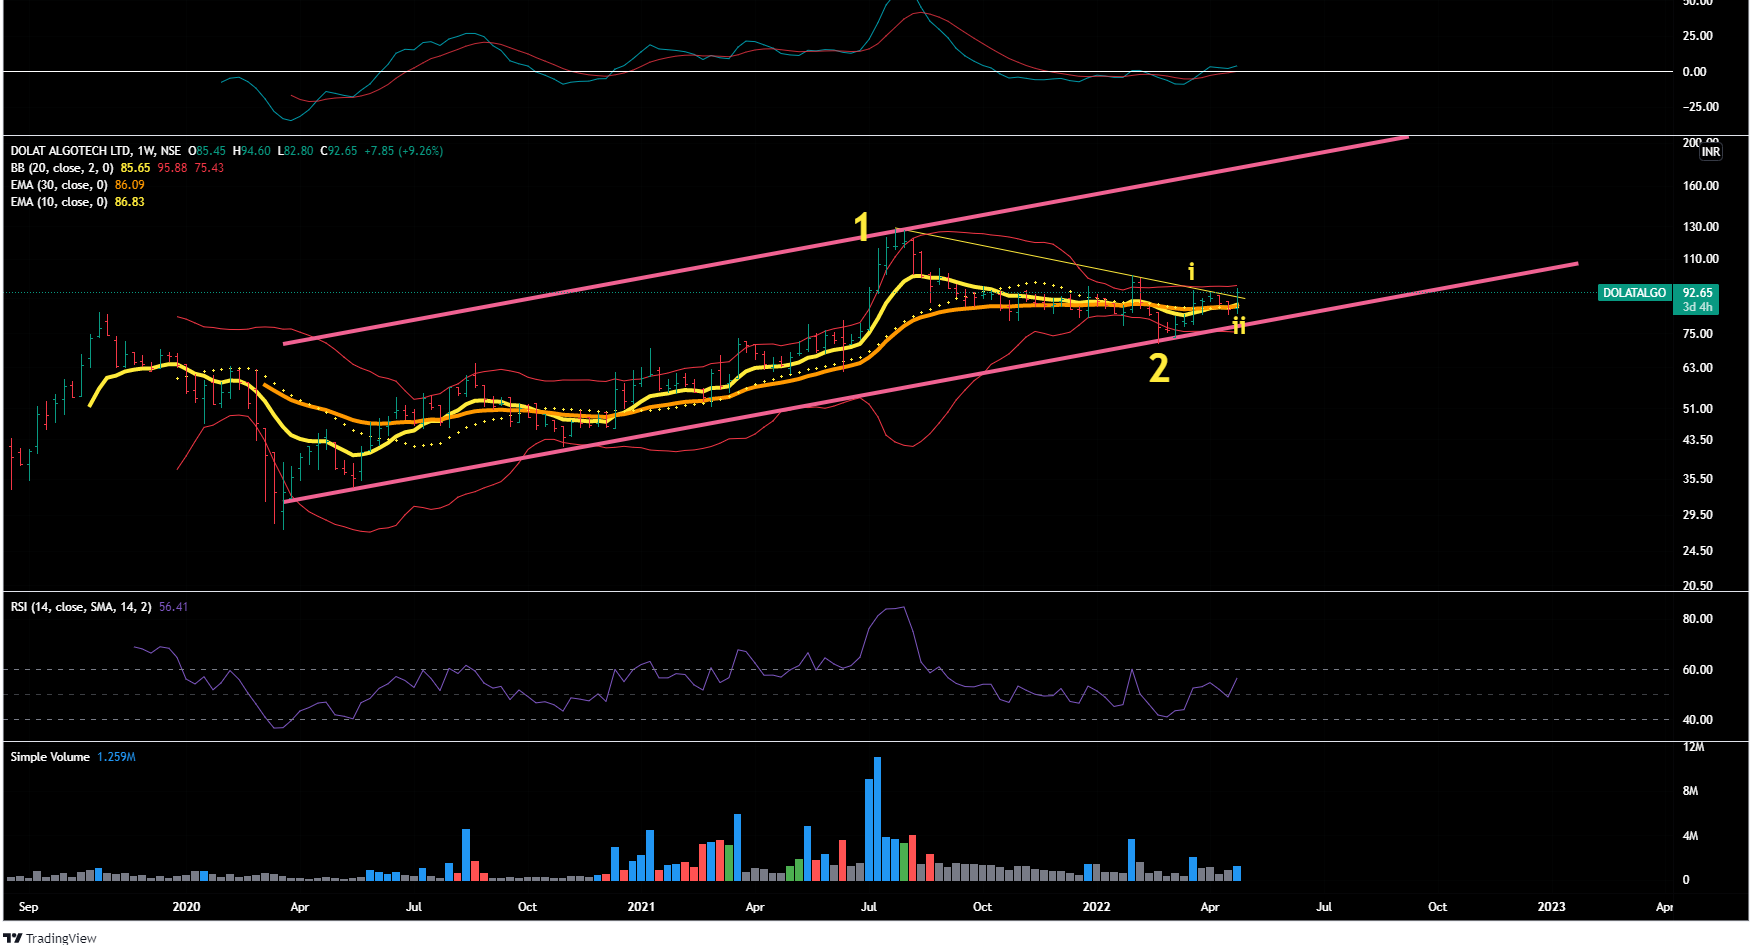
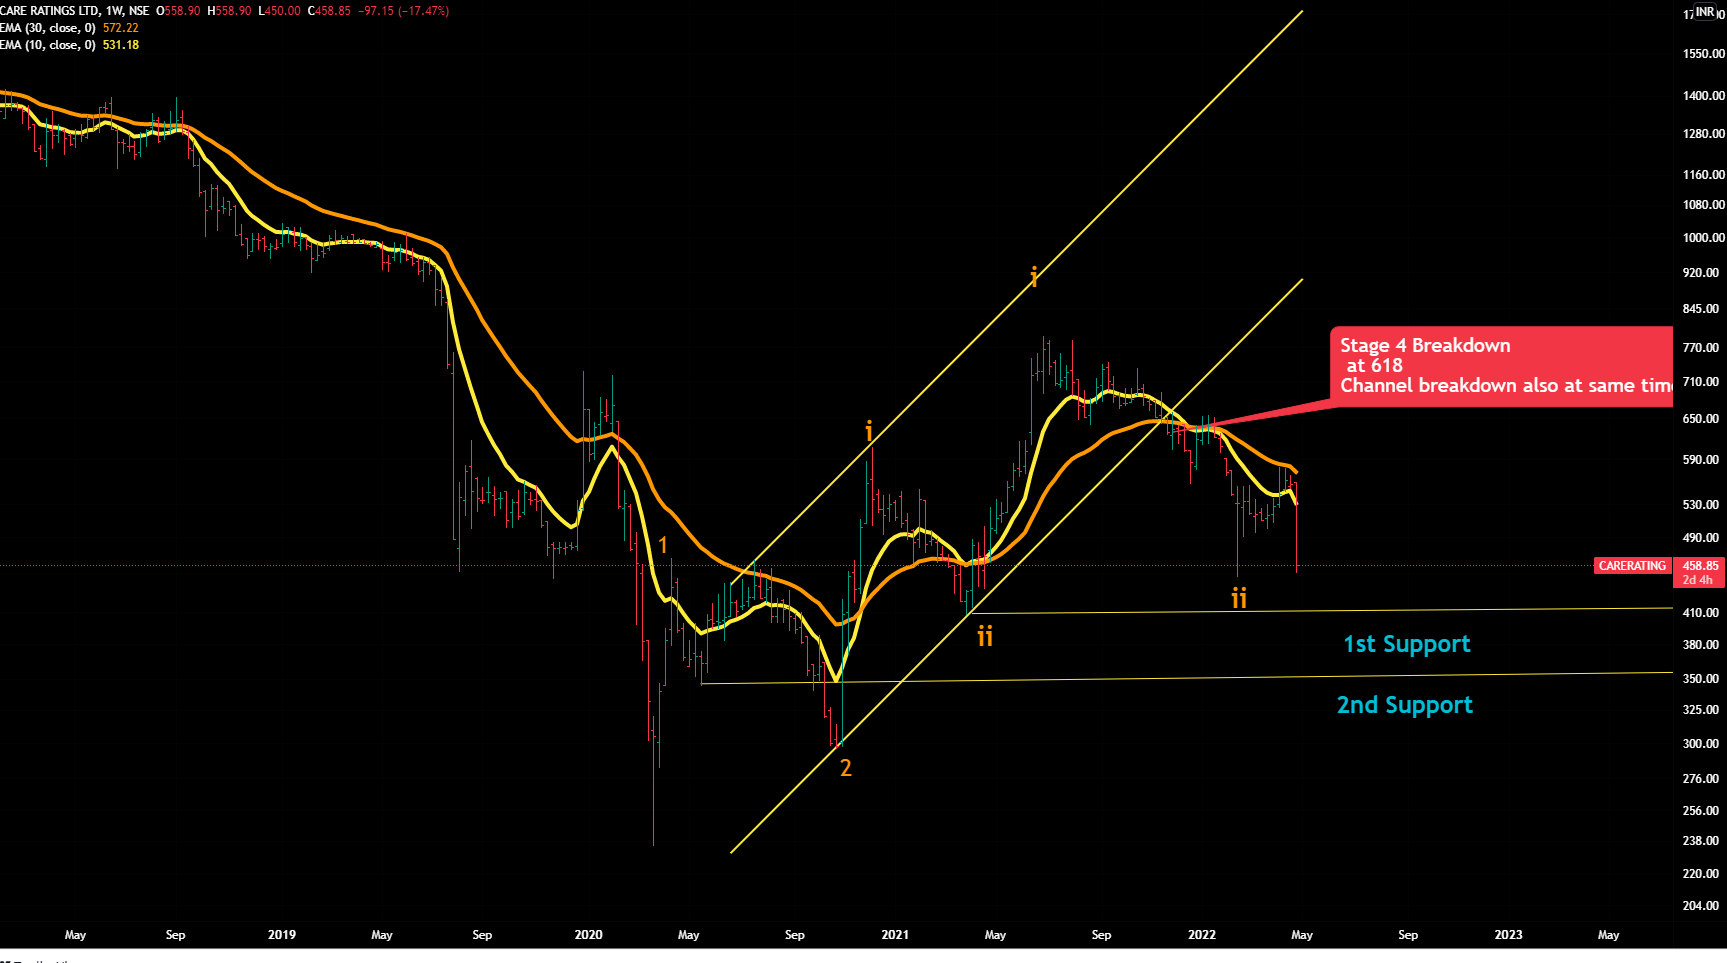
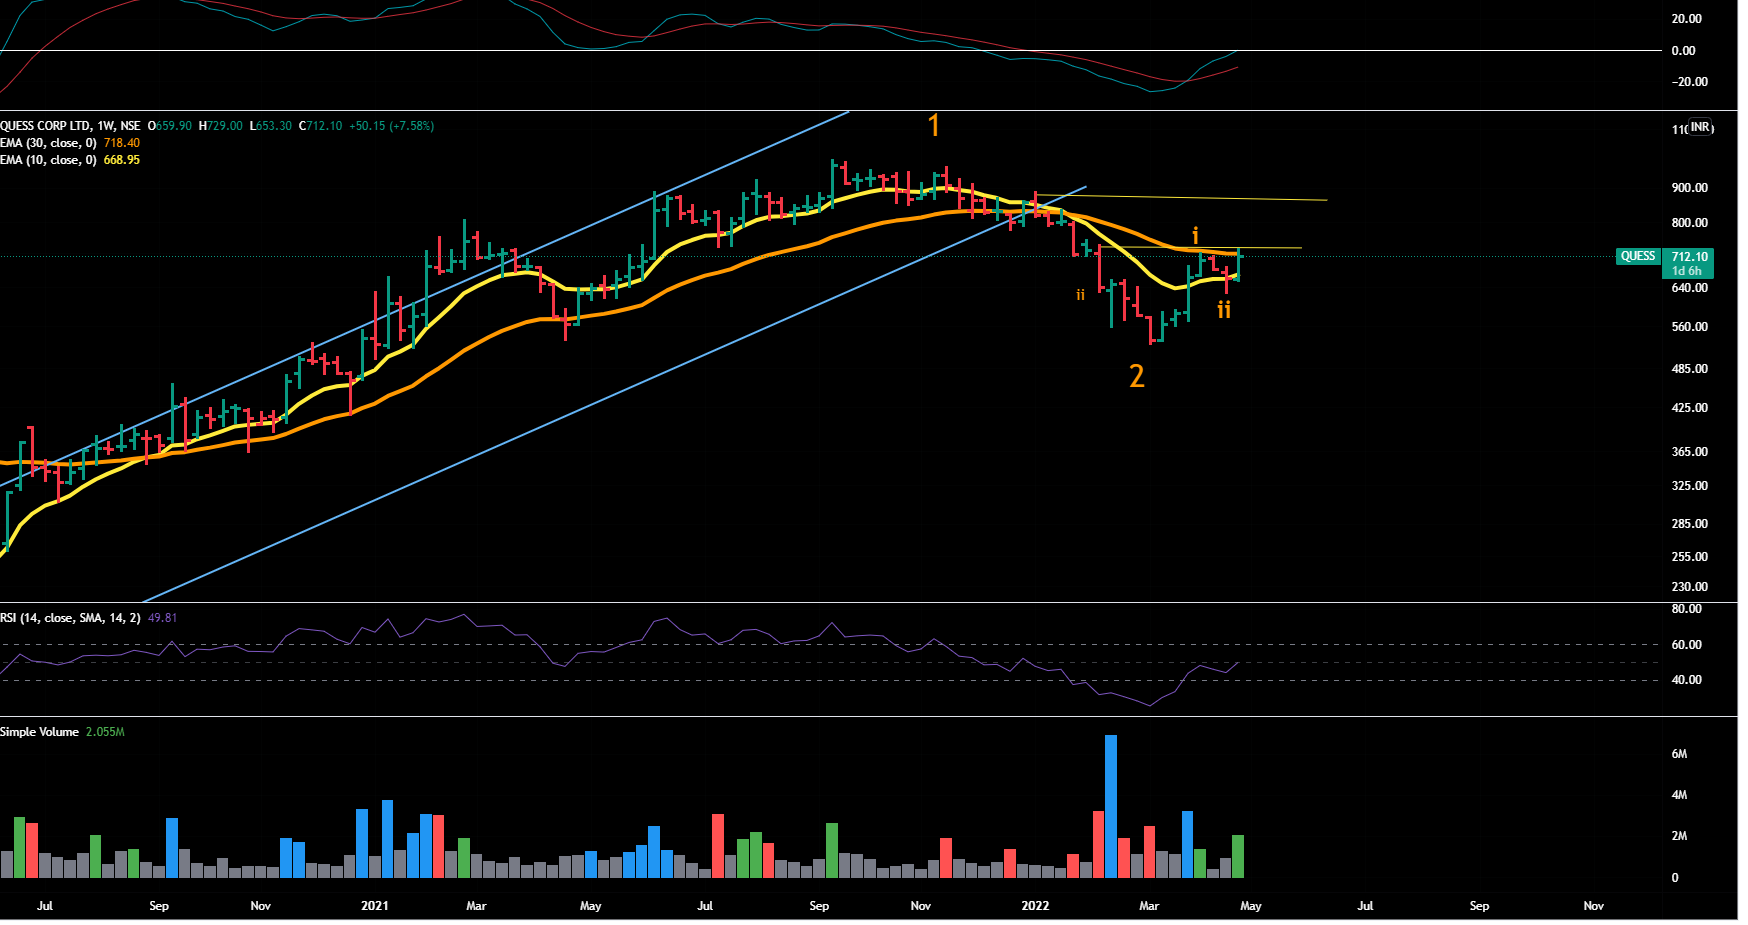
Via Elliot Waves
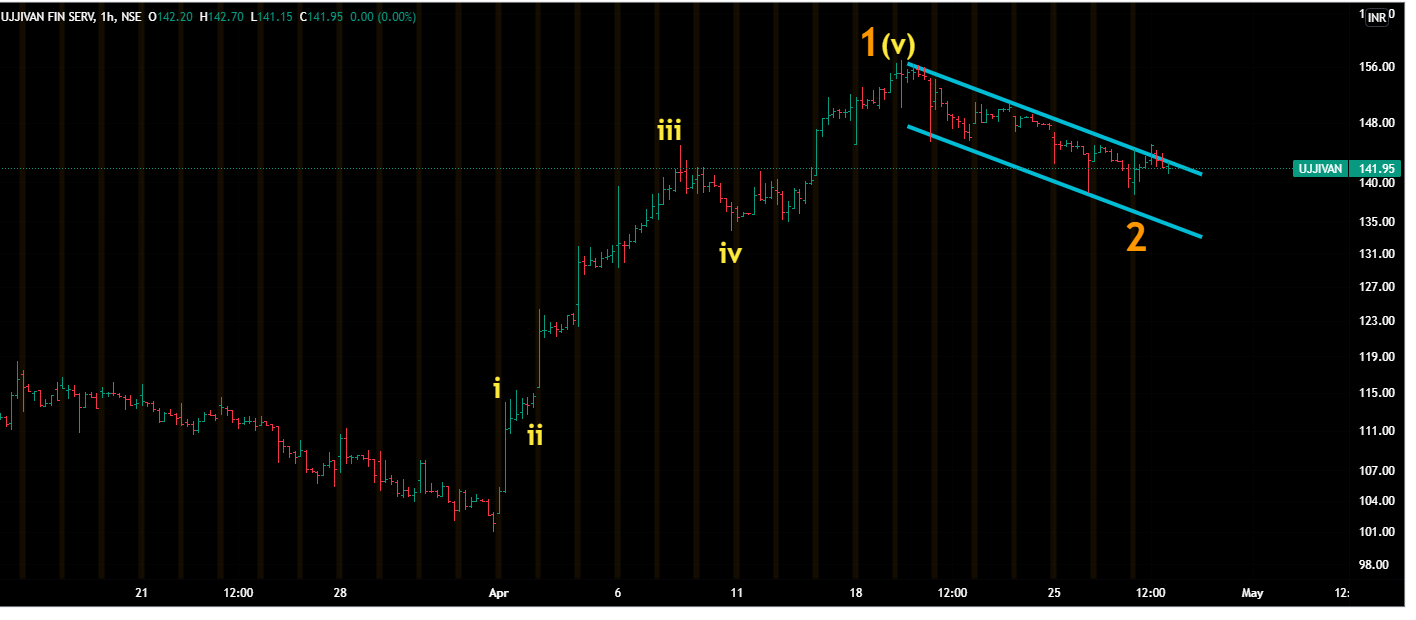
As per Ellliot Waves, on hourly chart we can see that it has made Wave 1 nad now it is correcting in Wave 2 – wave 2 correcrtion levels can be 138-128-122 depending upon different Fibo-levels(stop-loss 100)
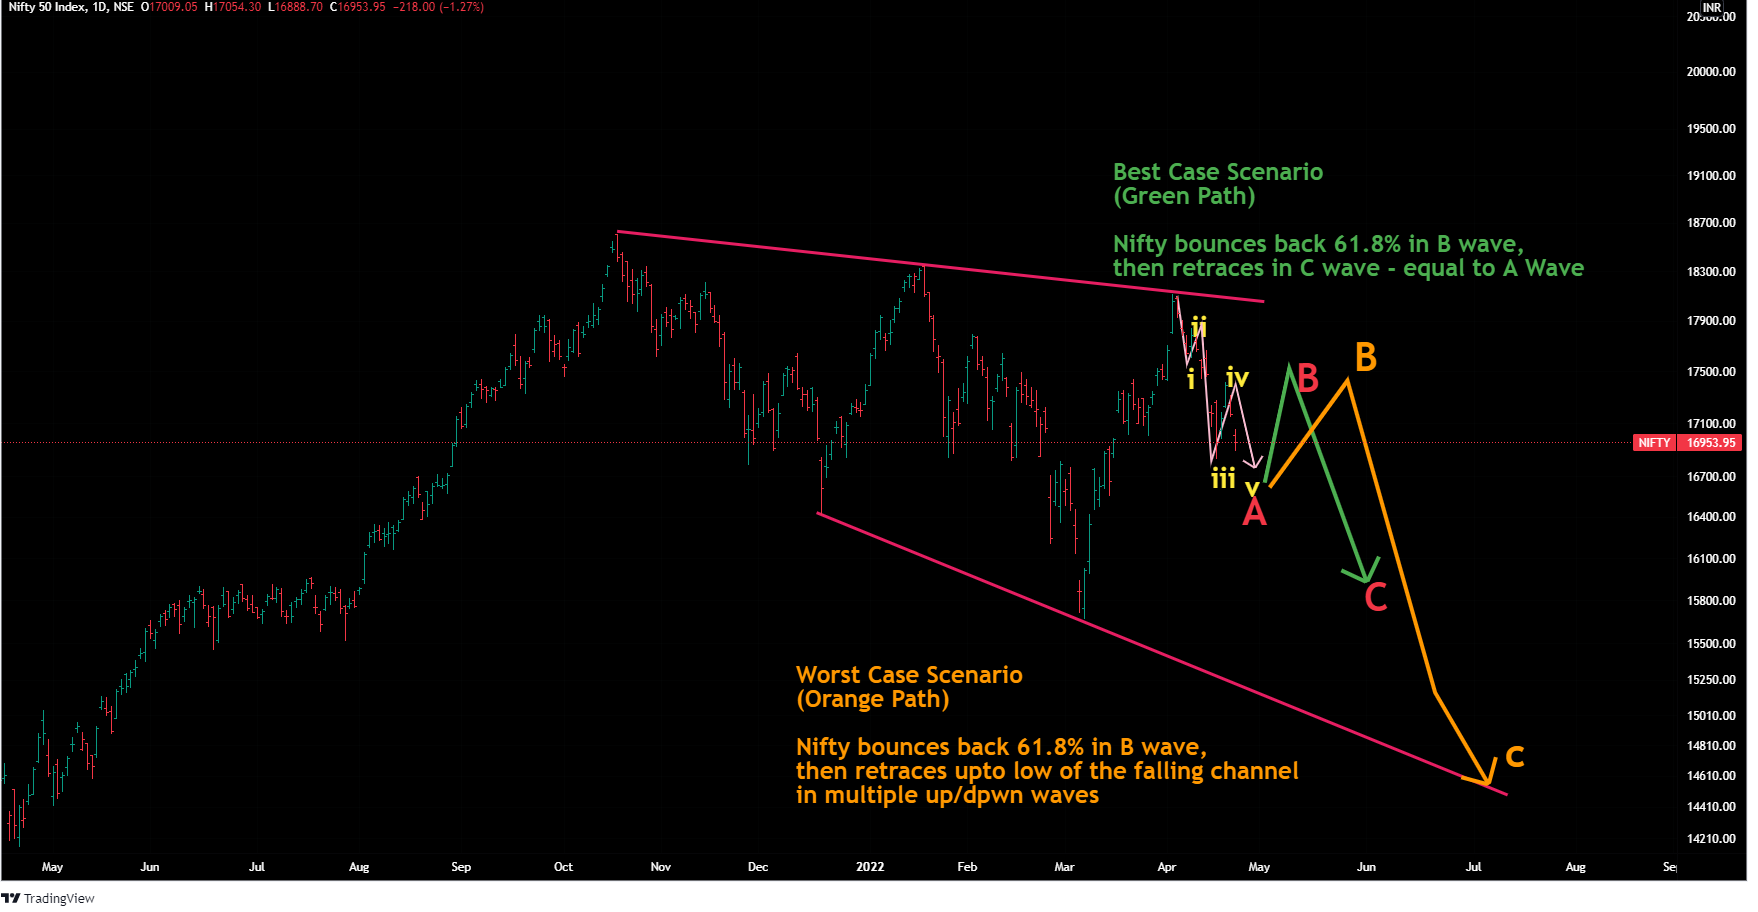
Recently it has made a double bottom at 138 and stock is trying to breakout of the falling channel, it tells that correction may be over.
Or may be not , if the market corrects further it can go to 128/122.
So initial postion can be made with a strict SL of 122.
A clear 5 waves impulse ( fractals of bigger Wave 1) towards upside somewhat assures that an upward -move is on the way .It is one of the many confirmations.
Later on one can keep adding as it crosses different hurdles.
Disclaimer -Keep in mind that this just a probabilty set-up - these charts are for learning purpose only- no recommendation.