
Yes. I have attached relevant one minute volume candles of 30.10.2023 & 31.10.2023 only
2 Likes
There has been another round of promoter selling. Promoter has sold around 2% in November 2023.
The previous promoter sale happened in 2017.
Disclosure: Invested and may be biased. Not a buy or sell recommendation.
2 Likes
Are the higher margins of Shilchar compared to TRIL because of the smaller products? Considering the hardware PLI and the growing electronic exports, these products would be commonly used. What is the competition face by the company? Very limited informatio available. If anyone has done scuttlebutt on this, please do share.
Telecom transformers range- https://shilchar.com/upload/entproductbrochure/telecom-transformers-1675707967.pdf
1 Like
Most important thing as listed on Shilchar website catalogue -
Any information on revenue split of various segments of Electronics and Power T&D transformers?
9 Likes
Details Ferrite core transformers
Non conductive - This allows them to be used without the protective coating & keep the size small.
Made of manganese and Zinc or Nickel and Zinc
Major applications of Ferrite Core transformers
- Power Electronic circuit
- DC to DC Converters
- Soler panels
- Electrical vehicles
- Mobile chargers
- Home appliances
More details - Ferrite Core Transformer | Why they are in Demand?
Demand drivers
- Aging power grids
- New energy standards set by US by 2027 forcing change in transformers
- Damage to grids due to naturals calamities
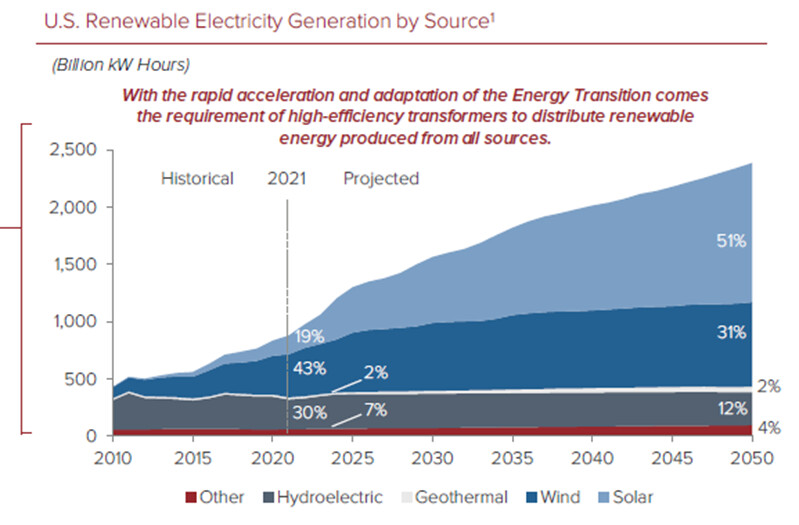
- E mobility & switch to renewable energy will require new transformers.
- Use of renewable energy will increase multifold due to paris agreement.
Queries
Spilt of business between Power and distribution transformers
Margin sustainability will be challenge , as global RM are on lower trend and in coming quarters or next FY uptrend might come.
Manufacturing capacity of shilchar is 50MVA as per the website. will this be sufficient for capacity for Grid upgradation from old grids to renewable energy grids. also renewable energy grids require smart transformers as per the below document. but shilchar is not manufacturing it.
2 Likes
3 Likes
Some interesting observations on Shilchar Technologies observed:-
- Life time high P/B of 12.2
- Life time high EV/EBIDTA of ~20
- Life time high MarketCap/Sales ~5.73(TTM Sales value)
- Sudden expansion of margins to 25%(TTM)
- Promoter selling out some stake in Q4’CY2023
- FII reducing stake by ~1% over CY2023
- DII completely exiting the positions
Question to be asked is are we reaching a stage of Peak Sales and Peak margins for Shilchar Technologies ?
Disc: Not invested.
3 Likes
Very insightful discussion on indian transformers industry.
From 4:38:00 the industry veterans discuss as to how difficult it is to penetrate into exports market and the reasons of high realisation in exports market and lower margins in supplies to govt utilities companies.
Shilchar has half of its revenue coming from exports, says a lot about quality of their products and industry leading margins.
16 Likes
Very interesting development that Shilchar starting with concalls, it will give lot of information of company plans, market opportunity (domestic and export), an idea of for how is the runway from hereon. Looking forward
5 Likes
As per December filing, FIIs have increased stake. Disc: not invested
Placeholder for some of the notes that I had put together while looking at different players…
Domestic Demand Drivers:
-
India’s power generation capacity is likely to be 623 GW in FY27 from 382GW end of FY22 (further to 865 GW in FY32). A significant increase is likely in renewable energy generation as the percentage of renewables in the generation capacity mix is expected to grow from 25% in FY22 to 57% in FY27 and 68% in FY32 while the overall pie itself is growing.
-
Policy support: Launch of $41bn power reforms funding in the budget should help kickstart power capex from FY23 after cleaning up discom balance sheets in FY22. The national infrastructure pipeline has outlay a capex of Rs 11,760 bn over FY20-25 towards the power sector.
Global Demand Drivers:
- Supply crunch in Key Markets. Wait times for some transformers have gone from weeks to over a year,1 and costs for finished transformers have soared in some cases by more than 400 percent since 2020. Predominantly due to CORG supply limitations.
- To combat the climate crisis and avoid the most severe impacts of climate change, the U.S. is committed to achieving a 50 to 52 percent reduction from 2005 levels in economy-wide net greenhouse gas pollution by 2030, creating a carbon pollution-free power sector by 2035, and achieving net zero emissions economy-wide by no later than 2050. Renewable energy is one of the focus areas.
Some Key Stats to understand the industry:
- Domestic market size in value terms: 13,000 Crs. (Power Transformer 6,500 Crs., Distribution Transformer ~6,800 Crs.)
- Dometic market size in value terms: 400,000 MVA
(based on a little dated report however not much capacity addition in the industry in last few years, rather capacity shrinkage due to implementation of stringent certification norms and few players going bust) - Realization: In the range of 7 Lac - 12 Lac/MVA depending on size, class and specs.
- Cost drivers:
- CRGO Lamination (H.S CODE:85049010, ) - ~23% of the cost; Price/MT – 3.50 lac/MT as on Q4’21;
- Copper - ~30% of cost
- Recent capex cost trend : Largely in the range of 70 lac- 1.25 Cr per 100 MVA for brownfield
Transformer and Rectifiers:
Manufacturing High Voltage Transformers viz. 220 kV - 1200 kV indigenously. Only Indian transformer company having NABL accredited lab for electricals steel testing. 80% Revenue from Power transformer
- Revenue by segment: Utilities - 51%, Industries - 43%, Export- 5%
- Capacity: 37,200 MVA
- Capex: As per Nov’23 concall, without any CAPEX, we can reach up to Rs.2,500 crores top line. Has planned Capex to the tune of 70 Cr. for enhancing the production capacity in the Changodar Plant in FY 2023-24
- Order Book: 2145 Crs (as on Sep’23), Book to bill - ~1.5x
- Revenue (FY23): 1360 Crs. (Growth 21%), Had seen significant 34% de-growth in H1FY24 (Y-o-Y). Still management has guided for full year similar revenue for FY’24 as it was last year.
- Margins: EBIDTA 9%, PAT 3%. Management guidance of EBIDTA moving to 15%+ here onwards.
- ROCE: 15%
- Working capital to sales: 51%,
- Cash conversion cycle: 143 Days,
- Equity dilution: QIP of 120 Crs in Oct’23.
In summary, working capital management had been one of the key challenges for the company. Debtor days has always been stretched (180 – 200 Days) due to customer profile (Utilities)/segment (power transformer). Situation was further aggravated due to wafer thin net margins of 1%- 3%. With the tailwind underway, TRIL may see meaningful swing in key ratios (ROE, ROCE) considering where they are today.
CG Power and Industrial Solutions:
6.4% market share in Power transformer and 5.4% market share in distribution transformer
- Capacity: Totally from 17,000 MVA now moving to 25,000 MVA. Operating at 100% CU
- Capex: Brownfield 11,000MVA capacity expansion plan at a capex of Rs1.26 bn. Incremental revenue potential of 850 Crs/year from capex. (nice 7x asset turn)
- Export 5% at enterprise level (Power segment is ~30% of FY’23 revenue)
- Order Book: 3363 Crs (as on Sep’23) specifically for Power segment, Book to bill – 1.66x
- Revenue (FY23) for power segment: 2023 Crs. (up 33%), H1FY24 revenue at 1131 crs. (19% Y-o-Y growth)
- Margin (FY23) for power segment: EBIDTA 12.9%, PBIT 11.2%. Significant margin improvement for H1FY24.
- ROCE (Power segment) – 61%
- Power segment EBIDTA is 13% now. ROCE 61%
- Debt Free, 662 Crs of cash+Equv.
- Working capital to sales: 23%,
- Cash conversion cycle: 13 Days
Text book example of what wonders good+capable management can do to a business and market position/valuations in turn. Murugappa group took over a 5% ROCE, ~1000 Crs LT debt business in late 2020. Turned it around into 45% RoCE, zero debt, 711 Crs cash, negative working capital, Dividend paying business – all in 3 years. Even, here onwards business direction and commentary looks strong (valuation stretched though).
Voltamp:
Voltamp operates in three different segments: power transformers (35% of sales), distribution transformers (45%) and dry transformers (13%). Oil-filled transformers constitute 81% of sales and dry transformers ~19%. Very wide end user industry sector thereby mitigating sectoral uncertainty. Max Sectoral exposure 16% is for steel/metal, no other
- Revenue by segment: 85% of revenue comes from private customers
- Client concentration: Top 10 customers 26% revenue
- Export: 2.36%
- Capacity: 14000 MVA, 84% Capacity Utilization
- Capex: Recently did capex to increase capacity by 1,000 MVA (de-bottlenecking). Management indication of further increase capacity by 2,000-2,500MVA depending on demand
- Order Book: ~1400 Crs orderbook as on Sep’23 (improved from 900 Crs as on March’23)
- Revenue (FY23): 1385 Crs. (growth 22%)
- Margins: EBIDTA 16.70%, PAT %14%
- ROCE: %19.60
- Debt Free balance sheet
- Working capital to sales: 23%,
- Cash conversion cycle: 142 Days
- Equity dilution: In Sep’23 promoters has sold 12% of holding (560 Crs.). Contrary to what rest players are doing (QIP/debt/preferential allotment) at this juncture of good times.
Positive CFO for past many years is remarkable. Significant improvement in realization from ~ 7lac/MVA as on Q1’22 to 12lac/MVA+. Very tight working capital management. Cash reserves of ~600 Crs helps to have creditor days in control thereby extracting better margins.
Just two data points should summarize the management philosophy and pedigree:
- No LT debt in last 10 years in such cyclical and working capital extensive industry.
- In last 10 years, creditor days has been below 3 days ALWAYS.
Bharat Bijlee:
Bharat Bijlee has a state-of-the-art plant with a production capacity of 15,000 MVA and a full-fledged testing laboratory which is NABL accredited. It offers up to 200MVA, 200kV, 3 phase transformers and caters to State Electricity Boards, Utilities, PSUs, Industries and overseas customers.
- Export: 1.70%
- Capacity: 15,000 MVA
- Capex: No info in public domain
- Order Book: 1076 Crs.
- Revenue (FY23): 646 Crs for transformer segment, growth 4% Y-o-Y, H1FY24 has significant 112% growth
- Margins: PAT 5.87%
- ROCE: 15%
- Debt/Equity - 0.5
- Cash + Equivalent – 324 Crs.
- Working capital to sales: 39%,
- Cash conversion cycle: 145 Days
- Investment of 860 Crs in equities as on March 31st 2023.
Meaningful land bank at current Aeroli plant. The company’s manufacturing facilities are located in Airoli, Navi Mumbai on a 193,000 square meters campus, with a working area of approximately 50,000 square meters. Possibility of monetization or brown field expansion.
Shilchar Tech:
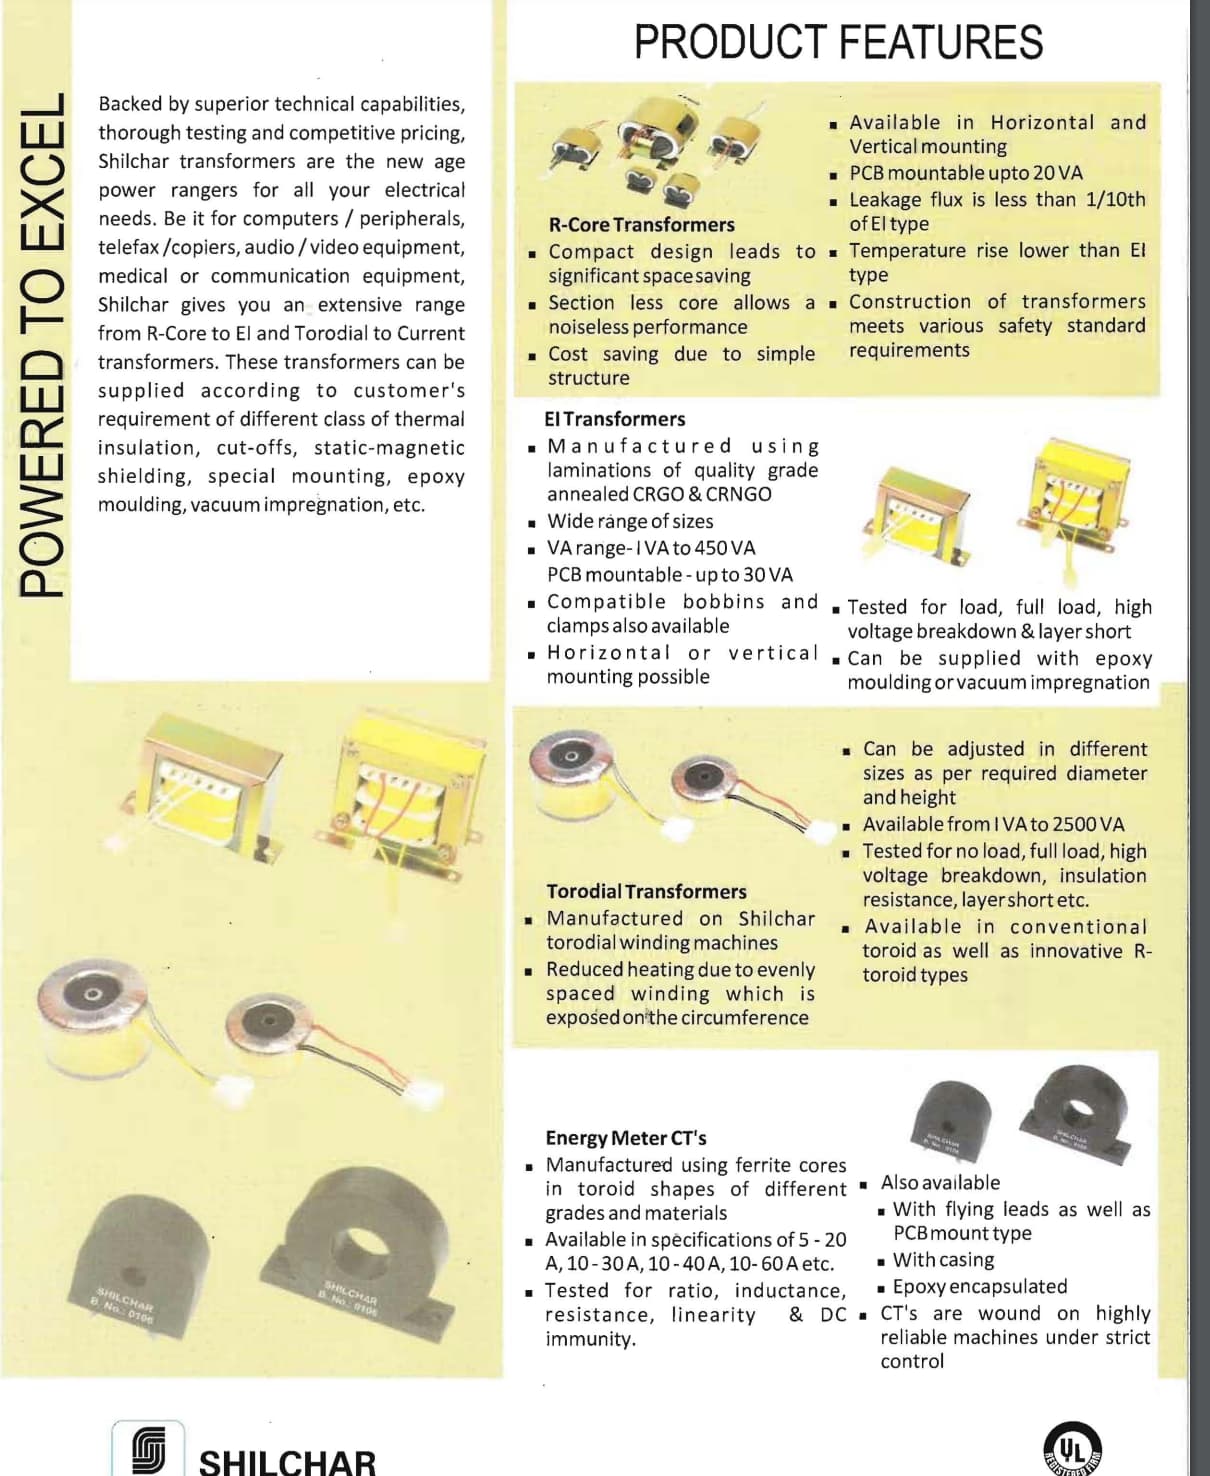
Manufacture distribution transformers ranging from 5 KVA to 3,000 KVA and power transformers ranging from 3 MVA to 15 MVA. Domestically, Shilchar generates a major portion of its revenue by manufacturing transformers mainly for power and energy sector (with major portion from domestic renewable sector i.e. solar and wind forming around 50%-60% of net sales).
- Revenue by segment: Export 52%, domestic 48%
- Customer concentration: top five domestic customers forms ~54% of its domestic sales in FY23 [FY22: ~44%; FY21: ~72%].
- Export: 52% of revenue FY23, 25% of revenue in FY22. Exports grew from Rs.45.70 crore during FY22 to Rs.144.83 crore during FY23
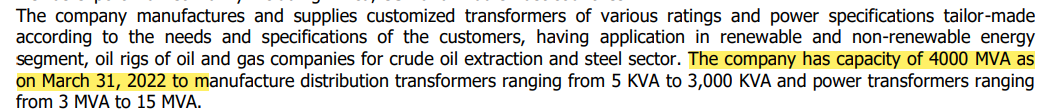
- Capacity: 4000 MVA
- Capex: 1000 MVA (as per AGM comments, this may be phase 1 of capex and may look at increasing capacity further)
- Revenue (FY23): 280 Crs. (56% growth), H1FY24 revenue 173 Crs. (47% growth)
- Margins: EBIDTA 25%, PAT 15% | PAT improved significantly to 23% in H1FY24
- ROCE: 54%
- Debt Free, 28 Crs of cash
- Working capital to sales: 37%, Cash conversion cycle: 86 Days
Overall, Transformer industry had significant capex between 2007 - 2012 (2.5x capacity addition). However, went into an overcapacity and demand slump situation thereafter. Total manufacturing capacity has remained stagnant (rather has declined) for a decade.
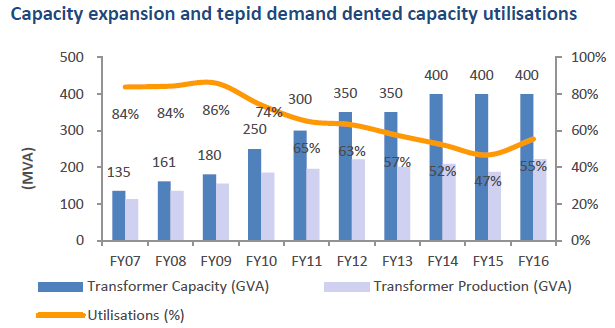
This decade long demand slow down situation has resulted into under investment into manufacturing capacity. With multiple growth drivers ahead - both domestic and gloabal, industry is finding itself in a sweat spot.
Regards,
Tarun
Disclosure: Invested in Shilchar, transactions (average-up) in last 30 days
77 Likes
That was very informative. Thank you
1 Like
Another strong quarter. Revenue up 73% yoy,EBITDA up 113% & PAT up 116%. Margins continue to be steady around 27%.
Quarterly run rate is close to 470 cr annual revs & now this is before the 25% capacity addition comes on line. Just like last quarter,it’s interesting to compare management’s guidance vs. their delivery:
guidance of 22% EBITDA and delivery in the 25-30% range
Revenue guidance of 350 cr while 9m revs are already at 290 cr. Q4 being the strongest quarter even taking Q3 run rate one gets 400 cr kinda revs for FY24. So 40% growth vs. 25% that management guided.
Macro continues to be very strong for the sector with much of the electrical infra in developed countries nearing replacement(as referenced by Apar) while new demand is being driven by renewable sector. Even domestically,things are looking very good. Companies that supply to utilities have mentioned how new tenders are at much higher GMs(6-700 bps) While Shilchar has no exposure to government supplies it stands to reason that pricing environment for other sub segments should also be benign. @T11 has shared good data points. Now onto the concall tomorrow.
Disc.: Invested. Views are biased.
17 Likes
Here comes the big news on expected lines. Each of highlighted lines are important.
(link)
Edited to add this:
Investor presentation. (link). Height of brevity ![]()
They definitely need to add an external investor relation agency at this stage.
Disc:
Invested
19 Likes
Based on the info, seems like Q4 and next Q1 should be similar to Q3. At Max currency and profit numbers might vary a bit bit as they are at Max utilisation, production should be similar. Would be interesting to see next Q2 numbers.
2 Likes
Shilchar call was superb. Management re-iterated this in the call. Company expects to do 8-900 cr in 2 years thus we are looking at utilization of new capacity by FY26 itself. New plant that came up 5 years ago is highly efficient. Thus,the surge in GMs and EBITDA margins. Demand is extremely strong across the board…both in India & in export markets.
Domestic EBITDA margins: 15-20%
exports: 30-50%,varies from order to order. Very limited competition in export markets for organized players. Rakem Danish are some but quiet small in size upto 100 cr kind of annual sales.
Company is catering mainly to US & Middle east markets in exports. They have started to expand presence in European markets too and expect results in few years
Overall margins should stay in the current vicinity for atleast 1 more year. Company has a great design team & considers itself a technology/technical company rather than manufacturing.
Current cycle similar to 2004-08 except that exports weren’t such a big part of revenues & there was no share of biz from renewable segment. New competition could come up in India markets over next 1 year given huge demand but it seems Shilchar should be more insulated given niche in renewables & especially exports.
Have a lot of excess land. Can go to 30,000 MVA if required.
Overall it was a crisp call. Management seems to be efficient user of capital AND time…they decided to finish the call just as questions started repeating.
Disc.: Invested. Views are biased
30 Likes
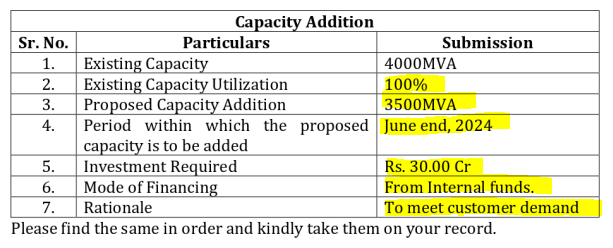
Thank you Sagar for the detailed write up of the concall. Just to add to your notes:
The capacity expansion of 3500 MVA is expected to cost 30cr and will be covered by internal accruals. No debt will be taken on. The management also confirmed that they like to go step by step and be prudent instead of a more aggressive expansion even though the land exists.
Now coming to their moat. It seems that their quality and technical know how plays a huge part as these renewable energy transformers are difficult to manufacture. It is a market that is difficult to penetrate. This along will approvals from foreign customers are not easy to obtain. Their land bank could be a moat as well as they can continue to do brownfield expansions.
Q3 sales had 45% export of which the break up was roughly 30% North America and 70% MIddle East. The North American transformers built in the 50s and 60s are being replaced.
Shilchar has the know how to manufacture upto 132 KV transformers but the majority of transformers they sell are of 66KV and lower. Renewable energy transformers constituted about 60% of sales.
Right now they receive no govt subsidy.
One interesting nugget that management shared was that the increased focus in the renewable energy segment could be beneficial for industrial players like Voltamp to solidify their position in that segment.
Disc:Invested and Biased.
6 Likes
Where can we get the link for the concall - Audio,video or transcript - Checked screener as well as Shilchar website, unable to find.
Thanks in advance.
Announcement under Regulation 30 (LODR)-Earnings Call Transcript
9 Feb - Transcripts of the conference call with investor / Analysts held on February 6, 2024 on the Q3FY24 performance of the company.
Disc: invested
5 Likes