What I have oberserved from the result was the stark increase in cost of raw material to proportion to sales, It was around 66% in q3 ,compared to 59% in q2 and 62% in 9M FY2025,This might have been the key reason for fall in margins will need clearity from the management on where they see these costs heading.
Shilchar Technolies Q3 FY25 - Investor Presentation
- CRGO Steel cost to moderate as BIS has renewed licenses for several CRGO suppliers and no challenges in CRGO procurement in the foreseeable future. This should allay the concern of spiralling RM cost denting the margin.
- New capacity to fully reflect in FY 26 results as the new capacity from 4K to 7.5K is getting ramped up.
- Sufficient land parcel available to build capacity to 30K MVA.
- Suppliers of Power and Distribution Transformers upto 66 KV class.
992bb31d-8c2e-4d5d-af38-2603e333f50e.pdf
Discl: Invested
Below is from the investor presentation:
As per the same, the new capacity is fully utilised in Q3 which gives revenue of ~155CR with PAT margin of 22%.
If we extrapolate it to full year, it would be ~620CR (which management guides to 750-800 and i assume they would be right but it cannot be more than this) and considering 800Cr rev, the PAT to be ~180Cr.
With this, the stock runs at the 25-30 forward PE, which is quite expensive given no further growth visibility, until management announces further expansion plan.
Disc: Not invested but got interested in overall sector story and recent corrections in all these stocks. Tracking others too, but still feel these like SHilchar, Indo Tech, Danish are quite expensive at these levels.
The 155 Cr revenue isnât with full utilisation of the capacity. Theyâve stated in their ppt as well as in their response through IR team that I had asked for, that the capacity will be fully utilised in FY26 which gives a ball park no of 750 crores revenue that the management is also in sync with.
Regarding expansion any expansion will be a brownfield expansion & going by last expansion it was announced in Feb & itâs utilisation started in September.So any capex announcement shouldnât impact next year results & should hopefully be ready for utilisation before FY 27. With Q4 results also itâll become clear as to what their capacity utilisation will be within 2 quarters of capacity being utilised.
Now we might debate on the valuation metrics but the management has done its best to scale keeping the financial metrics intact.
Announcement to increase the authorised capital indicates that a major announcement might be round the corner at the end of Q4 & itâs a very different path from expansion through internal accruals only. Perhaps they are eyeing something to really take maximum out of tailwinds. Needs to be seen whatâs there in store. Hope thereâs nothing fancy but the management seems to be matured enough not to do that.
Disc: Invested and biased
As you said, valuations are stretched and unless there is a concrete plan to set up new green field expansion, there is limited upside from here. Todayâs movement is due to enhancement of authorised capital resolution. I strongly believe the scrip may not regain the peak formed during Jan 25 any time sooner and this kind of âSell on Rise marketâ, there may be a long consolidation around these levels until some surprise positive announcements come in near future.
Dscl: Invested from low levels and sold some quantity post results.
Hi Raj/Experts, itâs an interesting point.
In the Q3-PPT, the management mentioned that they will hit approx 550 Cr Top line this year so effectively 158 Cr in Q4. How do you feel that number forms a trigger on share price movement?
Just started tracking this recently and I am late to join the party hence asking.
Why greenfield expansion. They have been saying in Investor presentations that existing factory has sufficient land to 6-7x their Pre- 2024 expansion capacity. So with 2025âs capacity, they can still expand 3-4x in same premise.
So definitely not needing a greenfield expansion.
To my knowledge, greenfield expansion is starting from getting approval for new capacity, building construction and infra , amenity build up , installation and commissioning of equipment. It is land agnostic.
If you consider it as brownfield expansion, you are correct.
Transformer industry was going thru very bad patch for a decade and it started looking 3 years back with lot of attention on energy sector and capacity build up . In US replacing the old transformers itself is estimated to be huge demand. In the con calls all manufacturers have been confident of demand outstripping the supplies in the foreseeable future.
But market is a different animal. It discounts the earning well in advance and the pendulam swing goes to extreme before revertng to mean value. It is very difficult to predict the market. and in my opinion , the future earning are already baked in the price. If there is a over all bull market, seniment may change for good. Otherwise, it may consolidate with downward bias.
Dscl: I am an investor in this scrip and not qualified to advice.
Any thoughts about how companies switching to the stand alone power generator like solar power, Electrolysis and use in house rather than supplied via discom affect the company?
I see from your post that shows management answers that this is full Q/full capacity of utilization.
They were hitting 110 odd cr at peak utilisation prior to capex. Even if one takes a conservative no then 100 cr a quarter. Now capacity has been almost doubled so itâs safe to assume that with augmented capacity they can hit around 190 cr & stretch it to almost 200 cr a quarter which brings to management estimate of hitting 750-800 crores.
Between the lines theyâve stated first full quarter of operations & I feel they havenât hit same utilisation with their new capacity, which is understandable since it takes time to fully ramp up operations.
The Q4 results if they hit around 160-170 crores top line will make it evident that their augmented capacityâs utilisation is getting ramped up & theyâd be hitting their target of 550 odd crores this year easily.
This is my understanding of how the business has panned out this quarter & what nos are reflecting.
I do not deny what you say. There would be some upward change in revenues from here on with the same capacity going forward (the augmented capacity). What I am saying is that there is full quarter utilization of full capacity (in this Q) as per what management has said. So they can go max to their guided revenue of 750-800Cr next year (unless they do more capacity addition again).
What Iâm concluding is that full quarter of operations is not full capacity utilisation which you implied above or I misunderstood what you wrote And I agree that theyâll do 750-800 crores which is what the management commentary is with augmented capacity
A look at the macros first, w.r.t the industry -
Domestic demand
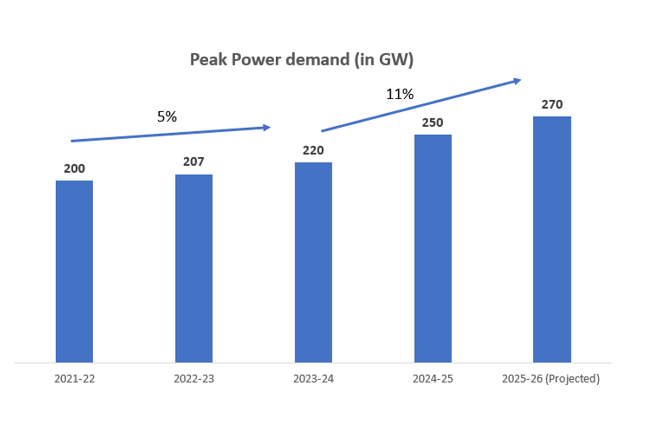
We successfully met an all-time high peak power demand of 250 GW during 24-25 ; this is expected to increase to 270 GW by next fiscal year. Further its likely to soar to 446 GW by 2030, as per CEA estimates. Clearly its increasing at a faster pace now vs the 5% CAGR achieved between FY 22 and FY 24 (Source : CEA and Powermin website).
Exports : Multiple elements driving demand like replacement of aging infrastructure, EV adoption, renewables demand in Middle East, etc
This Forbes article cites â âUnprecedented imbalance between supply and demand for transformers in USâ with analysts estimating the problem to persist till Q4 of 2026.
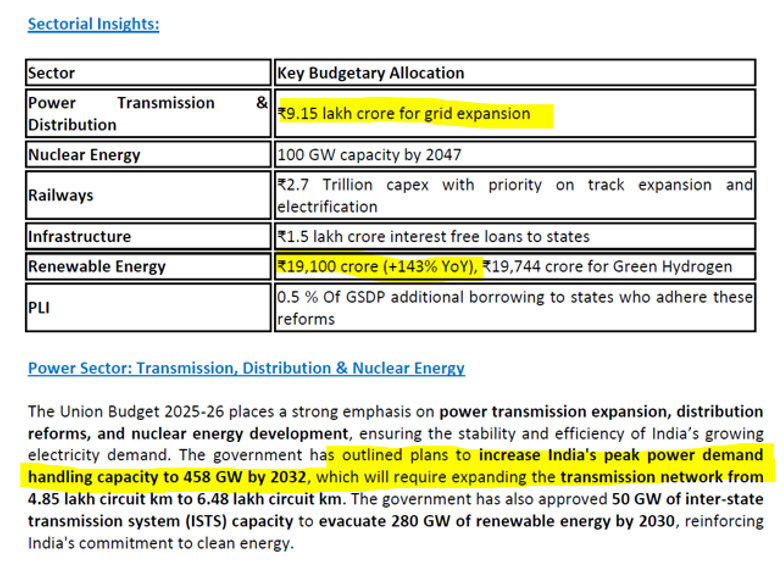
Budgetary allocation for the sector
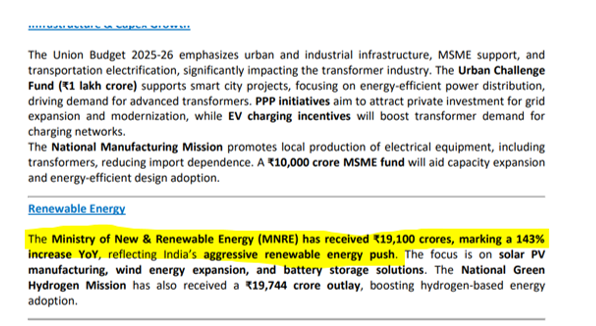
TARIL released a note on key budgetary allocation and growth opportunities for the sector. Highlighting some key stats :
Renewable energy : 143% increase YoY towards Renewable Energy
Most of the capital goods companies have seen a very sharp correction in last 3 weeks or so. Concerns on lower capex spends in the Budget being a factor perhaps, it got exacerbated further for companies like Shilchar owing to low float.
The slowdown in capex spends was primarily due to relatively lesser activity in Q1 (owing to elections, etc). However, Dec 24 capex figure of 1.2 lakh crore is actually higher than the monthly run rate for 9 months (from Apr to Dec 24) around 76,000 cr. This gradual uptick along with the budgetary allocations mentioned above, provides belief that capex story is intact for next FY.
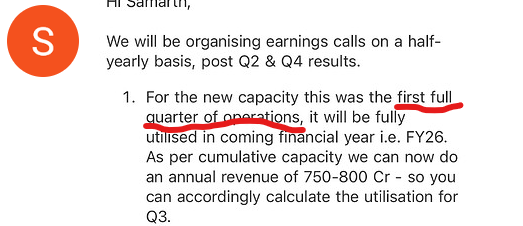
Coming to Shilchar, they will look to utilise the incremental capacity (commercialized in Aug) in FY 26.
They take 6-8 months to put up and commercialize new capacity, so even if they were to announce it in April / May - its should commercialize by Nov 24. Knowing the management and their prudent capital allocation strategies, they are likely to put up the additional capacity, catering to segments with lesser competitive intensity such that the margins remain intact.
They have indicated 750 to 800 cr as the peak revenue potential from the incremental capacity in place, in FY 26 - that would mean roughly 40% growth over FY 25 (this is without factoring in any contribution from the incremental capacity that is probably on the cards)! And an Operating Profit of more than 200 Cr. Both domestic and export demand remains strong, as alluded to by the management too, in the last call.
So consistent 30%+ growth at relatively higher margins than peers. With no dilution so far and with marginal institutional ownership! Some of the peers with lesser margins trade at higher PE multiple.
Disc: Invested; added a small quantity in the recent correction
Observation about Shilcharâs ramp-up timeline. The transformer manufacturing cycle of 13-14 weeks naturally implies that the new facility, which commenced operations at the end of August 2024, is only just beginning to contribute meaningfully. Even at full capacity, invoicing and delivery from the new facility would be limited in Q3, given the time required for production, testing, and delivery.
The managementâs clarification on CRGO availability is reassuring. With the BIS licenses renewed for multiple suppliers, raw material constraints should no longer hinder operations, making it easier for Shilchar to focus on ramping up capacity utilization.
Regarding revenue potential, the previous peak quarterly run rate of around âš110 crore from the old facility gives us a reasonable baseline. Doubling capacity should allow them to reach âš190â200 crore per quarter once operations stabilize. If they achieve around âš160â170 crore topline in Q4, that would strongly indicate increasing capacity utilization.
Interestingly, in their recent announcement, the management has also sought approval to increase the authorized share capital from âš10 crore to âš15 crore. This could indicate a potential capital raise, likely aimed at funding future capex or meeting additional working capital requirements. If this is the case, new capex plans might already be on the cards, which aligns with their long-term growth trajectory.
The full impact of the augmented capacity should reflect in FY26, with managementâs guidance of âš750â800 crore looking achievable. I agree that this would likely be the upper limit unless they expand capacity further. Still, considering the strong demand environment and the improved supply chain, Shilchar is well-positioned for steady growth over the next few quarters.
Bit of number crunching to gauge the demand side of the equation for shilchar Technologies. My understanding is that Inverter Duty transformers (IDT) with application into Renewable energy are the key driver of sharp demand that we have seen in last many quarters. Some estimates suggests that IDT accounts for 50% -60% of revenue for Shilchar.
Theoretically, going ahead demand should follow the same trajectory as that of RE incremental deployment â at least directionally.
-
Based on some reading, IDT are used not only for Solar, they are also used in Wind energy, BESS (invertor function for storage), EV charging stations, CNC/VFD machines, large industrial UPS systems (Data centre etc.) and small Hydro based REs
-
To arrive at equivalent MVA requirement per GW RE deployment, there are two broad considerations
- Concept of load power (LP) factor which ranges between 1.0 to 1.12. Put simply, per GW RE installation requires 1000 to 1120 MVA of transformer capacity.
- Next, my limited reading is that the above calculation is approximation only for a 1-phase transformer. To arrive at a 3 phase IDT MVA capacity, we need to apply an additional multiplier of 1.73 (sq. root of 3). Put simply, 1 GW RE installation may need 1730 MVA IDT capacity in case of a 3 Phase transformer (keeping aside the LP factor discussed above).
-
As per one of the recent CRISIL industry reports, below is the broad glidepath for Solar Power installation for next 3 years:
-
Also, same CRISIL industry reports has below glidepath for Wind Power installation for next 3 years:
Tabulating the numbers against base performance (2024-25), here is broad view that I am getting (using averages of yearly range provided by CRISIL for each years):
- Attached is the worksheet, if someone wants to understand the finer working. (
IDT Demand Supply working_CRISIL.xlsx (97.3 KB)). - Please note that the last column (extreme right) is representing âincremental additional demandâ against previous year (which has very different implications from incremental demand from base year if one do a mental map of runway). To illustrate, FY27 (P), will have incremental demand of 7500 MVA over last year and 19500 MVA (12000+7500) cumulative increment from base year.
- For BESS deployment glidepath I donât have a source to quote the numbers. However, based on tracking the recent developments, there is clear emphasis and shift (rightly so) towards storage hybrid projects. Some estimates suggest an ESS capacity of 23 GW by 2029. This projection may include both PHS (pumped Hydro) and battery-based ESS. Therefore, being conservative, I am pencilling-in an 8 GW Battery ESS by 2028.
- Please note, above calculation, is not considering the PF factor (multiplier of 1.12). This is also not factoring in the further 3 phase multiplier (1.73x). So, itâs a barebone equivalent simplistic conversion. However, note worthy call out that even a small % baked into the formula will change the underlying numbers significant.
- Another important consideration is that IDT is not all that at play from Solar, wind project perspective. Typically, distribution transformer is also required for grid connection (this time around, MVA to be arrived at by dividing by 1.73). So, effectively an approx 1.5x + opportunity for entrenched players with capability across spectrum.. That has also not been included into the calcuation table above.
Counterpoint, equally important since above calc is based on projections made by MNRE/provided by CRISIL. What if there are slippages and gaps?
What does data suggest here?
- Recent momentum is of around 25 GW RE addition per year (based on recent data between Octâ23- Octâ24). Prior to that, full fiscal 2023-24 saw 18 GW RE deployment.
- Out of all the different measures, Govt has a target of 50 GW RE mega tender per year (amended to have 40 GW Solar + 10 GW Wind) each year between 2024 â 2028. Against this, in FY24 GoI REIAâs had total tenders of 70 GW. Even a part of the above tender alone (even with delays) may good enough to help meet the projections above. As mentioned, these RE tender are just one of the big levers, there are few others at play as well.
Other side of the equation is supply situation. Practically, IDT demand must be ~6 -9 months ahead of RE timelines Unfortunately, we donât have much data available in public space to guestimate the prevailing ITD capacity and new capacity getting added. In the listed space Shilchar, IndoTech, Shirdi Sai (parent of Indotech), Supreme, Danish are few of the key players focused on RE sector apart from big boys like CG, Voltamp, Hitachi. Likewise, in unlisted space there are whole bunch of players at different scale and capabilities. Most of them have announced capex of various degree, however we donât have clear visibility on segment specific capex and timelines.
In a guestimated way, 2023-24 or thereabout must be the phase where demand and supply were mostly at equilibrium (or slightly tilted towards demand side). That being base index year, we are looking at approx. 2x capacity addition in next 3 years from here. Another important part is that this demand is in vertical steps. Slightly subjective view, these vertical steps may result into demand supply not converge perfectly in point-of-time context. Also, incremental steps will result in follow-on capex needs by players â to be seen how many players will have muscle and appetite to have follow-on capex. More so, considering that this is ultimately a cyclic business â just that cycles are long in both directions.
Overall, from underlying business perspective, given data suggests that the underlying business is still on strong demand footing. Even the results are mostly consistent so far for most of the players. When and to what extent supply catching up demand, margin normalization etc. are going to play out is to be assessed. That is where I have my mental stop losses placed behind delivered numbers.
Tarun
Disc: Invested, no transactions in last 6 months