PN Gadgil is down 40% too!
Nothing is spared, how long to go down another 10-15%
PN Gadgil is down 40% too!
Nothing is spared, how long to go down another 10-15%
Watch the interview

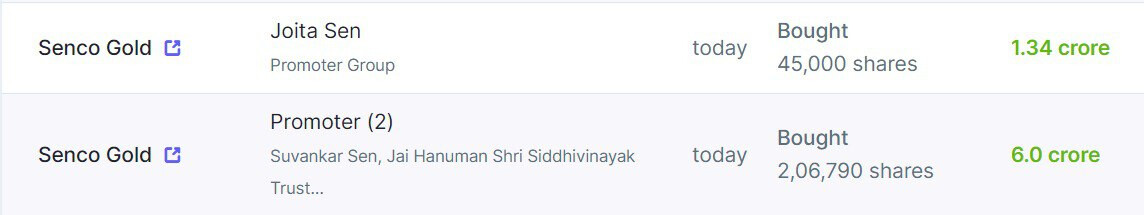
Also i see promoter buying the shares in open market
Not in any case recommendation to Buy/Sell, just stating my observation here ![]()
Yes they both are different.
First screenshot is of 80,400 Share which was bought on 19th, second screenshot saying 4.02 Cr is for 1,61,000 Shares. Attached Two different transactions separately. I think you got confused reading only one
From a high of 772 to a sharp low of 227 and now in three days moves up to 275. What are promoters upto?
Q4 FY25 business update:
senco-business-update-08-04-2025.pdf (541.9 KB)
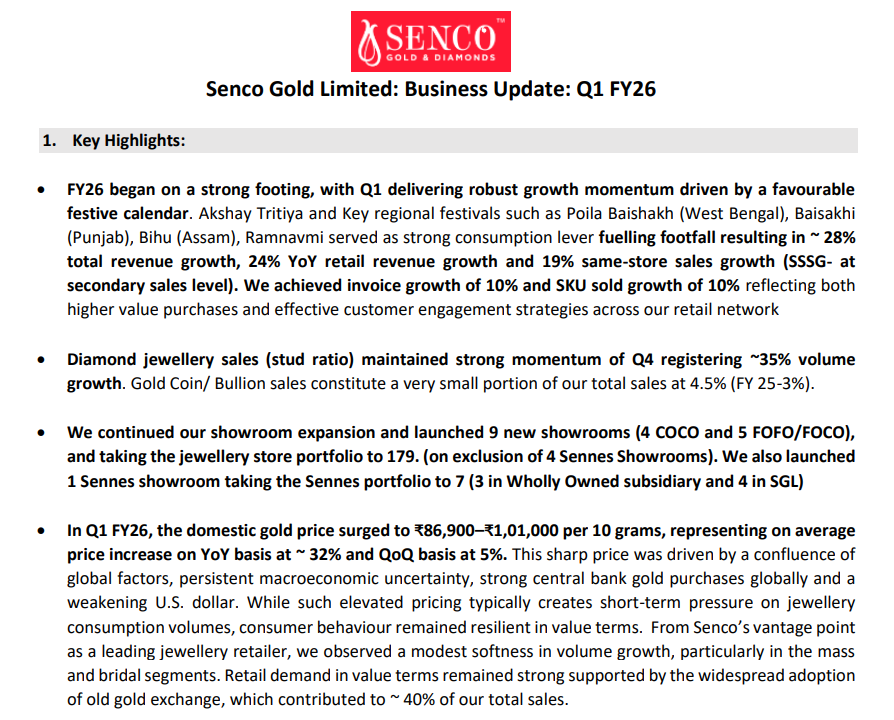
Q1FY26 business update
Senco Gold -
Q4 and FY 25 results and Concall highlights -
Share of organised sector in India’s Jewellery mkt @ 40 pc vs 32 pc in FY 20 vs 6 pc in 2007
Company’s total store count now stands @ 175 stores ( which includes 5 stores of Everlite - Jewellery for the new generation, 4 Sennes stores - selling Lifestyle products, lab grown diamonds and accessories, 13 D’Signa stores - focussed on HNI customers )
90 pc of company’s stores are leased. Only 10 pc are built on owned premises
Company employs 198 exclusive Bengali Kaarigars to work on their exclusive designs ( this makes their jewellery unique and exclusive )
Company sells its trendy Silver Jewellery under the GOSSIP brand, Men’s Jewellery under the Aham Brand
Geography wise break up of stores -
WB - 98 ( 44 owned + 54 franchise )
North + NCR - 24 ( all owned )
East ( excluding WB ) - 25 ( 12 owned + 13 franchise )
NE - 6 ( 2 owned + 4 franchise )
West - 7 ( all owned )
South - 5 ( all owned )
Dubai - 1 ( owned )
Sennes stores - 4
Total 175 stores in Mar 25 vs 159 stores in Mar 24
Company added 9 new stores in Q1 FY 26, taking the total store count to 184. Aim to take it to 195 by end of FY 26
FY 25 stud ratio stands @ 11 pc vs 11 pc in FY 24 vs 10 pc in FY 23
Avg ticket Size for FY 25 @ 73k vs 64k YoY
FY 25 outcomes -
Revenues - 6328 vs 5241 cr, up 21 pc
EBITDA - 367 vs 375 cr ( margins @ 5.8 vs 7.2 pc ). There was an adverse impact of 57 cr on account of cut in customs duty. Adjusted for that EBITDA margins would have been 6.7 pc with EBITDA @ 425 cr
PAT - 159 vs 181 cr ( without the customs duty impact, PAT would have been 202 cr )
Q4 outcomes -
Revenues - 1377 vs 1137 cr, up 21 pc
EBITDA - 127 vs 88 cr, up 45 pc (margins @ 9.2 vs 7.7 pc)
PAT - 62 vs 32 cr
Q4 value / volume growth -
Gold Jewellery - 20 pc value growth , (-) 6 pc volume growth
Diamond Jewellery - 38 pc value growth, 21 volume growth
FY 25 value / volume growth -
Diamond jewellery - 15 pc value growth, 2 pc volume growth
Gold jewellery - 20 pc value growth, (-) 4 pc volume growth
Out of the 16 stores added in FY 25, 9 are company owned, 1 Sennes store, 6 Franchise stores
Non - East business grew by 23 pc to 1230 cr
People are looking for light wt jewellery ( due sharp increase in Gold prices )
Footfalls in FY 25 were 25 pc higher than FY 24 footfalls
For FY 26, aiming to achieve an EBITDA margins range of 6.8-7.2 pc and PAT margin range of 3.5 to 3.7 pc ( Extrapolation - assuming a topline growth of 18 pc for full FY, revenues and PAT ( @ 3.5 pc ) for FY 26 can be 7465 cr and 260 cr respectively. At 3 pc PAT margins PAT can be 225 cr )
Focus on light weight daily wear + handcrafted wedding jewellery shall continue. Wedding jewellery contributes to aprox 30-32 pc of company’s topline
Aiming to open 18-20 stores in FY 26 ( equally split between company owned and franchise stores ) - mainly focussing on North and East Indian mkts
Aim to hit 14-15 pc stud ratio in next 3-4 yrs ( this should help their margins )
Earlier in Q3, company raised Rs 459 cr @ Rs 557 / share to fund their expansion ( @ avg 10 company owned stores per year ), unsticking their existing stores and to trim their debt levels
An avg company owned store opening costs them aprox 23-24 cr ( Aprox 2 cr for the store + 20-22 cr for the inventory )
Old gold exchange contributed to 40 pc of company’s total sales. Out of the total old gold that came up for exchange, greater than 60 pc of old gold was non - Senco gold - representing a clear shift from unorganised to organised sector
High gold prices are stimulating trends like - higher sales of 14 Carat and 18 Carat gold Jewellery, higher sales of studded jewellery. These trends are likely to stay
The impact of lab grown diamonds is more in bigger diamond categories. The smaller diamond sales are hardly impacted by lab grown diamonds
In Q3, the company did spend aggressively on advertisements ( during the festive season ). In Q4, the company decided not to do the same and focussed on better margin generation. Hence the other expenses have fallen in Q4 on a YoY basis
Company resorts to outsourcing a part of their Jewellery manufacturing process. They r strong @ making hand crafted and traditional Jewellery. However, they have to resort to outsourced manufacturing while going for modern / machine made designs from players who are strong in these areas
Disc: initiated a tracking position after the company came out with strong Q1 FY 26 update, not SEBI registered, not a buy / sell recommendation, posted for informational purposes only
Senco Gold -
Q1 FY 26 results and concall highlights -
Added 10 new stores in Q1 - 5 COCO stores ( including 1 Sennes store ), 1 FOCO and 4 FOFO stores. This takes company’s total stores to 186 ( franchise showrooms @ 76 ). Aim to add another 10 stores in current FY
COCO stores representing 63 pc of company revenues grew by 25 pc. FOFO / FOCO representing the remaining 37 pc of company’s business grew by 34 pc
Hallmarking of 9K gold Jewellery is now mandatory and should help support demand in the face of rising gold prices
FY 26 guidance - 18-20 pc revenue growth, 6.8-7.2 pc EBITDA and 3.7 - 4 pc PAT ( at the lower end of guidance, this translates to 273 cr of PAT vs 165 cr LY )
Q1 outcomes -
Revenues - 1826 vs 1416 cr, up 29 pc
Gross margins @ 19 vs 17 pc
EBITDA - 183 vs 108 cr ( margins @ 10 vs 7.8 pc ). Reasons - sharp improvement in stud ratio to 11.6 pc, tight control over costs
PAT - 104 vs 54 cr, up 91 pc
In Q1, Company reported a SSG of 19.6 pc
Geography wise breakup of stores -
WB + Kolkata - 101
NCR + North - 25
East ( ex - WB ) - 26
NE - 6
West - 9
South - 5
Central - 6
Dubai - 1
Sennes stores - 7
75 pc of company’s Jewellery is made in house - by a team of 186 - highly skilled karigars. Bengali karigars are known for their exquisite artistic work and talent. Out of rest 25 pc, aprox 20 pc is traded Jewellery and 5 pc is factory made
90 pc of company’s stores are leased. Only 10 pc are built on owned premises
Sennes stores focus on lab grown diamonds, other lifestyle products
Company sells its trendy Silver Jewellery under the GOSSIP brand, Men’s Jewellery under the Aham Brand
People are looking for light wt jewellery ( due sharp increase in Gold prices )
Old gold exchange is now 40 pc of company’s overall business vs aprox 25 pc 3 yrs ago - due high gold prices
Silver + light fashion jewellery is growing at rates > 60 pc
Gold coin sales out of company’s total sales is aprox 5 pc
Volume and value growth in diamond jewellery has been 36 and 54 pc respectively ( that’s rapid growth !!! ) - directly helping the company clocking better margins
Most of the 9K,14k jewellery sold by the company are studded with Daimonds / Other stones - hence end up having a higher EBITDA margins
LY - when the Gold prices were moving up from 60k to 80k, consumers were reluctant to buy studded jewellery and were insisting on buying gold jewellery on price corrections. This phenomenon is not being seen now - as the Gold prices have moved up further from 80k to 1 Lakh
Inventory on 30 Jun stands @ 3550 cr ( including gold, silver, diamonds, platinum etc ) - that’s roughly equivalent to 2 Qtr’s sales
Every percentage point increase in stud ratio inclines EBITDA margins by 30-40 bps ( roughly )
Primary sales in Q1 was 34 pc vs 24 pc secondary sales growth ( talking about franchise stores ). This is also because company has opened 5 new franchise stores in Q1
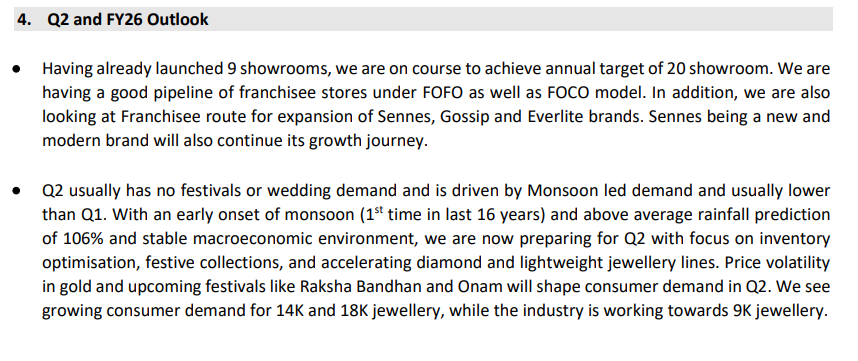
Most of the wedding dates in current FY shall fall in Q3 and Q4. Hence, Q2 may be a little soft
Early consumer response to 9k Jewellery has been encouraging
Henceforth, most of the expansion shall focus on Franchise stores ( aim to take incremental store opening ratio to 7:3 in favour of franchise stores vs 5:5 at present ) . This helps the company manage liquidity in a much better way and ensures 100 pc hedging. This is the model that Kalyan jewellers also followed with great success
Company’s main focus shall always be East and North India ( for foreseeable future )
Key risk : their hedging policy is not the best in class. I personally think, an improvement in this aspect is necessary for a sustained re-rating on the stock price
Disc : initiated a small position in Senco Gold + PNG Jewellers, not SEBI registered, not a buy/sell recommendation, posted only for educational purposes
To Hedge or Not to Hedge – The ‘Gold’en Question
Gold jewellery retail in India is one of the most attractive consumption businesses. It sits at the intersection of cultural demand, wealth preservation, and organised retail penetration. But a fascinating divergence exists within the sector – the approach to hedging gold exposure.
The industry leaders – Titan (PE 85+) and Kalyan Jewellers (PE 65+) – command staggering valuation multiples. These businesses have earned their premium through:
Each of these factors contributes meaningfully to why these companies are treated as near-defensives in consumer portfolios.
Beneath these giants lie aggressive regional players such as:
Unlike Titan and Kalyan, these companies:
Their valuations reflect this risk: Senco ~27–28x PE, TBZ ~17–18x PE.
Between Jan–Apr 2025, gold prices surged ~25%(₹80,000 → ₹100,000 per 10 gm) and have largely sustained. While the fully hedged leaders passed this through without additional benefit, the “unhedged” challengers could benefit from inventory gains when prices rise. Senco, TBZ and Radhika, all with a decent inventory days number, should be sitting on significant low priced inventory that would now be sold as wedding season comes in.
This dynamic was visible in Q1 FY25 results, where Senco and TBZ posted significant margin improvements that were potentially partly aided by gold price movements.
These players are not just opportunistic beneficiaries of gold’s rally – they are genuine growth stories:
Demand dynamics remain intact despite high gold prices. Indian consumers typically spend fixed budgets; if gold becomes more expensive, they simply buy lighter pieces or lower caratage – which often carry higher margins. Value growth is supported by price-led expansion, even if volumes stay flat.
We believe the valuation gap between the national leaders and regional players is too wide.
We are invested in three such challengers:
Indian jewellery retail remains a long-duration structural story. Drivers such as:
…will continue to support the sector.
But within it, the current environment highlights a key lesson:
In gold retail, full hedging brings stability, but partial hedging creates optionality .
And in the market’s eyes, that optionality may just be the golden arbitrage for investors to exploit
Disclosure : We are invested in the names mentioned above with buy transactions this month in the FO portfolio and might change our view anytime. This is not investment advice. Please do your own research.
Agree with your views fully, i had been an early investor in kalyan jeweller but had to exit in Jan 25 due to astronomical valuations. Betting on Senco Gold now because of below reasons
Jewelry Retail businesses have one primary capex - i.e. Inventory. As most of the stores are on lease, these retailers buy new inventory for display at stores to expand.
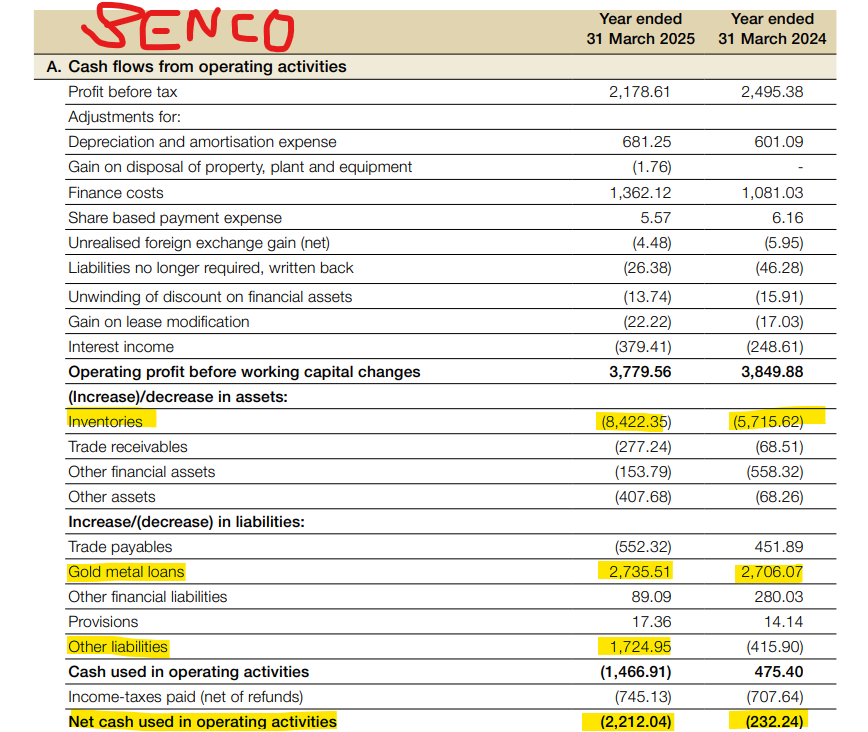
Inventory funding can be via Debt (Gold Metal Loans, WC) or Equity Dilution (QIP, IPO, FPO). Another important aspect of cashflow buffer for these retailers is - “Customer Advances (CA)”.
Ex: A customer pays upfront (say ₹1,000/month for 11 months, then buys jewelry in the 12th). While the cash is already received, the retailer records this as a liability until the jewelry is delivered to the customer.
So, the most important aspect of this business becomes inventory turn and it’s funding.
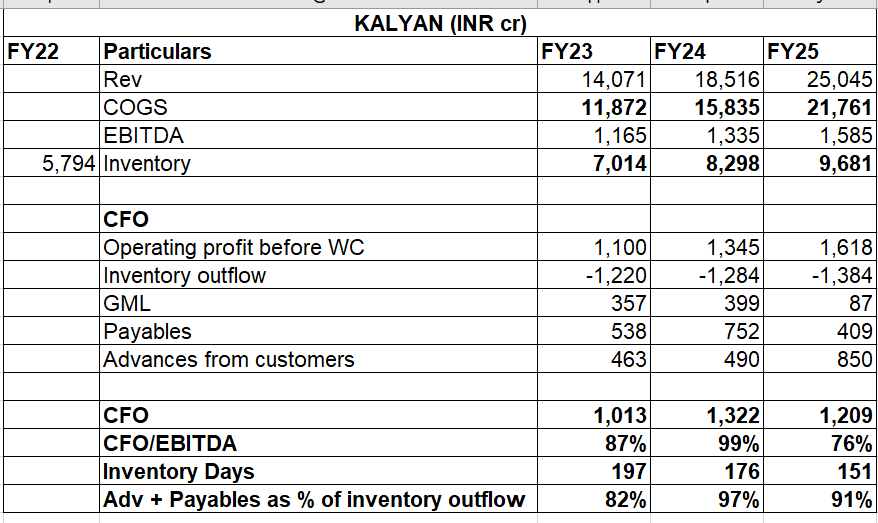
An interesting insight that came up upon analyzing Titan, Kalyan and Senco is that:
Kalyan has managed to fund ~90% of inventory outflow using customer advances & supplier credit (read: payable days of 40-45).
So, despite having avg inventory days of 175 (last 3 yrs), they have an avg ~87% CFO/EBITDA conversion as they didn’t use their own money to grow.
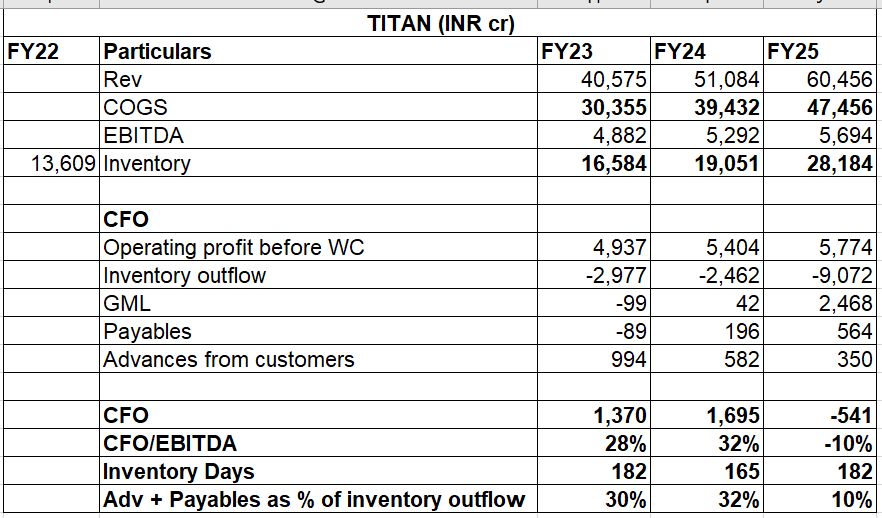
Titan averaged inventory days of 176 (last 3 yrs).
However, only 24% of the inventory was funded by CA + Payables.
But Titan managed to convert ~17% CFO/EBITDA (last 3 yrs), which was mainly possible due to their higher studded ratio % (30% vs Senco at 11%). Thus, higher margins built enough cushion for high inventory and still generated cash.
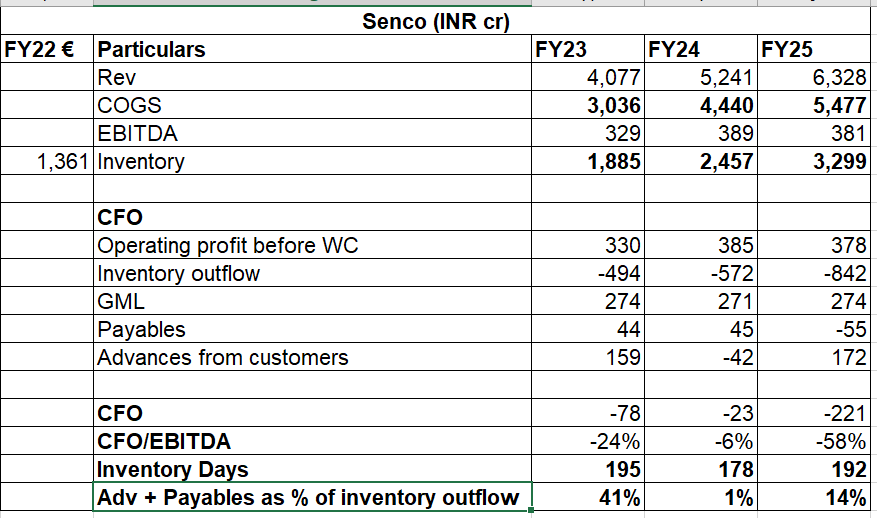
Senco averaged inventory days of 188 (last 3 yrs). (estimated)
19% of the inventory was funded by CA + Payables.
Avg CFO/EBITDA conversion (last 3 yrs) was -29%.
That’s because they neither had high margins as Titan nor were able to fund their purchase (read: expansion) via other sources.
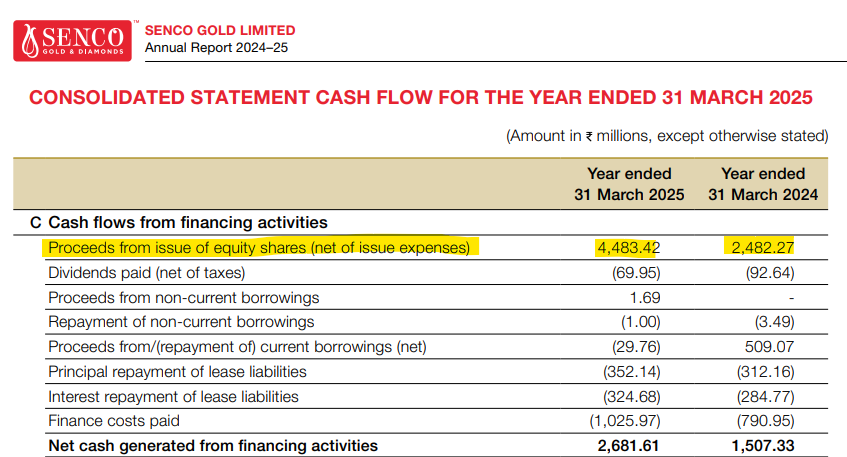
Now, in order to plug the hole, Senco used a combination of Debt (GML) and Equity Dilution (QIP and IPO money). What’s worrying to me is Senco has plans of opening 20 stores each year, which means new designs/SKUs - i.e. more inventory. Debt/Equity is 1x.
So, how will they fund the growth if this cash flow issue is not solved? More importantly, what does it say about the business model of the company?
Note: I have taken avg inventory to calc inventory days.
Under the CFO head, I have captured only the big line items & then finally mentioned total CFO.
Below are assumptions I have made to understand the difference between 3 retailers. If there are any errors or incorrect assumptions, request to highlight.
Disclosure: Tracking position
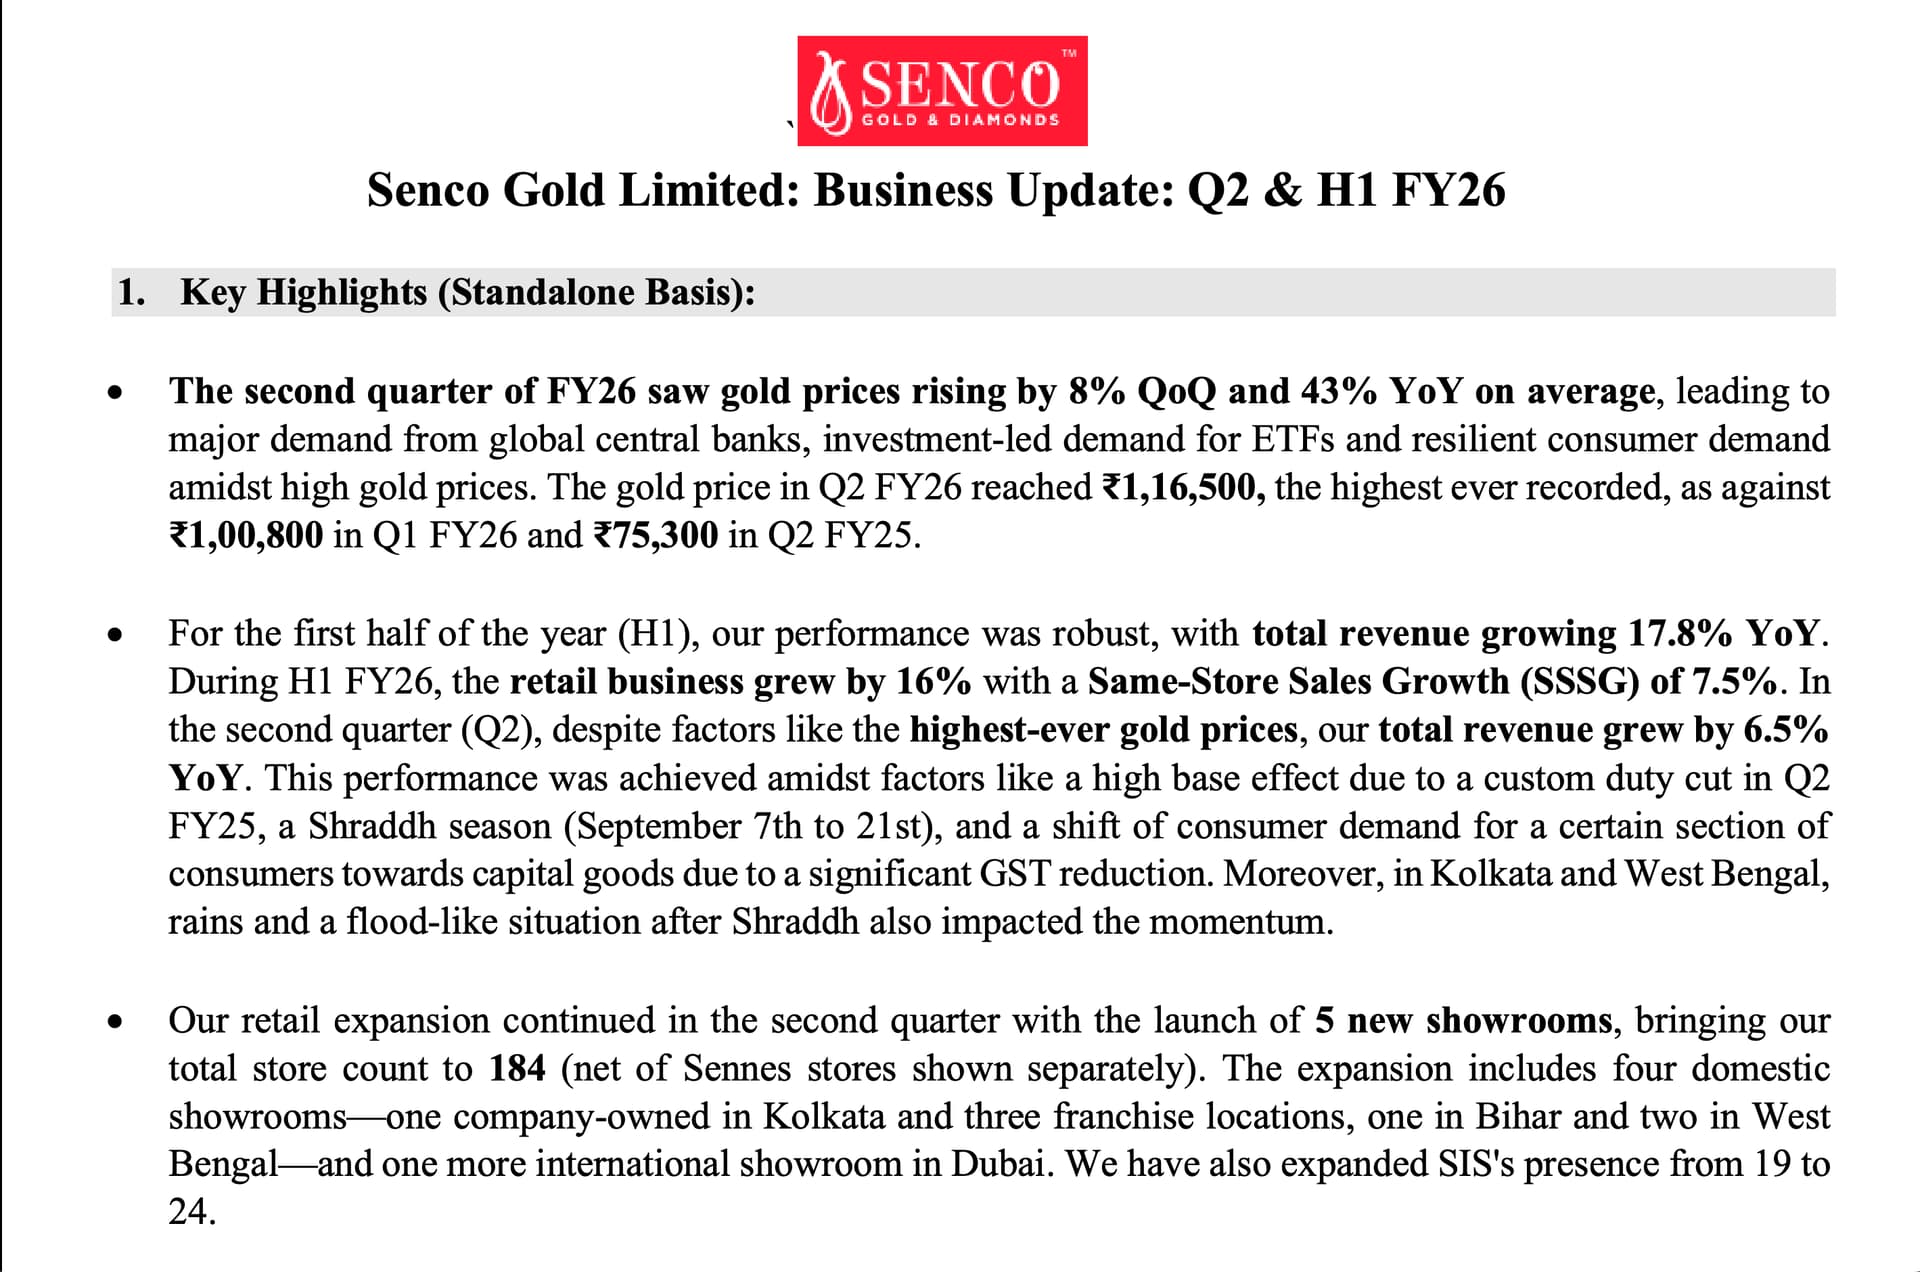
Total revenue grew by 6.5% year-on-year (YoY).
Gold prices continued to rise during the quarter. While Q2 FY25 had a high base due to the customs duty reduction, this was partially offset by an early festive season in September.
Peer performance: Other companies reported stronger growth - Titan: 19%, Kalyan: 31%, PN Gadgil: 29%, and PC Jewellers: 63%.
Senco remains confident of achieving 18–20% topline growth for FY26.
Senco Gold -
Q2 FY 26 results and concall updates -
Revenues - 1554 vs 1458 cr, up 7 pc
Gross margins @ 17 vs 12 pc
EBITDA - 108 vs 55 cr, up 95 pc ( if not for the custom duty impact in Q2 LY, EBITDA growth would have been @ 27 pc )
PAT - 53 vs 17 cr, up 215 pc ( if not for customs duty impact in Q2 LY, PAT growth would have been 36 pc )
Diwali and Dhanteras updates -
Clocked sales of 1700 cr in Oct 25, up 56 pc YoY. Volume growth in Gold, Silver and Diamond in Oct stood @ 4 pc, 8 pc and 5 pc respectively
In last seven months ( ie Apr-Oct ), Sales growth stands @ 25 pc with SSSG @ 19 pc ( vs 17 pc sales growth in H1 )
Total no of stores now @ 192
Stud ratio in H1 stood @ 12 pc
Full yr topline growth guidance @ 18-20 pc
In Q2, avg gold prices were up 43 pc YoY
Added 6 new showrooms in Q2 - 03 Company owned and 03 Franchise stores ( including 1 store in Dubai )
Coin sales in H1 stood @ 4 pc - in line with historical averages
Eastern India + WB contributed to 81 pc of company sales. Percentage of sales coming from franchisees stood @ 36 pc
Geographical breakdown of company’s stores -
WB - 106
North India - 25
East India ( Ex- WB ) - 26
NE - 7
West - 9
South - 6
Central - 6
Dubai - 2
Sennes stores - 8
Total stores @ 192 vs 175 as on 31 Mar 25
Marketing expenses in H1 ( as a percentage of revenues ) stood @ 2.5 pc vs 1.7 pc in FY 25
Avg selling price in Q2 @ 86k, up 16 pc YoY
Old gold exchange as a percentage of total sales @ 42 pc ( on the higher side due record high gold prices )
Elevated stud ratio ( @ 12 pc ) is helping company’s profitability
Excessive rains in Q2 in Eastern and North India had an adverse impact on Q2 sales
Company’s topline growth in Q2 has lagged its peers ( by 15-20 pc ). However their business did pick up strongly in Oct and the trends seen in Nov are also good
Company’s long term sustainable EBITDA margin band is 7-7.5 pc. Should be able to clock similar margins in FY 26 as well ( on a topline of 7400 cr, absolute EBITDA should be around 550 cr )
As on 30 Sep, company’s hedging cover was around 70 pc
EBITDA margins in Q1 were @ 10 pc as the hedging cover in Q1 was lower leading to inventory gains
Have a pipeline of another 8-10 franchisee stores to be opened in near future ( its capital light for the company to go for franchisee led expansion as the Inventory investments are made by the franchisee )
SSSG for Q2 was @ (-) 4 pc, H1 @ + 8 pc and for YTD till Oct @ + 18 pc
Inventory gains in Q2 stand @ aprox 7-8 pc ( due higher hedging ratio maintained by the company )
Sales for light weight jewellery are holding up well - a trend seen due high gold prices ( also plays to company’s strengths as they r good at making light wt jewellery with a wide array of designs )
In East India, a store takes about 12 months to break even. For non - East India stores, this timeline extends to 2-3 yrs
Company’s main focus wrt expansion shall continue to remain in North and Eastern mkts. 80 pc of new store openings shall happen in North and Eastern mkts
Disc: hold a small position, biased, may add if the performance in Q3 improves vs Q2, not SEBI registered, not a buy/sell recommendation
Pretty wild seeing gold hit ₹1,40,000, but Senco Gold is somehow making it look easy. They just posted a massive 51% jump in revenue compared to last year, which is honestly impressive given how expensive everything is getting right now.
Moving toward those lightweight, more affordable designs may be the reason.
The remaining wedding season is coming up in Q4; it doesn’t look like they will be slowing down.
Senco inventory is hedged by 60%. Huge inventory gains also a plus point, can deliver margins between 8-10%. Current inventory valuations are close to 5000 cr. Too cheap.