
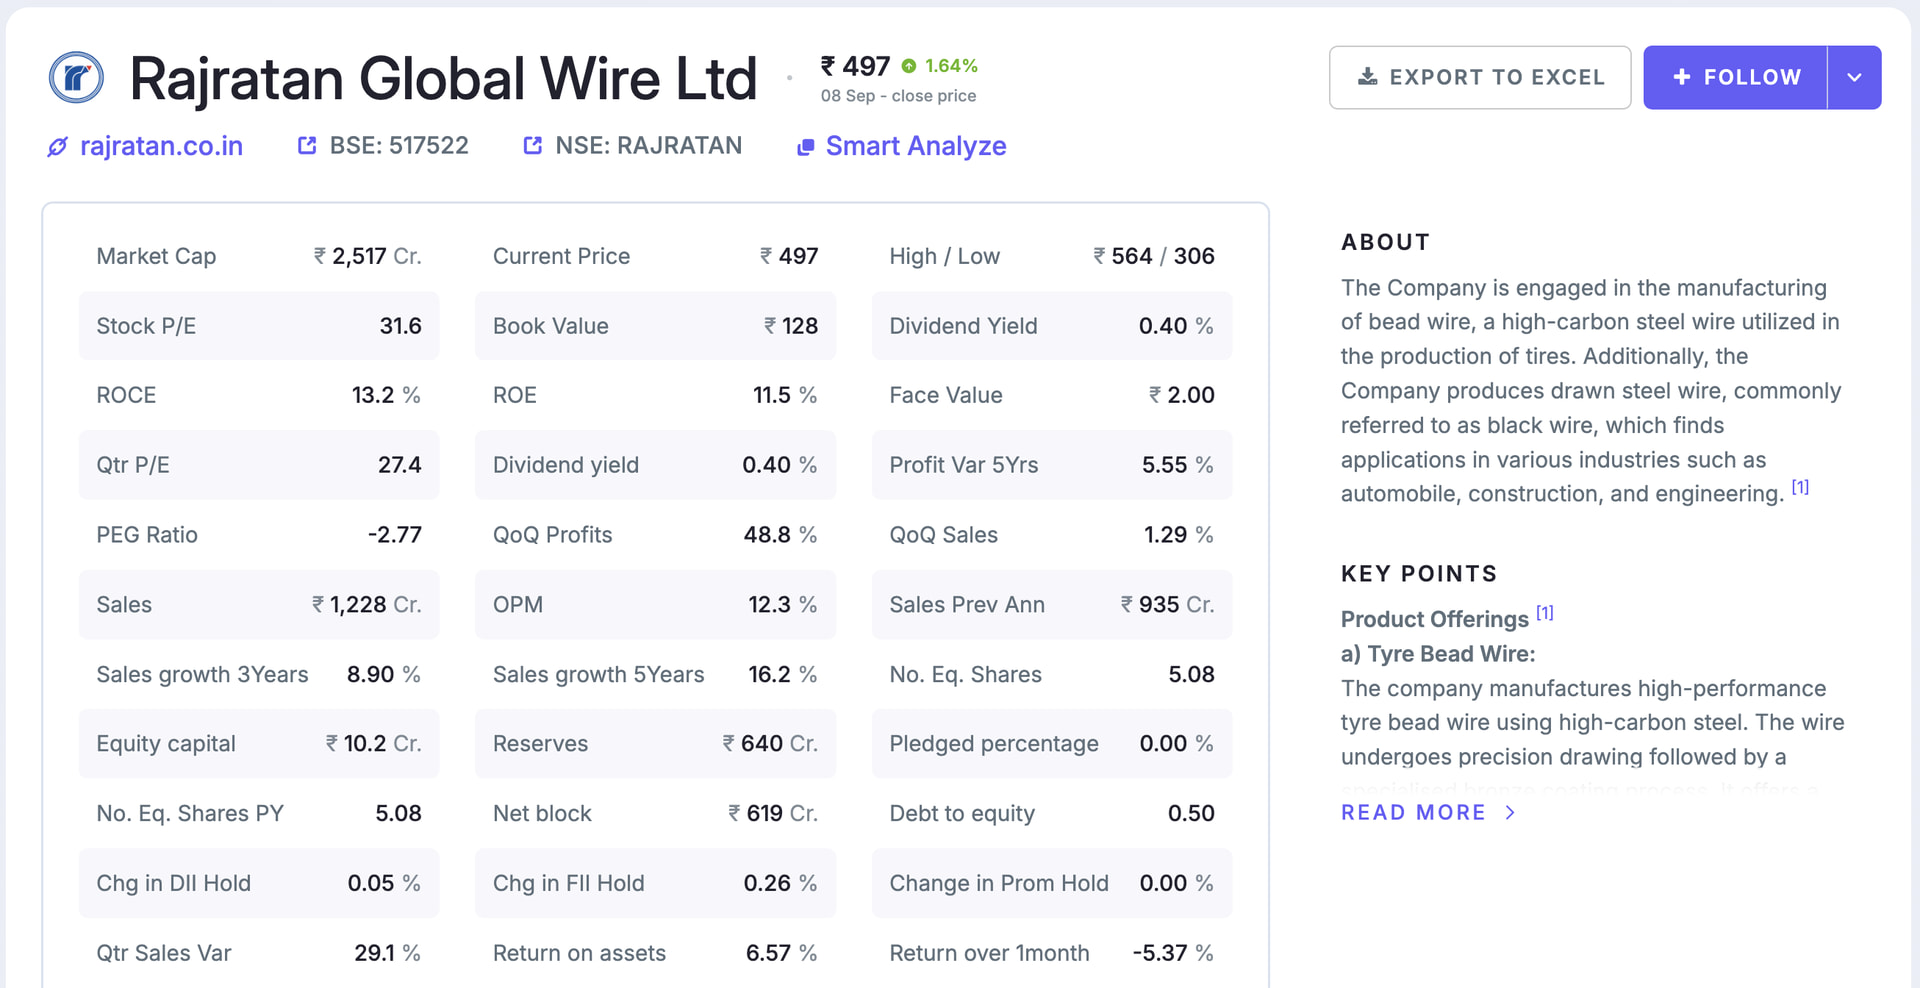
Hi @Garuna We are showing the company logos only on the company page now. Going forward, we will try to provide the option of switching on/off the logos on the watchlist/peers.
4 Likes
Everyone would appreciate a page where we can see names of all people/funds we are following in one go. Thank you
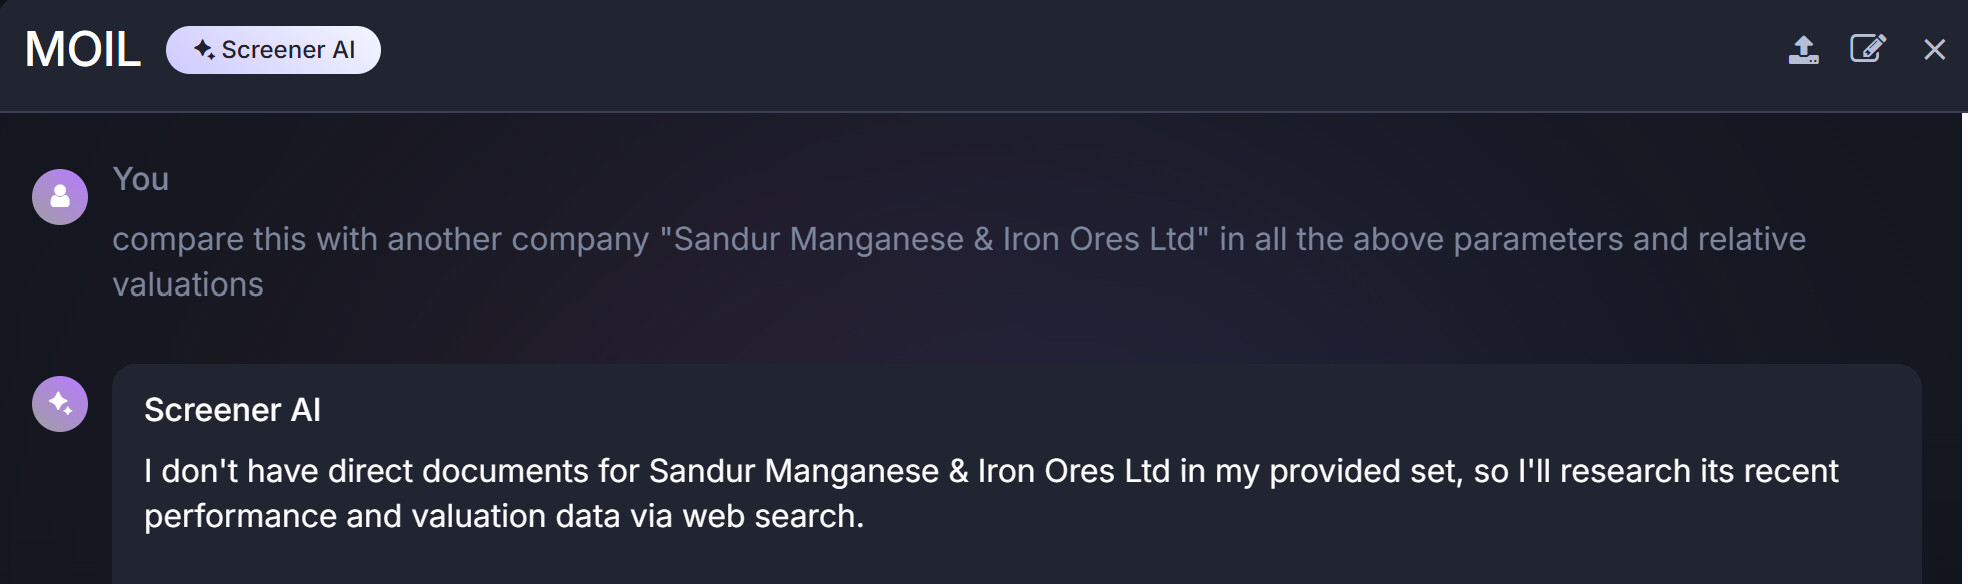
@kowshick_kk AI feature doesn’t search the documents within screener ecosystem, when you use a “compare with other entity” prompt. It goes out into the web search instead of looking inside screener first. Pls check
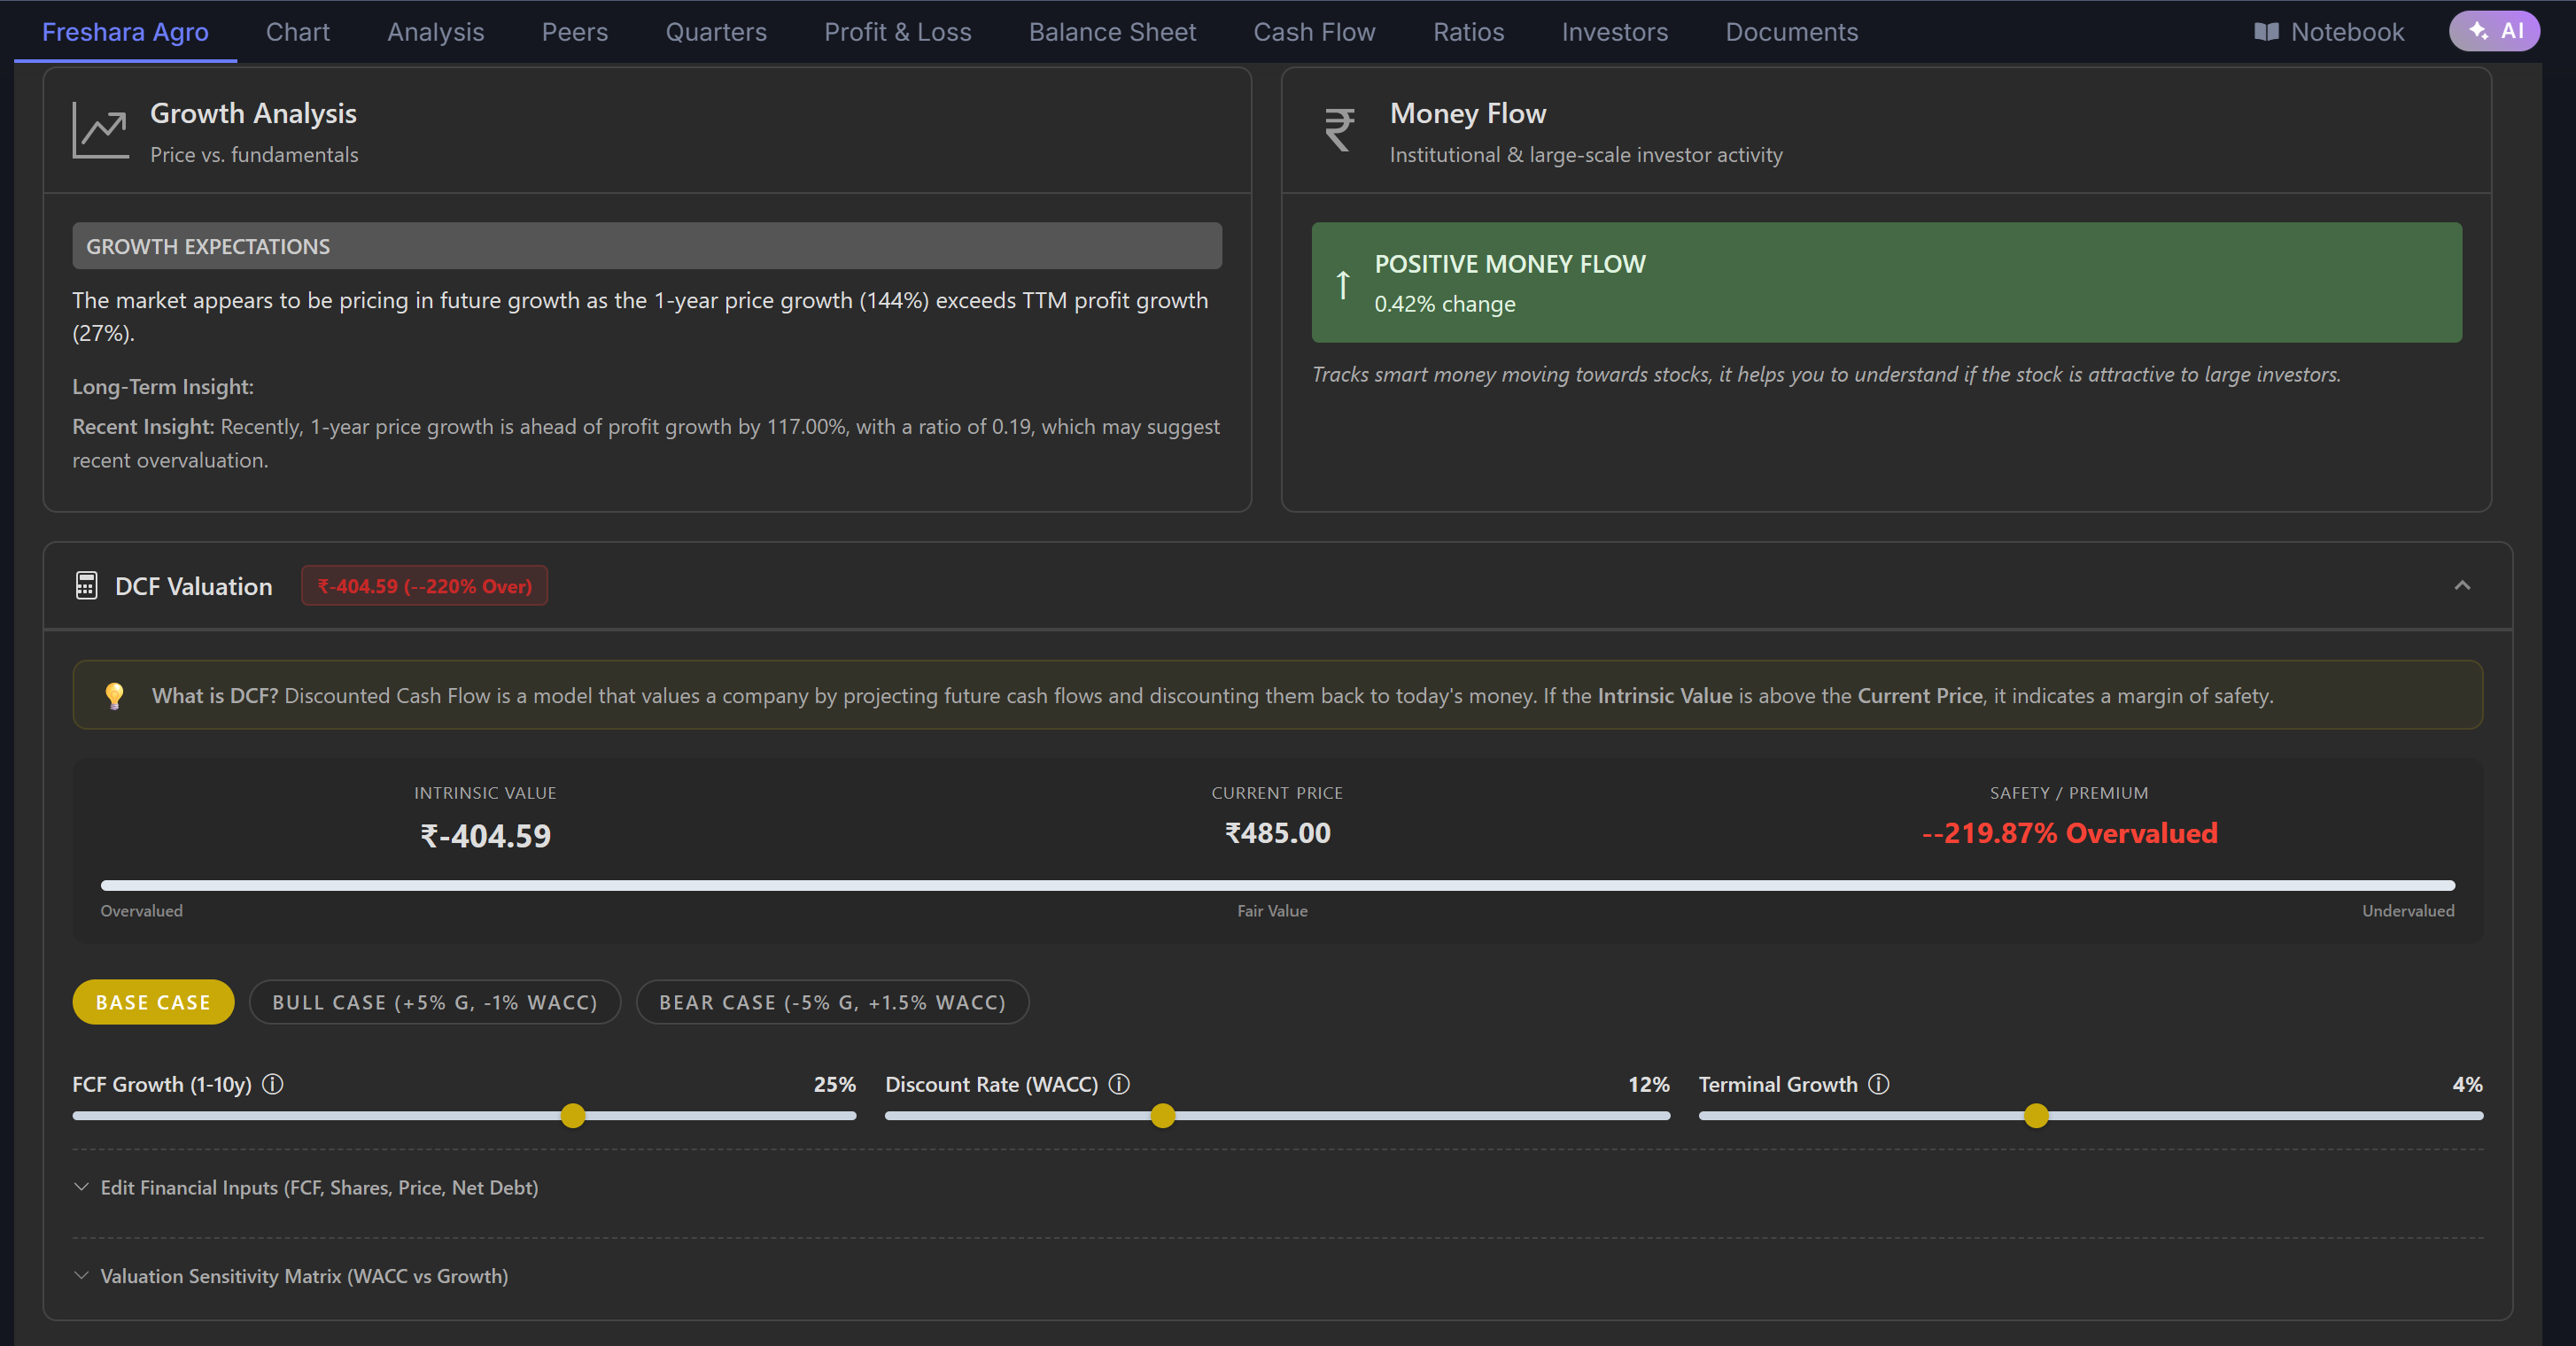
Thanks for this tool. Can you help understand how DCF works, does it consider numbers from recent news, like new cash flows from new acquisition or capex, etc. For instance in Freshara, there was new spain acquisition. Has the expected cash flow part of Bull case.
I see that many recent apps and websites are inspired by good old screener.in, which itself is proof how good it is. Tijori is inspired brick by brick but more visual representation of the similar information and features.
Of course these newer efforts have added few features, but overall screener remains the best, for sheer simplicity, or lack of complexity.
Speaking of features, I had requested this feature long back and i see it now elsewhere… ability to find common stocks which appear in multiple scans…and some way of portfolio tracking…maybe it can be integrated in notebook feature (that appears on a company page) as it already shows when you added that to the watchlist and also the percentage of returns since then.
3 Likes
Hi @antson_m Screener AI is very good at company-level queries. For instance, you can look at the ITC company page, and you can ask about its Products, industry-level dynamics, etc., and it will give you very well-curated responses.
However, it doesn’t have the capability to look for documents at multiple company level at the moment. We plan to bring such capabilities in the coming days.
2 Likes
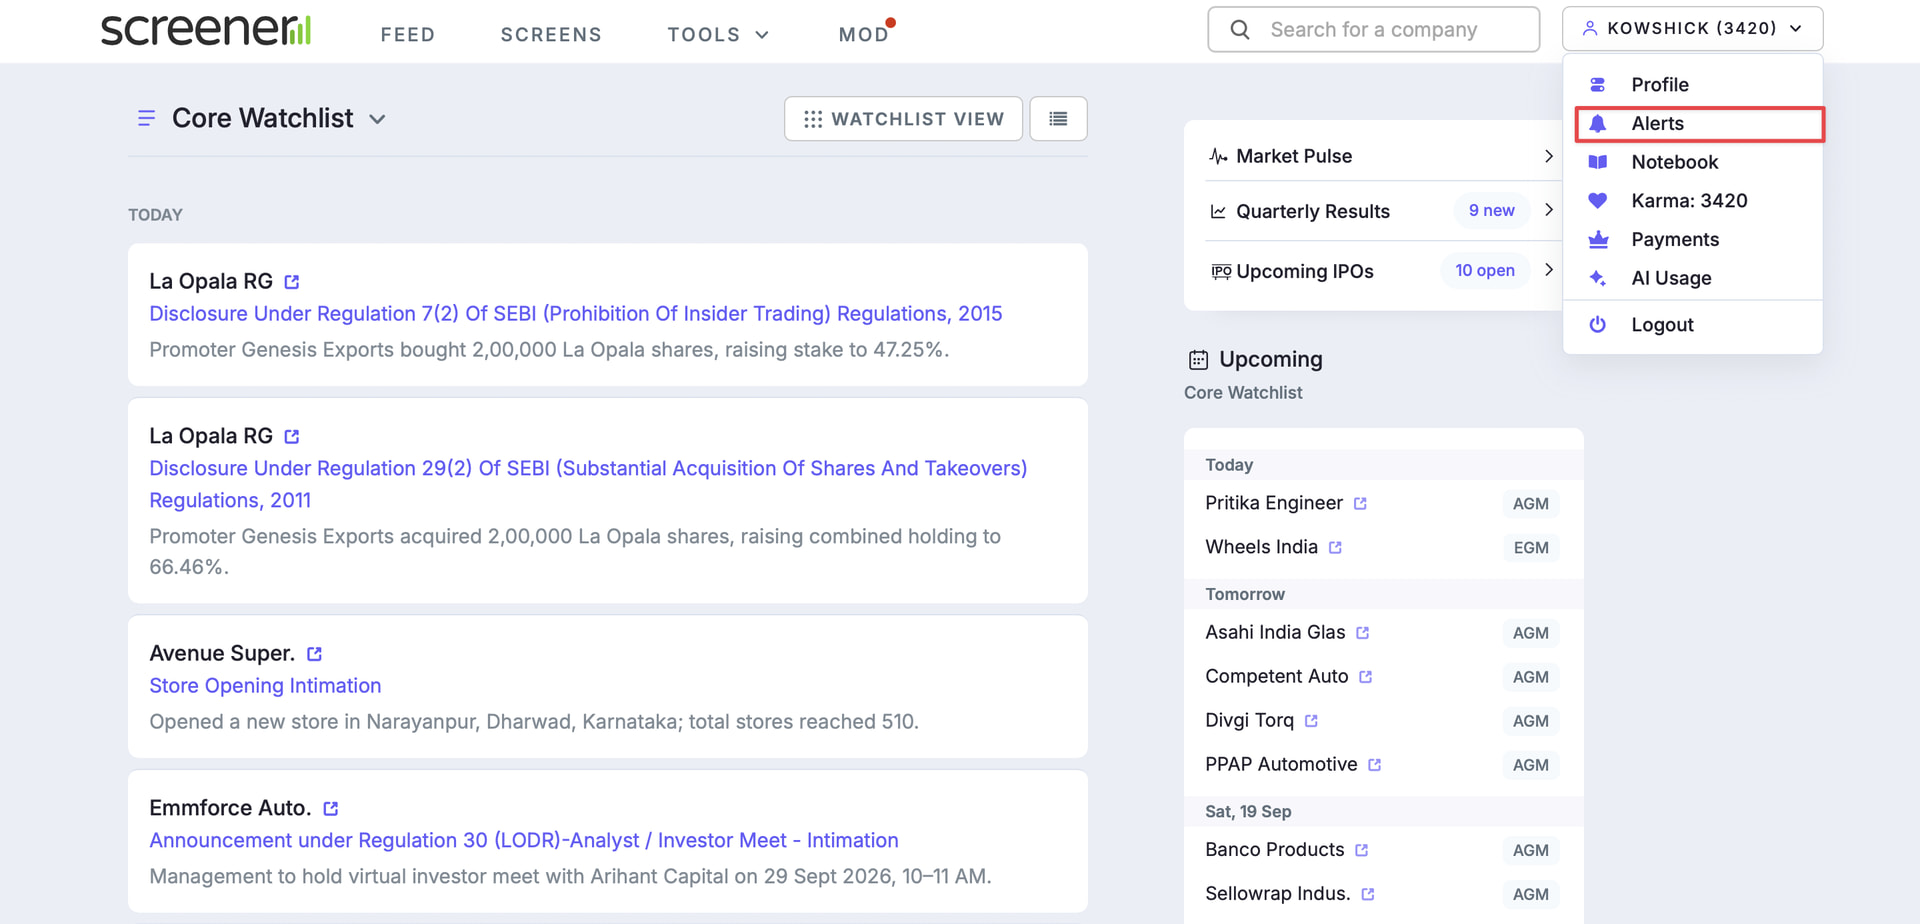
Hi @DrHarshilRohit You can see the list of people that you follow on this page: Register - Screener
Here is the navigation for the above alerts page:
1 Like
I note that Pinelab’s ev/ebitda at 23x is not a true picture. We should adjust 6-7K of cash which is earmarked for other purposes. this will result in ev/ebitda at ~40x.
This may also be true for zaggle kind of companies.
@kowshick_kk not sure if solution possible but just flagging it.
Thanks
1 Like
Pine Labs’ displayed EV deducts cash that includes restricted customer/merchant settlement balances. However, adjusting the verified amount takes the multiple from 22.89× to 33.27×—not 40×- using the same earnings denominator.
Our calculation
- How Screener arrives at 22.89×
• Market capitalisation: 20,075.31
• Add debt, including leases: 440.65
• Less cash/bank balances: 8,225.92
• Enterprise value = 12,290.04
• EBITDA used: 536.85
12,290.04 ÷ 536.85 = 22.89×
- Restricted cash included in that deduction
The annual report identifies ₹5,569.74 crore as earmarked prepaid-card and merchant-settlement balances that cannot be used for general purposes.
The cash figure reconciles exactly:
₹1,393.08 crore cash equivalents + ₹6,832.84 crore other bank balances = ₹8,225.92 crore, including the restricted amount.
- Excluding that restricted cash
• Adjusted EV: 12,290.04 + 5,569.74 = ₹17,859.78 crore
• Adjusted EV/EBITDA = 17,859.78 ÷ 536.85 = 33.27×
We should not also add the same matched customer/merchant obligations to EV, which would double-count the adjustment.
Conclusion: The treatment of restricted settlement cash warrants correction/review. IPO proceeds earmarked for future business spending are a separate category and shouldn’t automatically receive the same treatment.
Official annual report: Notes 15–16, printed pages 331–332.
Please let us know your further thoughts @joinjp2003
Thanks a lot for a detailed explanation.
Fine with 33.3x. Will this be displayed? Or we have to calculate it on our own ? In this case you say adjusted so is that readily available?
Thanks for your attention.
1 Like
@kowshick_kk Lot of non english characters getting generated while using AI. Pls looking into it.





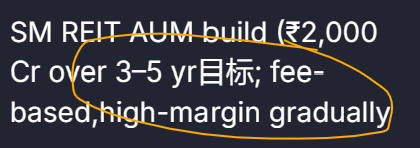
@antson_m Thanks for sharing this. Yes, we have also observed these issues. We use multiple AI models to get better responses, and one of the models is a Chinese model, which sometimes provides the output in Chinese.
The issue will not happen in Expert Intelligence mode. I have shared the issue with our team and will try to get it updated soon.
1 Like
@kowshick_kk : Could you please check and revert why
Dividend Yield for Bata India Ltd is shown as 4.07% although Profit & Loss statement shows that Dividend Payout % for FY26 is 86% of 10.44 (EPS in Rs)?
I’ve solved this by adding a prompt to remove “non-english characters in the reports”, how that takes additional AI credits.
- FY26 payout: 86%
Bata’s FY2025–26 dividend was ₹9 per share. Using consolidated EPS:
₹9 ÷ ₹10.44 × 100 ≈ 86.21% → displayed as 86%
Your reverse calculation, ₹10.44 × 86% ≈ ₹8.98, differs slightly because the displayed figures are rounded.
- Current dividend yield: uses ₹25 per share
Bata declared a single ₹25 interim dividend for FY2026–27 on August 11, 2026, with record date August 19.
At the verified October 5 closing price of ₹611.05: ₹25 ÷ ₹611.05 × 100 = 4.0913% → 4.09%
Screener’s rule groups dividends by financial year. For an incomplete latest year, it compares the current-year interim total with the preceding year’s dividend and uses the larger amount—here ₹25 versus ₹9.
Official ₹25 dividend announcement — page 1:
1 Like
That clarifies it.
I suggest you consider updating all the summary data, which is shown at the top, using TTM (Trailing Twelve Months) results. Till date, I was under an impression that all of them are based on the results of the last financial year(LFY). For instance, Stock P/E is based on LFY.