Hi @Prdnt_investor We purchase the SHP data from the exchanges and we don’t get any unique (differentiation) ID from the exchanges. Thus, such entries are shown seperately.
We have been planning to work on a new tree structure algorithm, where we plan to integrate such entries at our end as you have suggested. This shoudl enable investors to track Investors/Institutions with ease.
3 Likes
Hello @kowshick_kk.
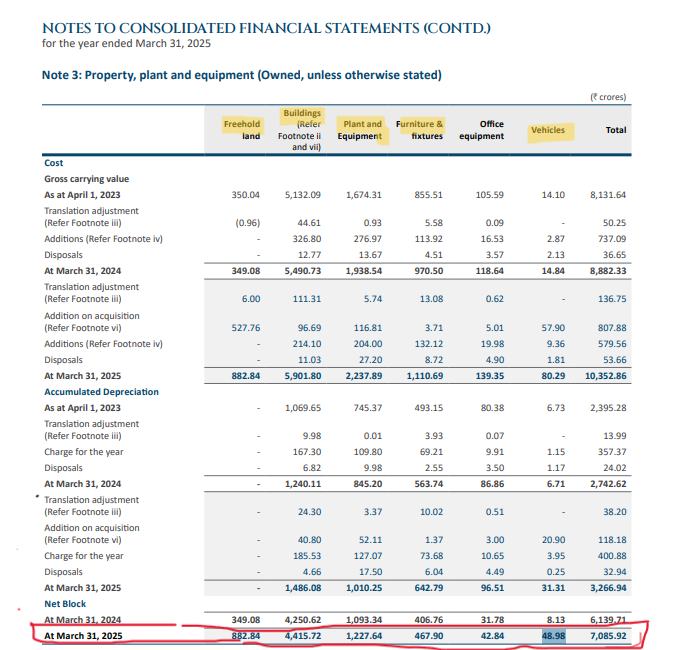
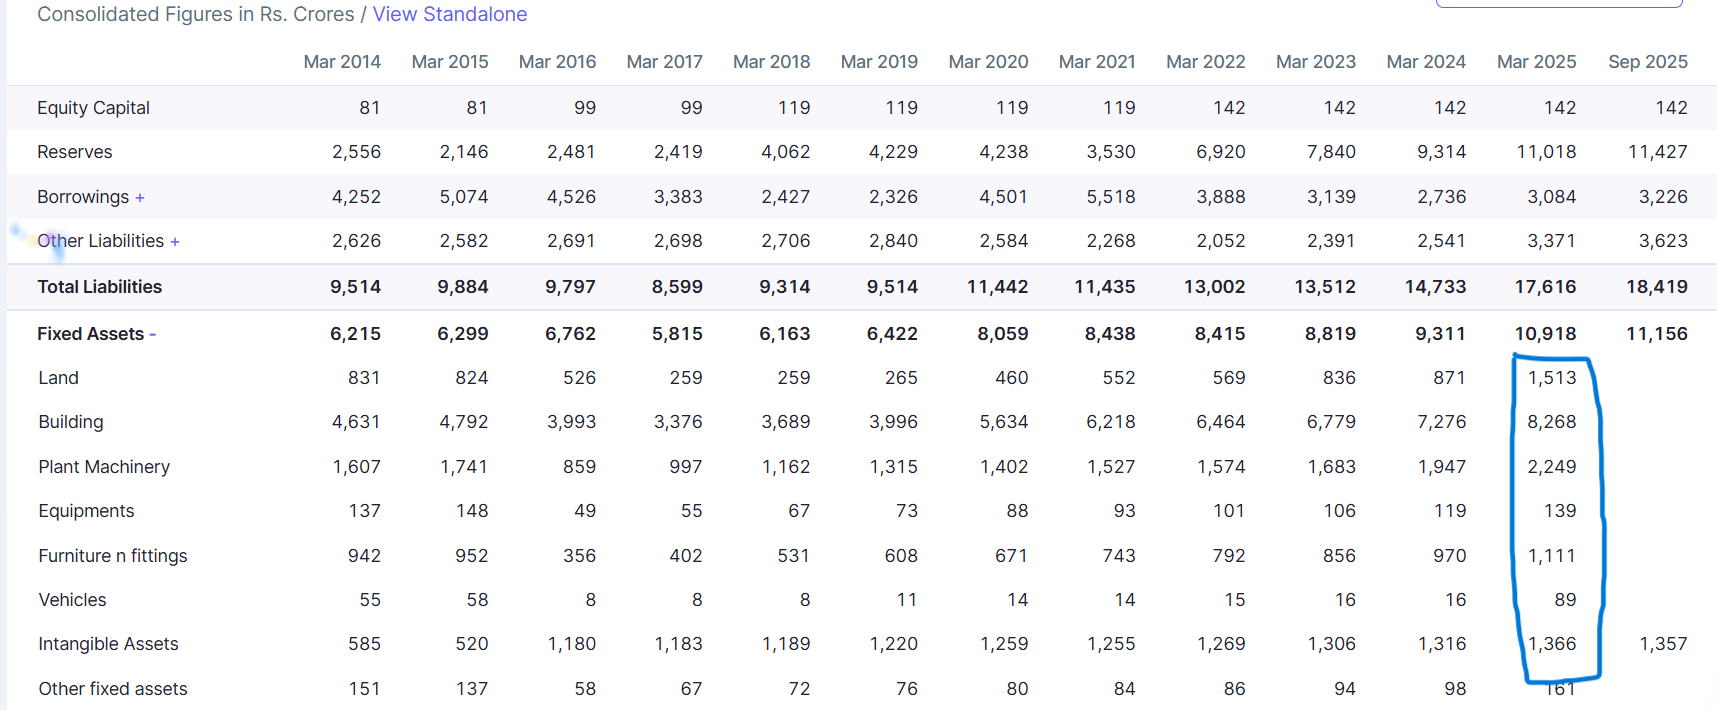
I have observed some material mismatches in the Balance sheet where the Fixed assets decomposition into land, plant machinery, building etc… - they are really helpful but the data seem to be wrongly stated.
You can see it for any company . In my case, while analysing Indian hotels company the actual figures from the “Consolidated” notes to account section of the annual report under Property, plant and equipment section – the values of this land, building etc doesn’t match at all with that of screener values on the same “Consolidated” page.
Also, one small suggestion –
If screener would provide the (info button) right above line items - which tells the formula used to derive that particular line item would be really helpful.
Like for eg: The ROU asset line item is clubbed somewhere - which actually should be highlighted separately for easier interpretation.
Hope I could make my point clear.
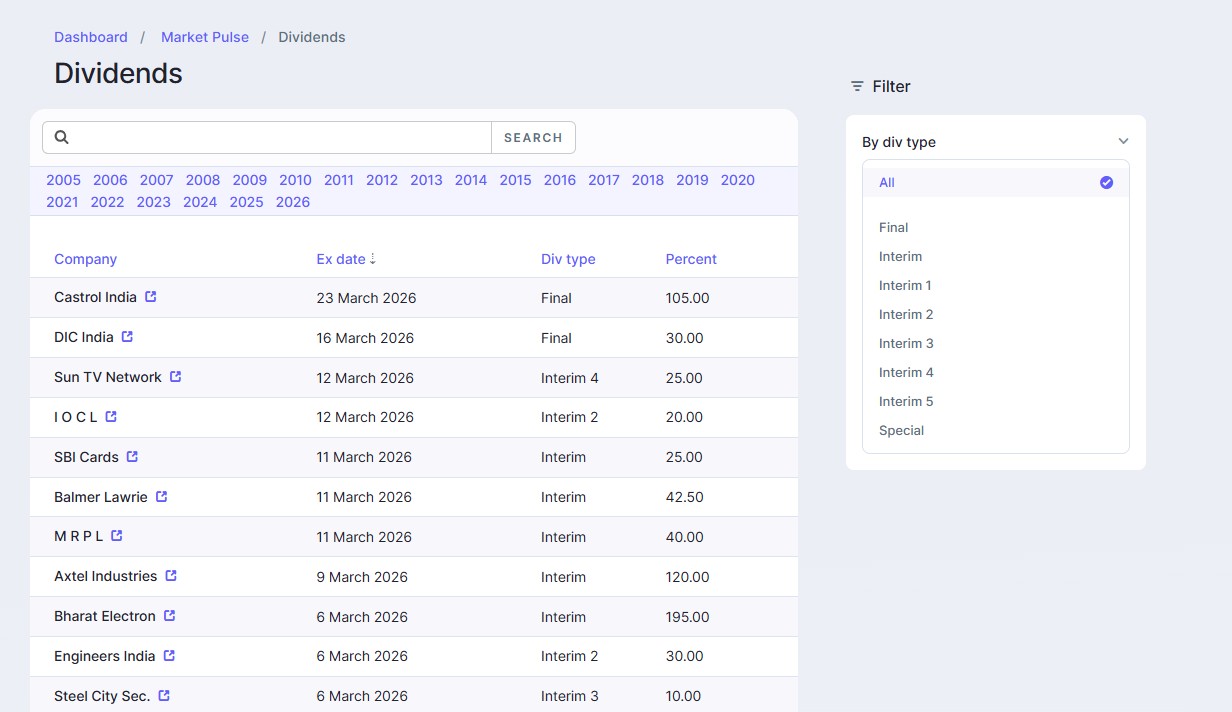
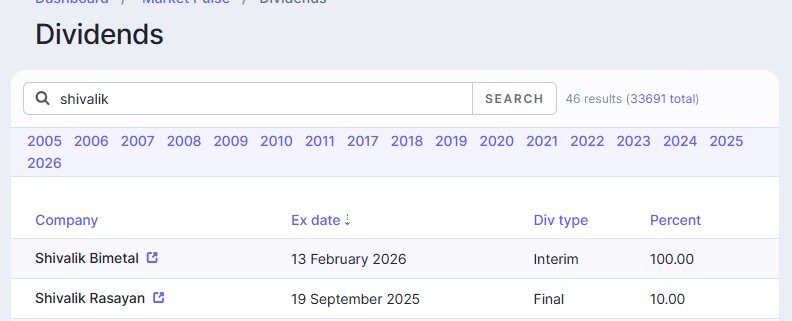
New Feature Addition Request : Watchlist filter for Dividends page
@kowshick_kk , @pratyushmittal Can we pls consider adding the watchlist filters on the dividend page.
Use Case: If one is having all portfolio stocks in one of the watchlists, one can easily view all dividends at one place easily.
Request the 2nd filter to be added here on the right.
The 2nd issue is varying Face Values of different stocks. Can we add 2 more columns here?
2nd column being Face Value = 2.0
and 3rd column a calculated field = Percentage(100%)X Face Value(2) = Dividend Amount (Rs 2/-)
Feature request: Delivery Volume Chart
@kowshick_kk @pratyushmittal
It would be very useful if Screener could allow users to plot delivery volume on charts, in addition to the existing trading volume. Currently, Screener provides the delivery percentage, but it would be helpful to also visualize the absolute delivery volume over time.
For long-term investors, delivery volume can offer additional insight into the quality of participation in price moves. A rise in price accompanied by increasing delivery volumes may indicate stronger conviction and accumulation, while price moves driven mostly by low delivery volumes may reflect short-term trading activity.
Since Screener already tracks and displays delivery %, computing and plotting delivery volume (Volume × Delivery %) should be relatively straightforward from the available data. Adding this as an optional overlay on the chart would make the platform even more useful for investors trying to distinguish between accumulation and short-term speculative activity.
Thank you.