Are you still facing the above issue? If so, could you please write to us at support@screener.in
Our team will review the issue and guide you further.
Are you still facing the above issue? If so, could you please write to us at support@screener.in
Our team will review the issue and guide you further.
Hi @kowshick_kk
Screener currently displays EBITDA margin by rounding it off to nearest integer which fabricates the real picture. If a company is improving margins by few basis points every year, that change gets hidden due to round off. Can you guys please look into it? I am sure a lot of investors will have the same concern.
Hi @kowshick_kk
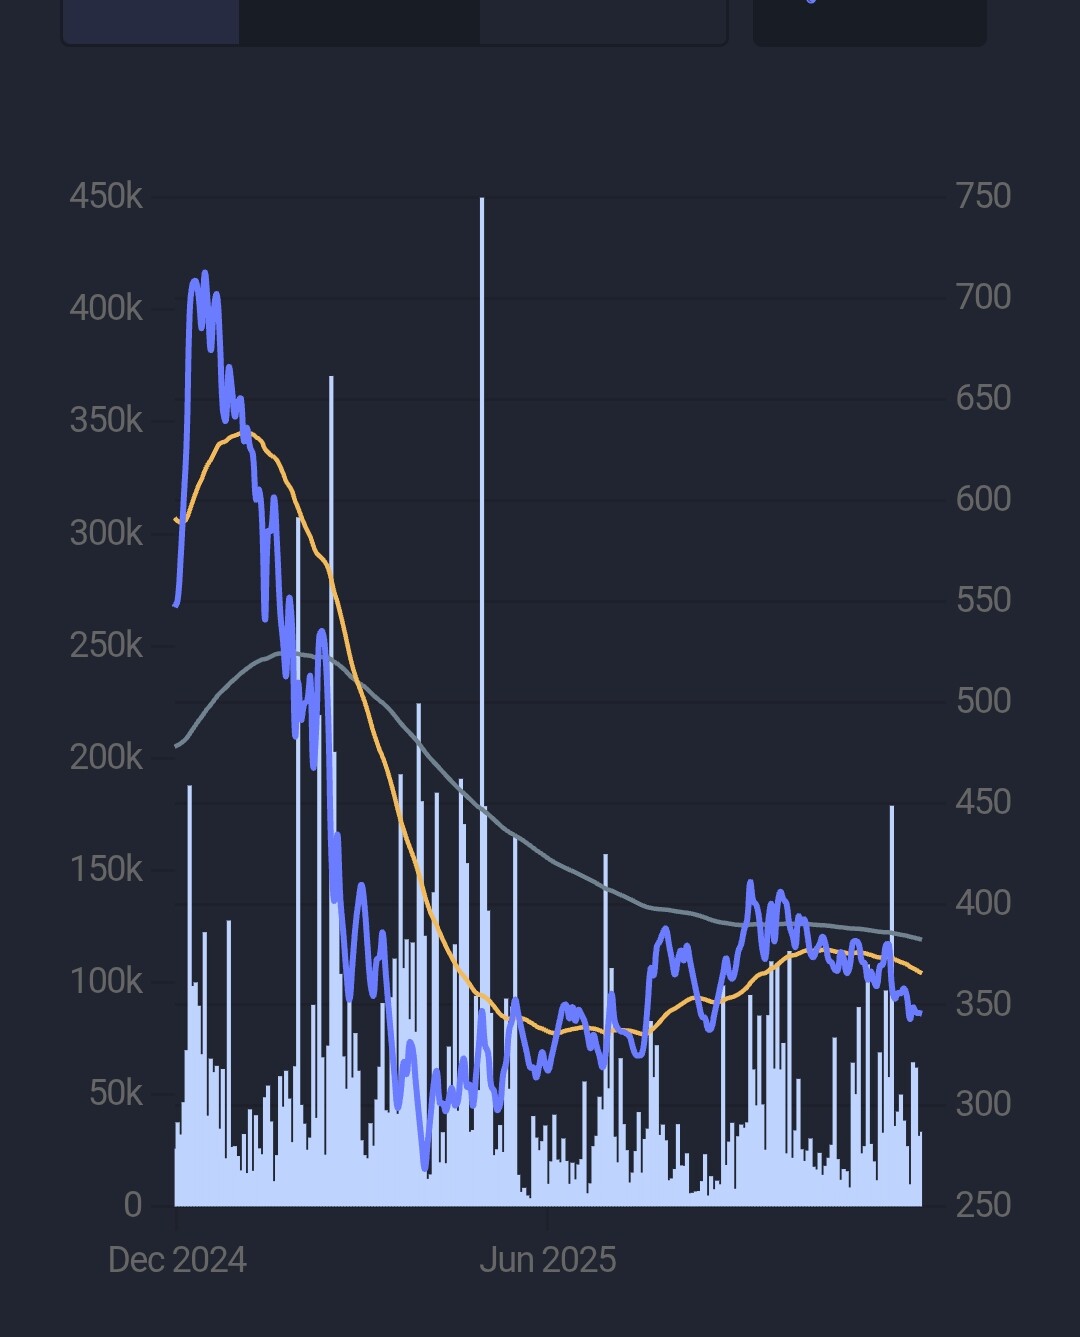
Can you please look in the volume colour in dark mode.. the colour is too bright and it is also not possible to sw off volume display as it is not getting saved.. please look below.. It is almost impossible to see the price line
Hi Santosh,
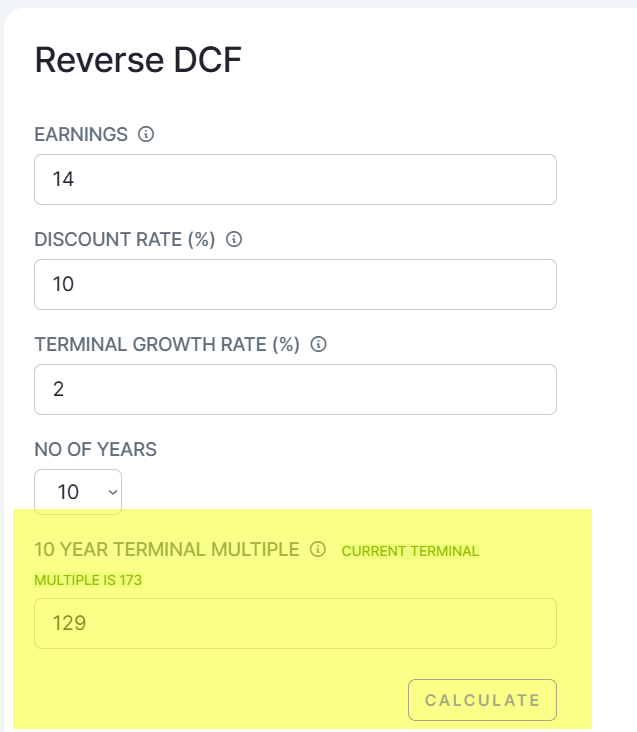
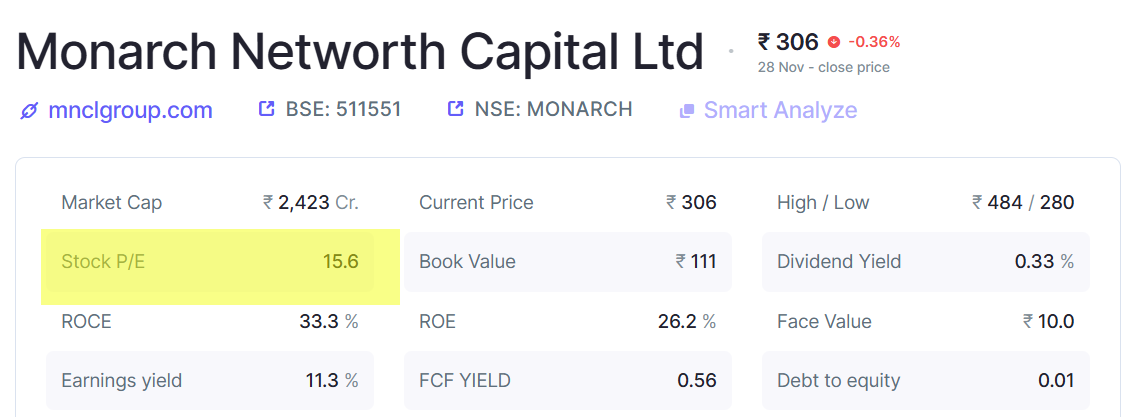
Thank you for creating this wonderful tool Screener Smart Extension. Its a great tool. I had query, but I could not find a dedicated page for Screener Smart Extension, so I am asking it here. I noticed with Monarch Networth the PE shown by the Screener Smart Extension does not match the PE shown in Screener.in. I tried some some other companies too, they all showed different figures from screener site. Wanted to understand the reason for the miss matches. Once again thank you for creating a great tool.
Here the PE as reflected in the extension.
Here’s the PE as per the screen.in
Hi Sir, Thanks for sharing this. I have reported the same to our team and we will try to enhance the same in the coming days.
Hi @kowshick_kk
One of few difficult part retail investors face is verifying quality of management and their behaviour towards retail investors. Though this part cannot be completely derived from numbers. Some critical parts can be. Can you incorporate these indicators like few mentioned below:
@ayushmit Sir, Any possibility to write query on watch list…I dont want to run query on whole universe…i want to run query on my watch list
@kowshick_kk I noticed a company i track Wanbury had Q2 results while back and on track release Q3 results. However, screener do not have Q2 results. Would some one look and update Q2 results ?
Hi, This is on our to-do lists. Similar to Industry filter option on the Screen Results page, we will provide an option for Watchlist Filter in the coming days.
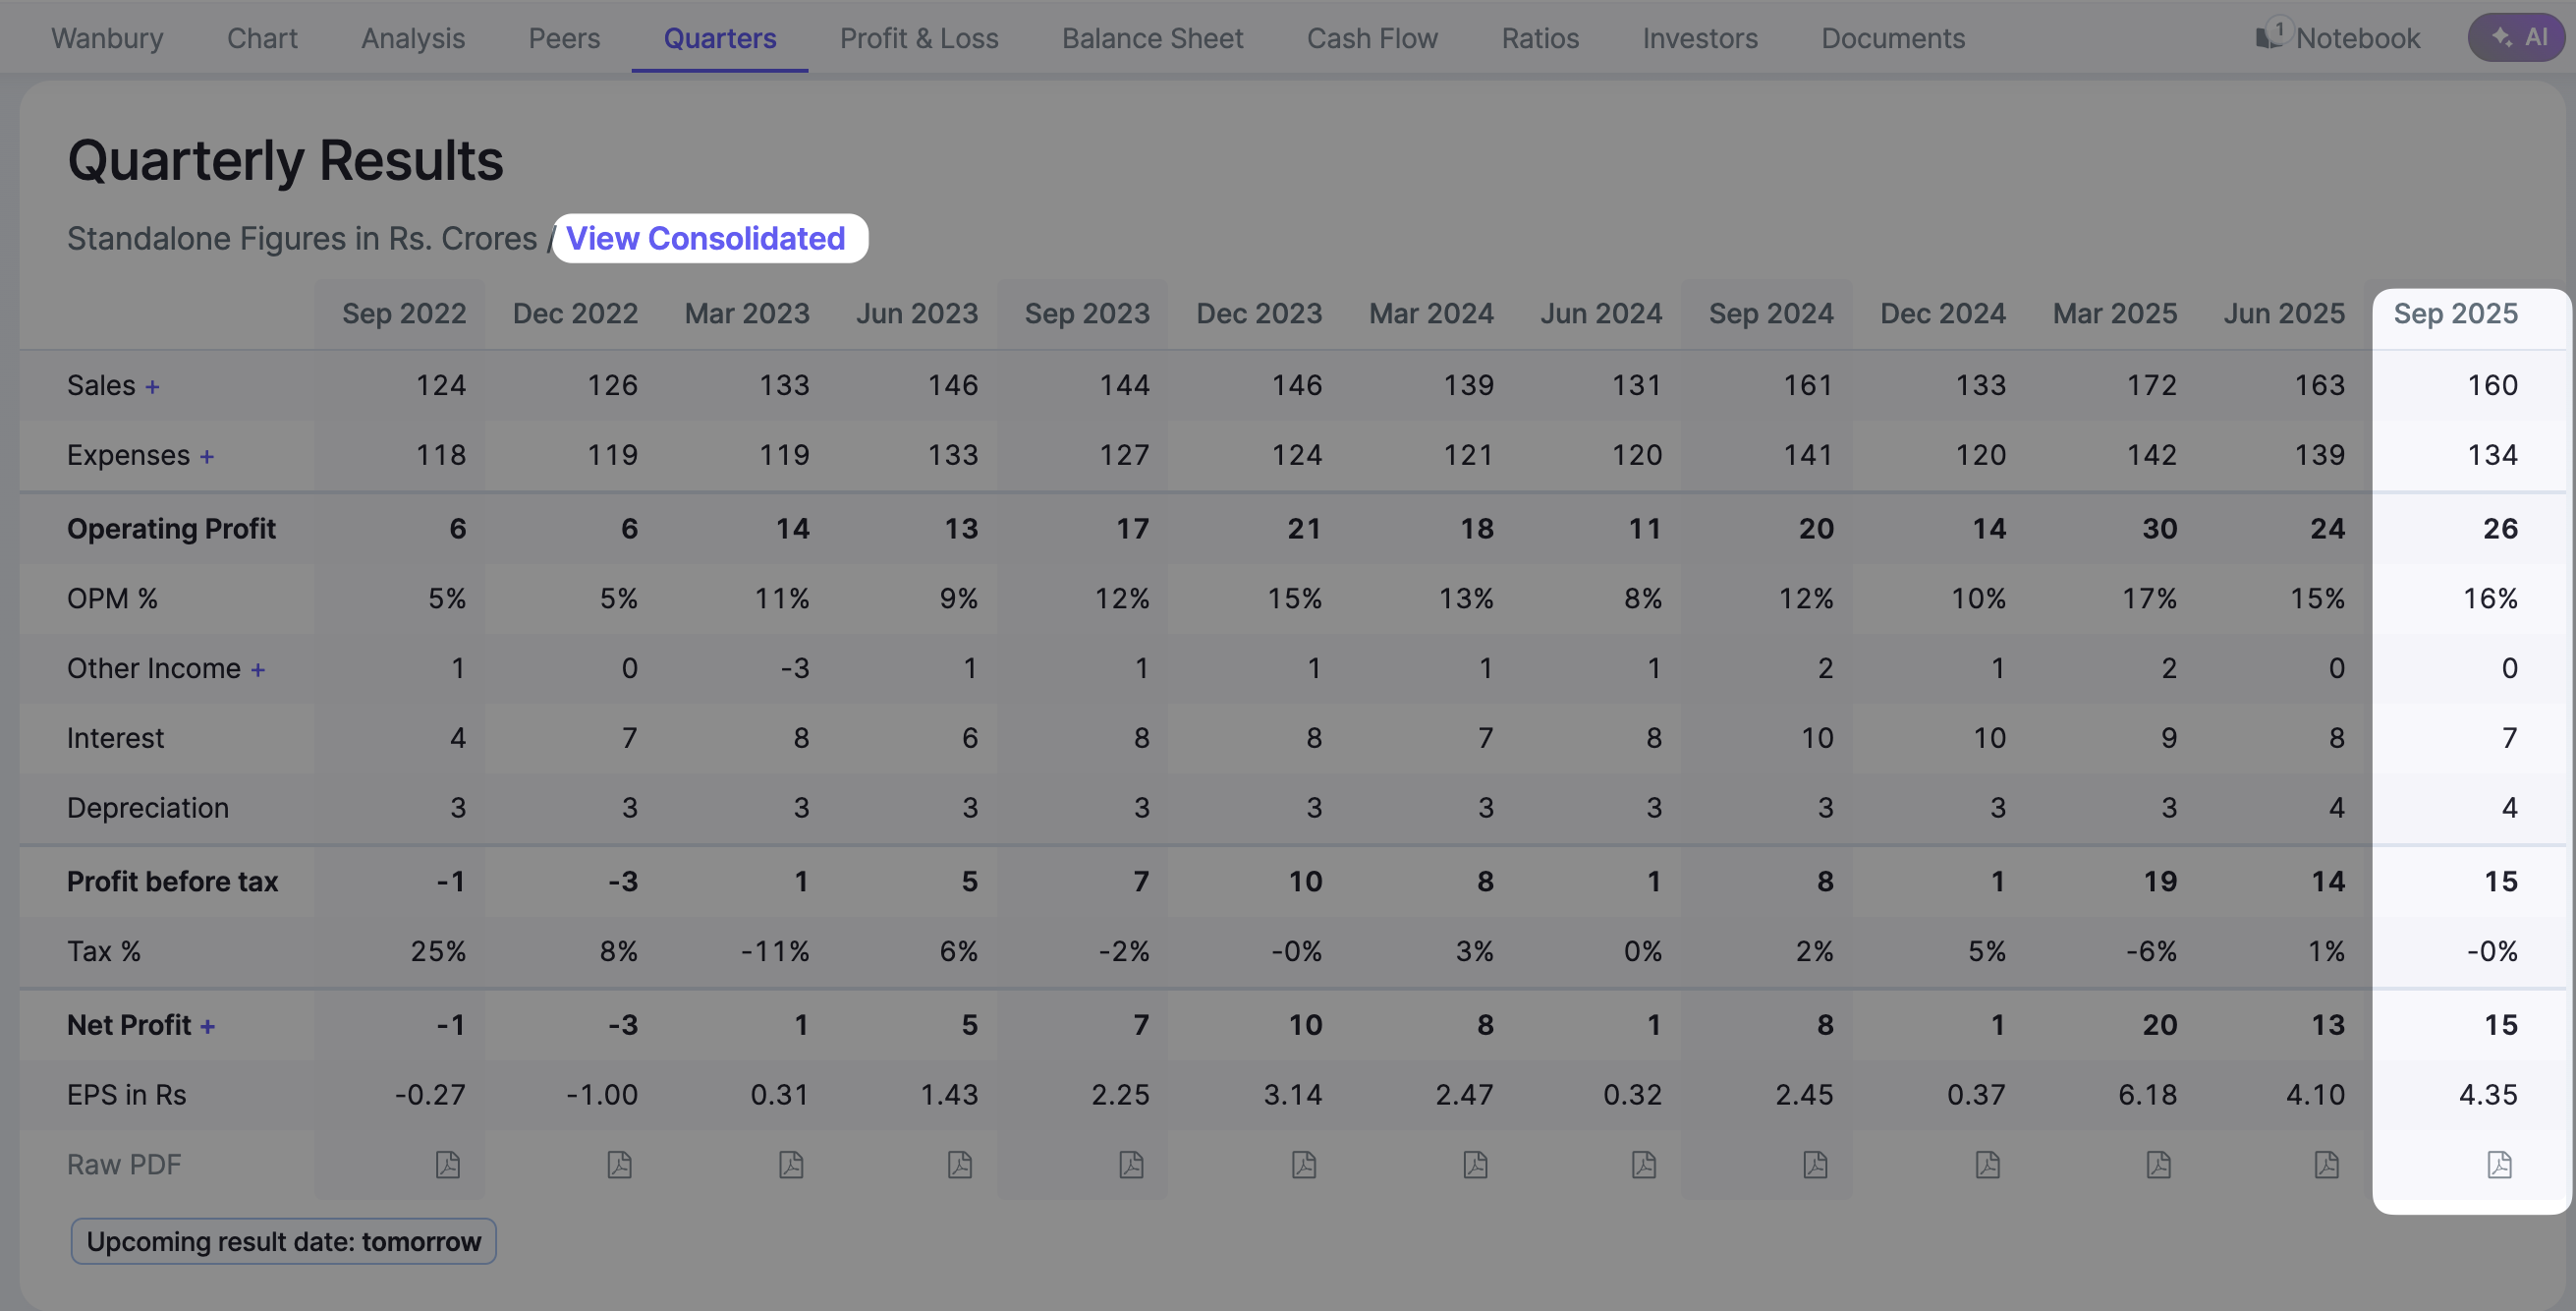
Hi @james_kerala The Company Wanbury has published only its Standalone numbers for for the Quarter ended Sep 2025 and you can verify the same here: https://www.bseindia.com/xml-data/corpfiling/AttachHis/48ccd51b-46ec-4d2b-914c-345680bb6a91.pdf
We have updated the standalone numbers on the portal. You can toggle between the standalone and consolidated numbers by clicking the ‘‘View’’ option as shown in the below screenshot.