Did you divide the ratio into cash, debt and contingent liabilities?
I tried and couldn’t come up with the exact number either.
Did you divide the ratio into cash, debt and contingent liabilities?
I tried and couldn’t come up with the exact number either.
Why don’t we incorporate a more advanced chart systems like in trading view will be more helpful to have a look at all fundamentals and technicals in the same place ? Would love it
And thank you screener team for all the gl great effort you guys keep putting into the system
@pratyushmittal @ayushmit Thank you for the excellent tool in the hands of common small investors for free.
I like to request to extend a shareholding trends over YoY basis atleast to ten years like many other data, even without detailed drill down. It would help to see how promoters or institutions handled the company in terms of long term holding. The current 3 year period gives only a short term view on share holding patterns.
Thank you sirs !
Is there a way to check for the price drop is a multi year 52 week low? CMP is not only below the current 52 week low but also lower than X number of years of ago?
Thanks for the latest update that lets us get front page feeds for all watchlists. Earlier you got feeds for only core watchlist.
Hi,
How can i import my tradingview watchlist into screener?
Hello team, I cant thank you enough for making Screener, makes life a lot easier and studying stocks a joy!
Do you have plans to add US stocks?
Hi @ayushmit @pratyushmittal
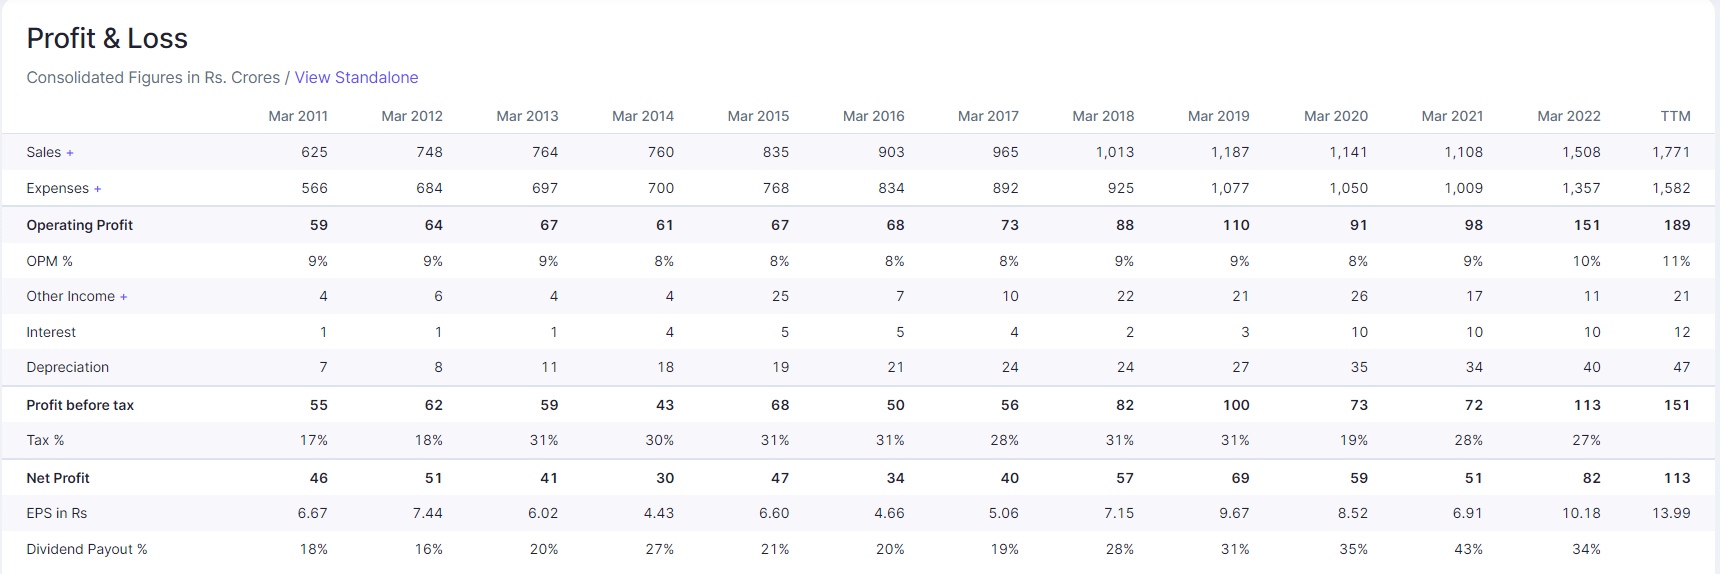
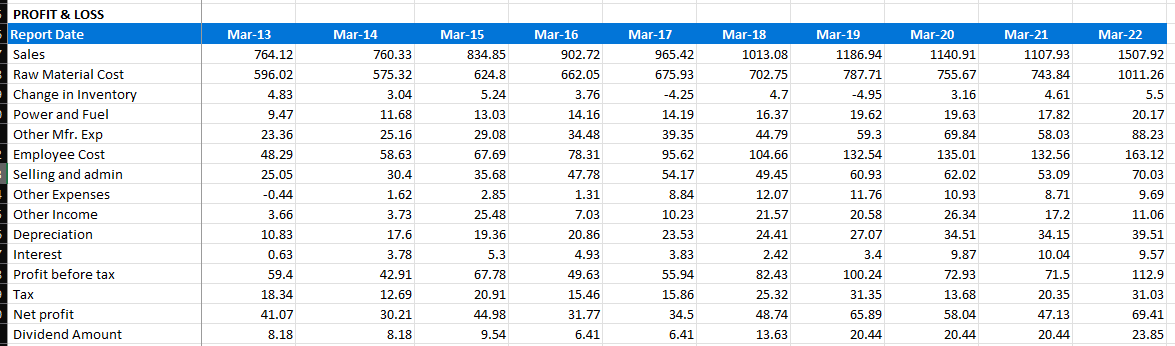
downloaded the data for Lumax Auto, there seems to be some discrepancy in the computations.
When looking at the consol numbers, the P&L shows 82 as the Net Profit
To reconcile the numbers, i manually added up the numbers, it seems there is some issue with the tax computation, in the excel the PBT is 112.9, Tax is 31, therefore PAT = 82 which matches the screener web numbers, but in excel there seems to be an issue.
I am also using screener.in regularly. I found very simple to use for stock screening from simple to complex criteria using many different parameters. I really appreciate the team @ screener.in for making simple, but more effective product.
Hi Screener.in Team
It would be very helpful to see the timestamp of the the annoucements, in the “FEED” section.
Just like BSE india’s detailed corporate annouctment shows it as “Exchange Disseminated Time”.
Thanks
A great suggestion. Also request date (probably with a time stamp) on results when look at recent results which will give an idea if results came during or after market hours.
An UX suggestion:
The “Corporate Actions” button is more appropriate at Announcements section (under Documents) as that is where the user is at to check the announcements which include corporate actions.
This will make this feature more easily discoverable than the current place at Balance Sheet.
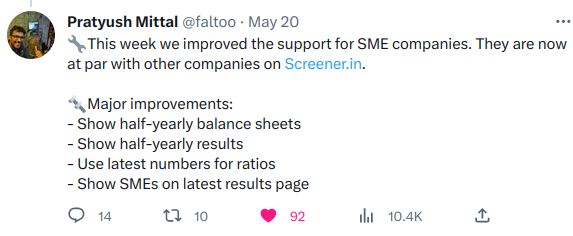
Good News. Thank you @pratyushmittal @ayushmit
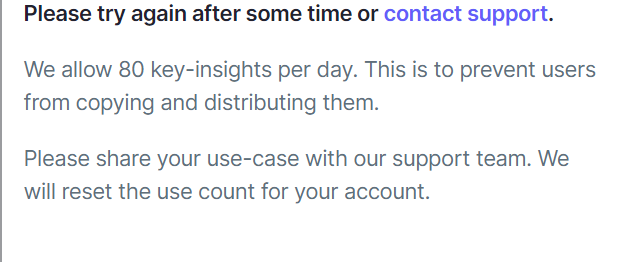
Limiting the view is started for even paid custmoer… Not seems to be good
Hi Screener Team,
I notice that for some companies the default page which opens up shows Consolidated financials and for some others it shows Standalone. Here are some examples:
Consolidated - Metro Brands / Indian Hotels / PI Industries
Standalone - Stylam Industries / Kirloskar Ferrous / Shivalik Bimetal
How does Screener decide what should be the default, and has there been any change to this logic lately? I was under the impression that default is always Consolidated but that is not the case. Maybe I did not observe carefully earlier. Thanks.
Is anyone from Screener team watching this thread? People are posting queries/suggestions but don’t see any replies from Screener.
Hi @ayushmit @pratyushmittal -
Recently, I observed that screener does not show the B/S data of FY23 for all the banks. For instance, City Union Bank Ltd financial results and price chart - Screener. Any specific reason or just needs a magic touch?
Best Wishes,
Surender
Dear @ayushmit @pratyushmittal and others,
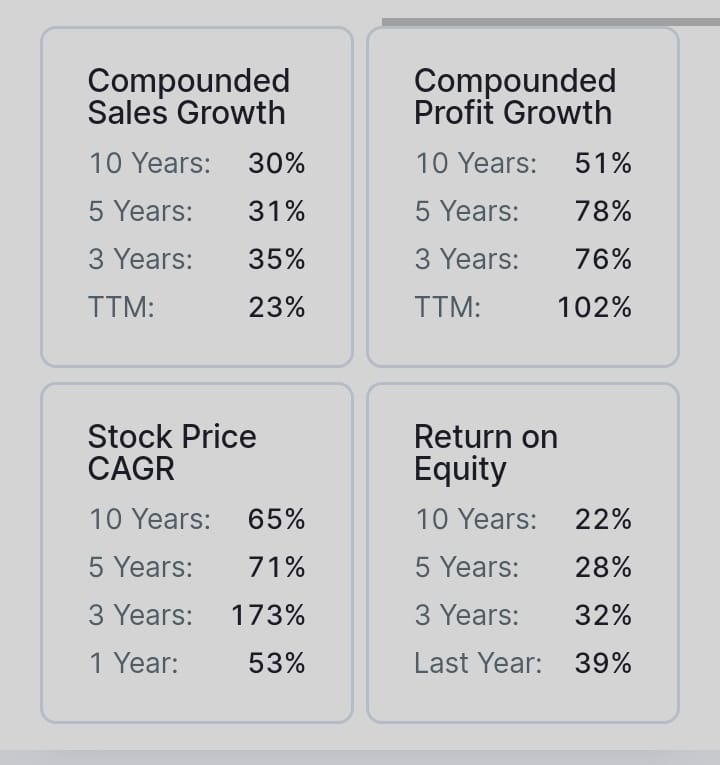
Is there a way to write a query to see stocks growth cagr in 01 year, 3 year, 5 year etc. Coupled with profit and sales cagr it will give a good query where stock growth is lagging sales/profit growth. I can see them in summary when I look for individual names., but not sure how to search for such names.
Thank you for excellent tool in the hands of retail investors
@pratyushmittal @ayushmit @Parthgarg If you guys start any us financial screener i will be the first person to subscribe even if it is a paid subscription
Please do launch them