Scalability Thinking - Mental Models

Making bold to share another ambitious dive into practical investing wisdom !

SCALABILITY THINKING #1: A little preamble at first
This quest has been with me sort of from January 2021 - when I first started bugging my Mentors - you know who - Prof Bakshi, Mr D (Dnyanesh), Manish Gandhi and others - let’s solve this scalability bug I have caught - Is there a way we can SPOT with a little pre-science - the more likely candidates that will say scale 10x in 10 years or come close to that :slight_smile:

I was deeply (internally) convinced and excited about this exercise. But alas failed to transfer the excitement totally despite many attempts - I was so convinced I can (and will sub-parameterise) most things to think about …ha ha. My Mentors, without exception raised their hands - this is too tough - Donald.

Stock Story Summary Excel TemplateV4.xlsx (20.9 KB)

Those who want to checkout my valiant attempts :grinning: have a look at above.
Fair warning! Only the deep-dive-types might have some use for it :slight_smile:. This is from my active experience set though - so I still swear by it !!

30 Likes

SCALABILITY THINKING #2: Cracking the Code
After a year of struggling with how to take things forward - Collaboratively - suddenly I just knew how to transfer my excitement!

I think I was with another long time Mentor Sandeep Kothari (had met him first in 2010 Mumbai at his Fidelity office)> i had sought time from saying Hey Sandeep - why dont we just talk on how YOU THINK about Scalability - what are your best examples - what worked as assessed initially - and what didn’t/couldn’t?

And lo and behold! - as luck would have it - we were on the same page straightaway. We started talking about the Sweet Spot being 80-100 Cr Annual PAT Levels. That 100-200 Cr PAT transition/migration happens enough times and quite easily. 200-500 Cr transition is another beast though, but very few businesses actually cross 1000 or 2000 Cr PAT levels.

At the same time there is a TCS we know at 44K annual PAT levels, an Infosys at 20K PAt levels or a L&T Mindtree at 3.5K PAT levels. IT and Financials are in a different space. Whereas from my own examples I knew of only PI Industries that could scale beyond 1200 Cr progressively from ~100 Cr (2012). An Avanti Feeds is still struggling to cross 500 Cr (actually scaled down much) since first coming within touching distance of that in 2018 or an Ajanta Pharma struggling at 600-700 Cr annual profitability despite probably being among the fastest to shoot past 500 Cr within 3 years of crossing 200 Cr annualPAT levels. A common pattern within just the 3 - have/had delivered exemplary MarketCap multiples between 50-85x. There are many others - some more exemplary. and some lesser - but still very very spectacular.

If we spend a little time now on the above picture - it tells many a tale - that sets the Context for Scalability #3 post - do we/can we identify giveaway patterns??

28 Likes

SCALABILITY THINKING #3 : Easy-Peasy in Hindsight
(most would counter legitimately), but can’t we be a little more prescient; a little more sure-footed, in our ability to Foresee !!

And this is where the whole conversations with my Mentors started getting REAL and INTERESTING. Meaning - I was able to transfer my excitement - almost everyone was getting it (as to where I was headed) - when I supplied the Commentary with the above picture. What was that Commentary.

Sure-Footed Patterns:
(All Senior Practitioners/Fund Managers I have interacted based on #2 agree there is a probable method to the madness lying there - for us to get a firmer grip on; at least 3 have offered to do more crunching and slicing/dicing of the data set of say last 15 years; and in the coming days will hopefully ADD more MEAT to this (sort of) intuitive discussion flow

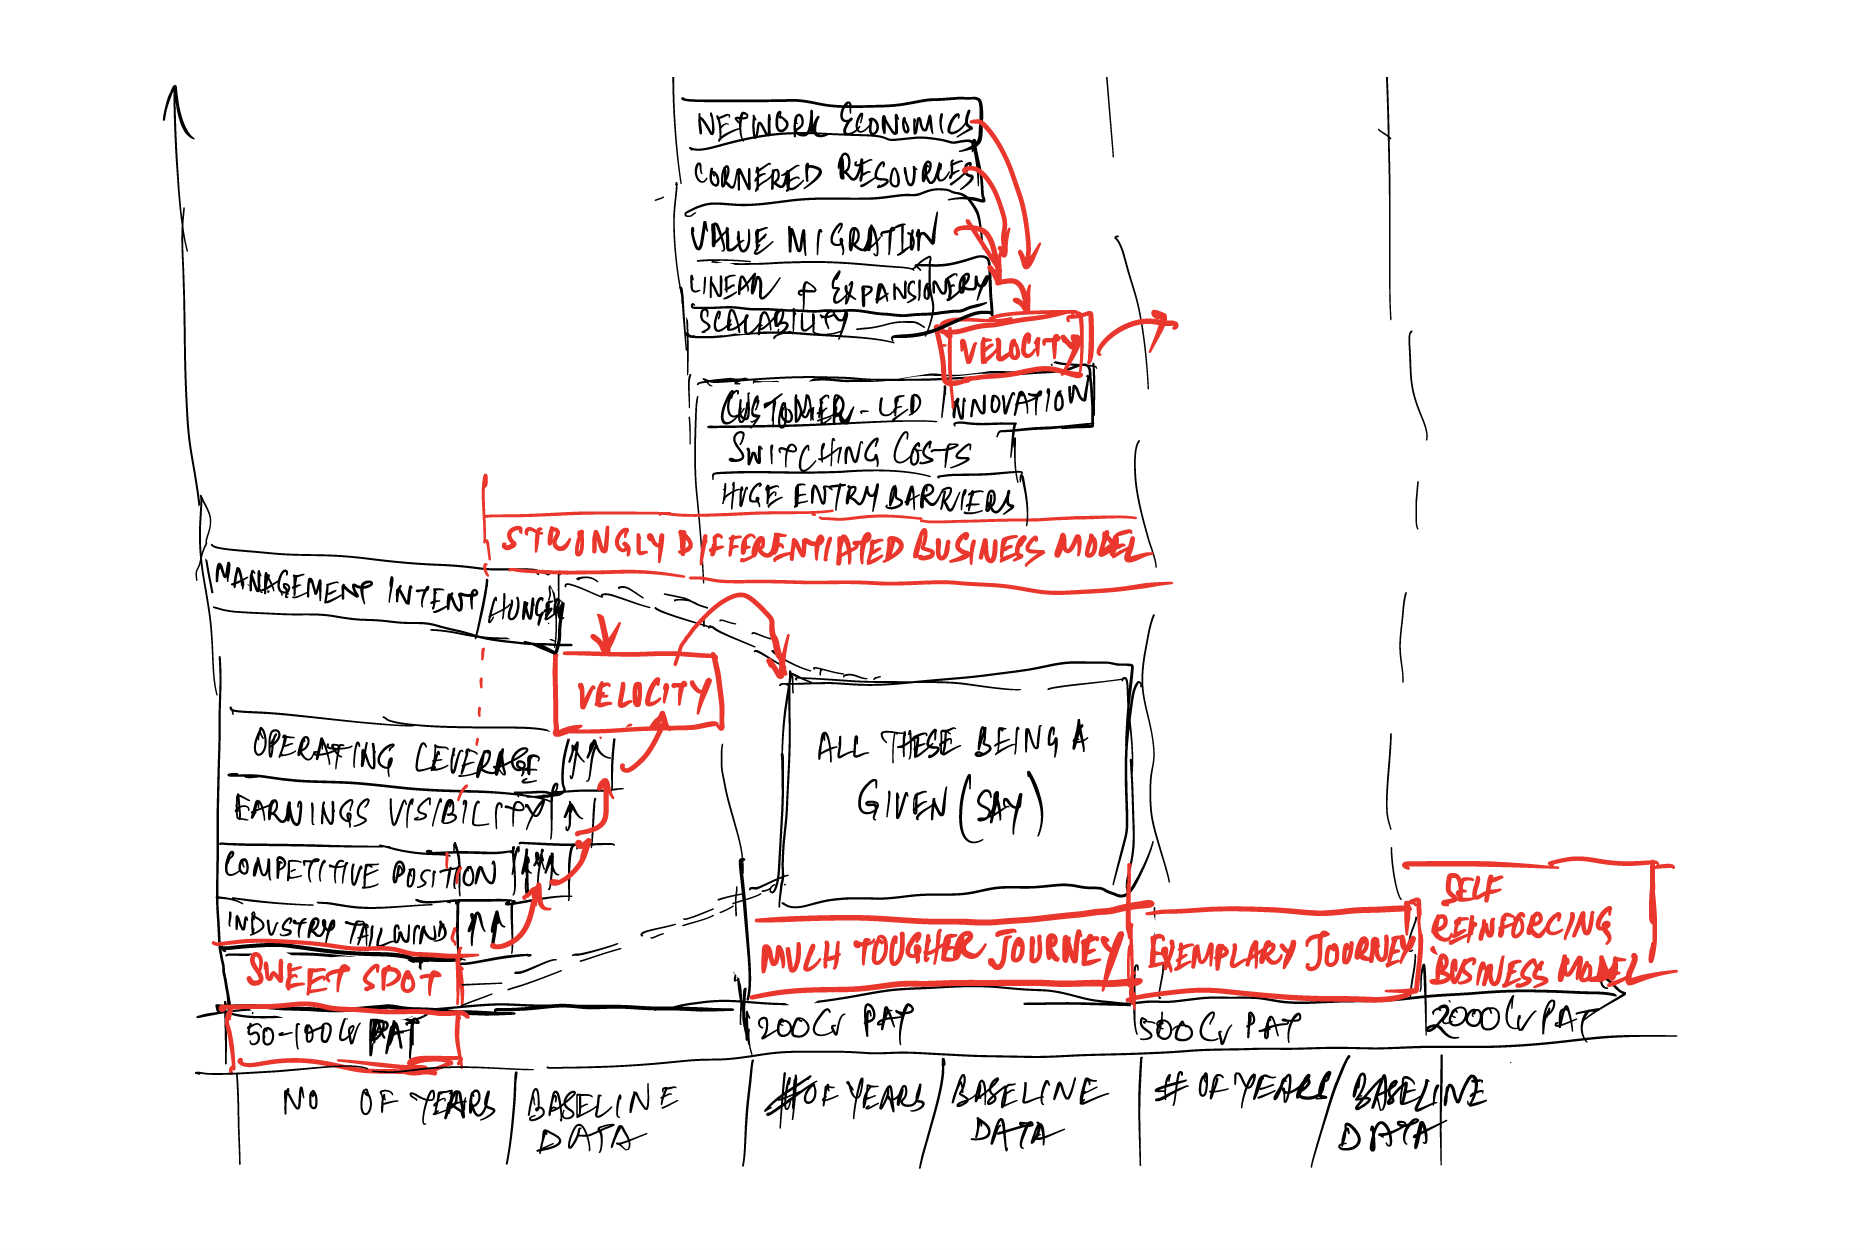
All things being equal - let’s say 5 businesses have passed my (our) thresholds, are there parameters that SWING THE NEEDLE the MOST and this give me a better handle on investment decision-making/allocations strategy?

We now bet, there is (and in this pre-set order, too perhaps) (Sticking our necks out again :slight_smile: )

  1. If there is strong Industry Tailwind, AND
  2. The business is improving its Competitive Position (gaining market share), AND
  3. There is evidence of Operating Leverage at Play (coming in), AND
  4. We have a great sense of Management INTENT/HUNGER (where do they want to take the business), AND
  5. We can clearly see Value Migration happening within 2-3 years
  6. No of variables that can go wrong

More often than NOT (again given all things being equal- all selected business passing all/most of our thresholds) the business that scores higher (qualitatively and quantitatively) on these, the ODDS of success are higher.

We hope to be able expand on these with combined collaborative power, as we delve more through our own example sets. Each case will be different perhaps. Every Industry like say IT or Finance will bring its own nuances; Processing/Manufacturing bring on a different set? A multiplicity fo factors at play, and we make bold to come back to you with more simple, powerful and abstracted patterns as the above 5 that in our intuitive understanding - swings the needle the most!

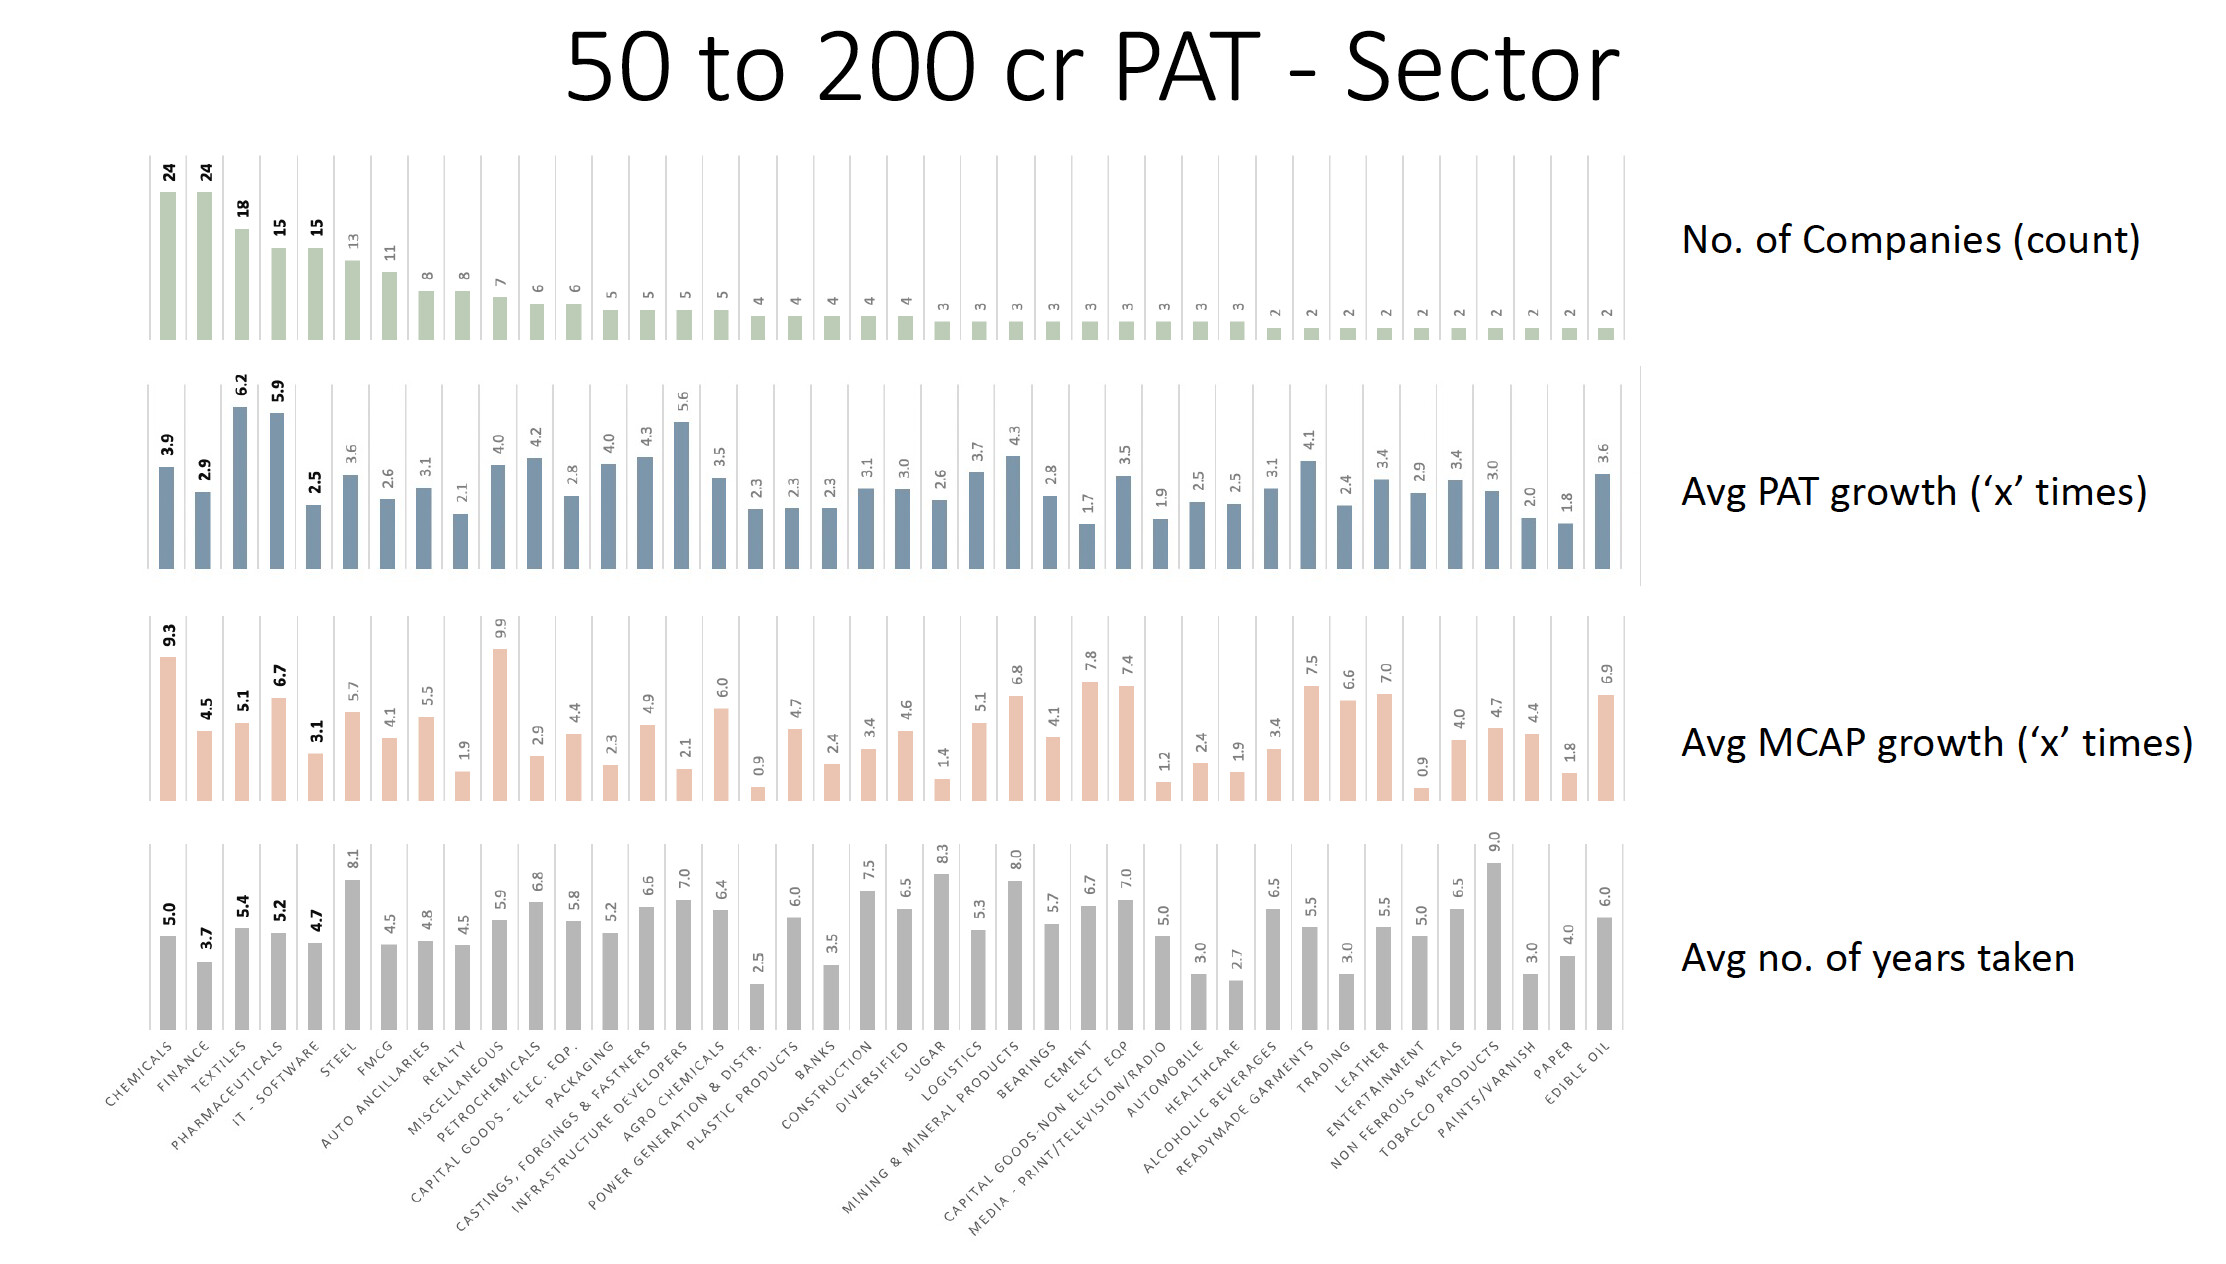
As we progress to slicing and dicing and playing with the rich data-set, we should find that
a) Scaling up from 50-100-200 Cr is far easier
b) #No of businesses crossing these thresholds will be larger by far, than
c) 200-500 Cr is another beast altogether - tougher and many more factors probably play definitive role
d) Management INTENT is probably V Important from here on (probably most decisive factor?)
e) Needless to say higher PAT levels from 500 Cr to 1000 to 2000 Cr gets tougher and tougher and the numbers shrink too

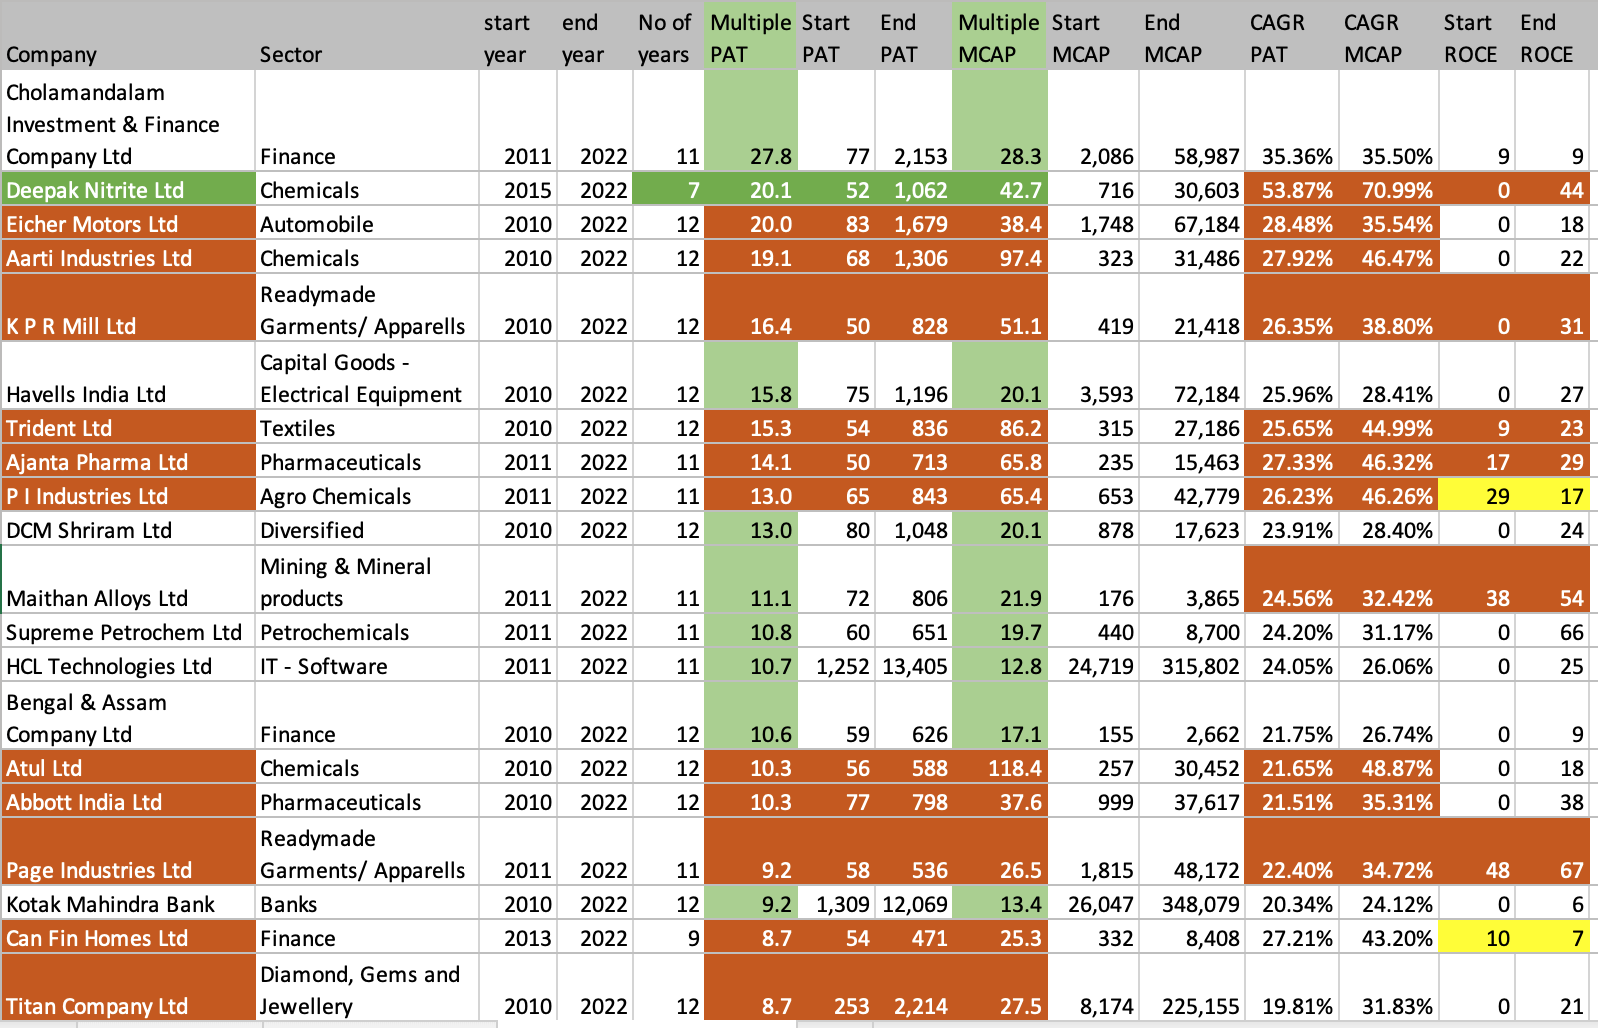
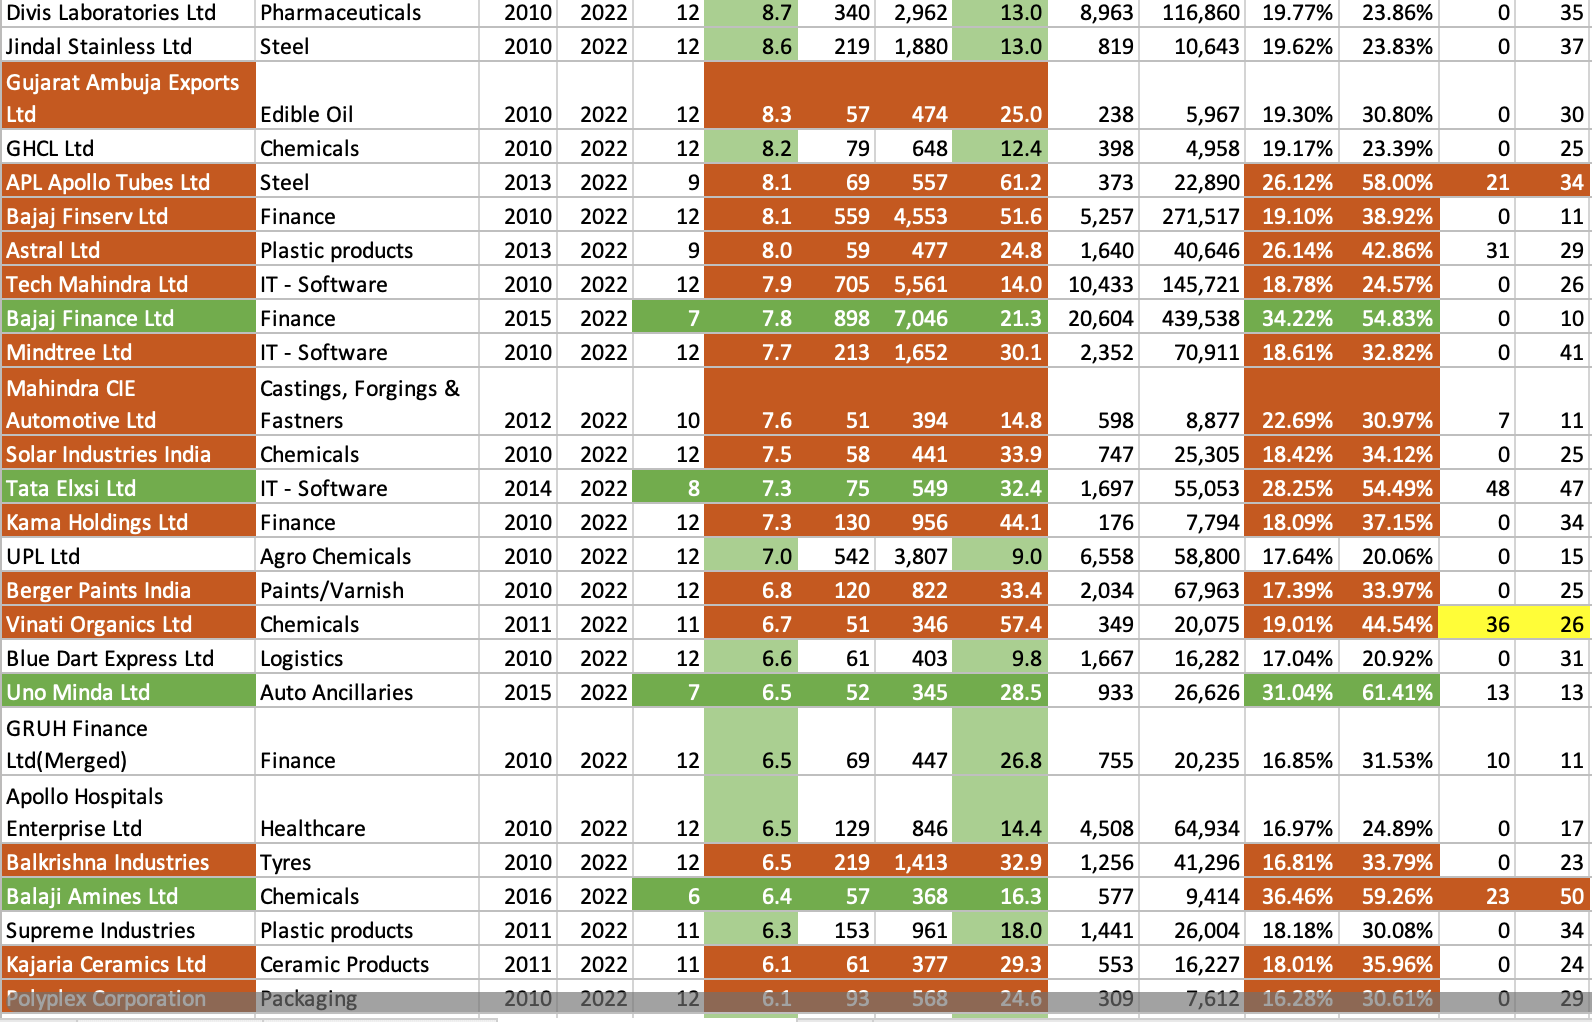
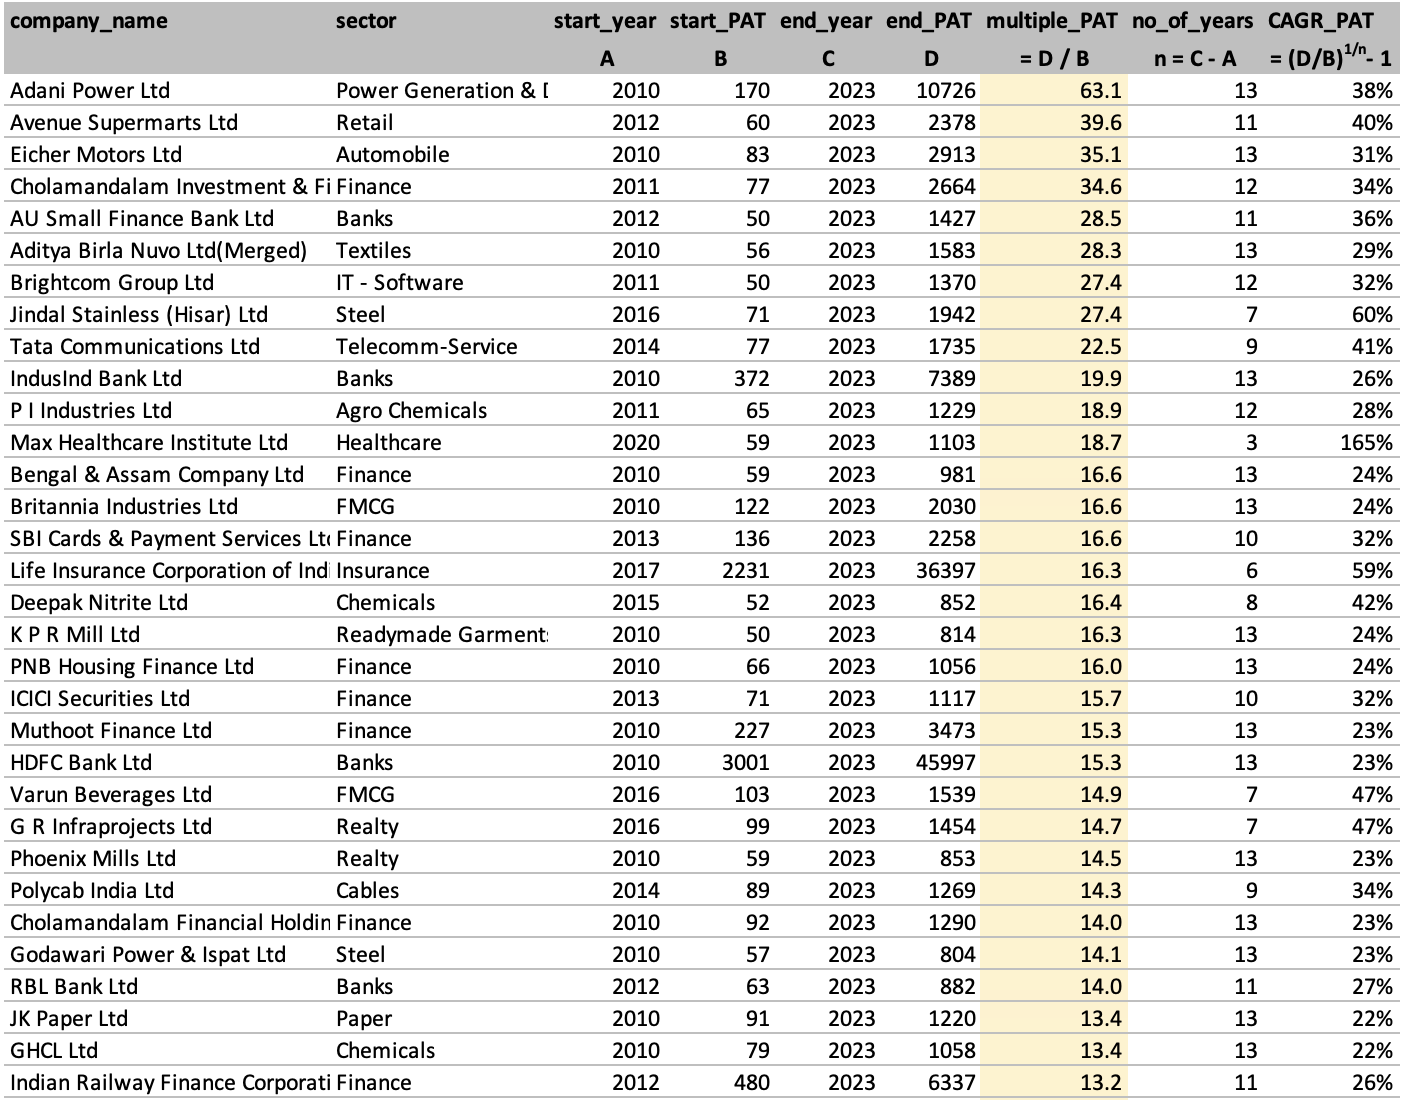
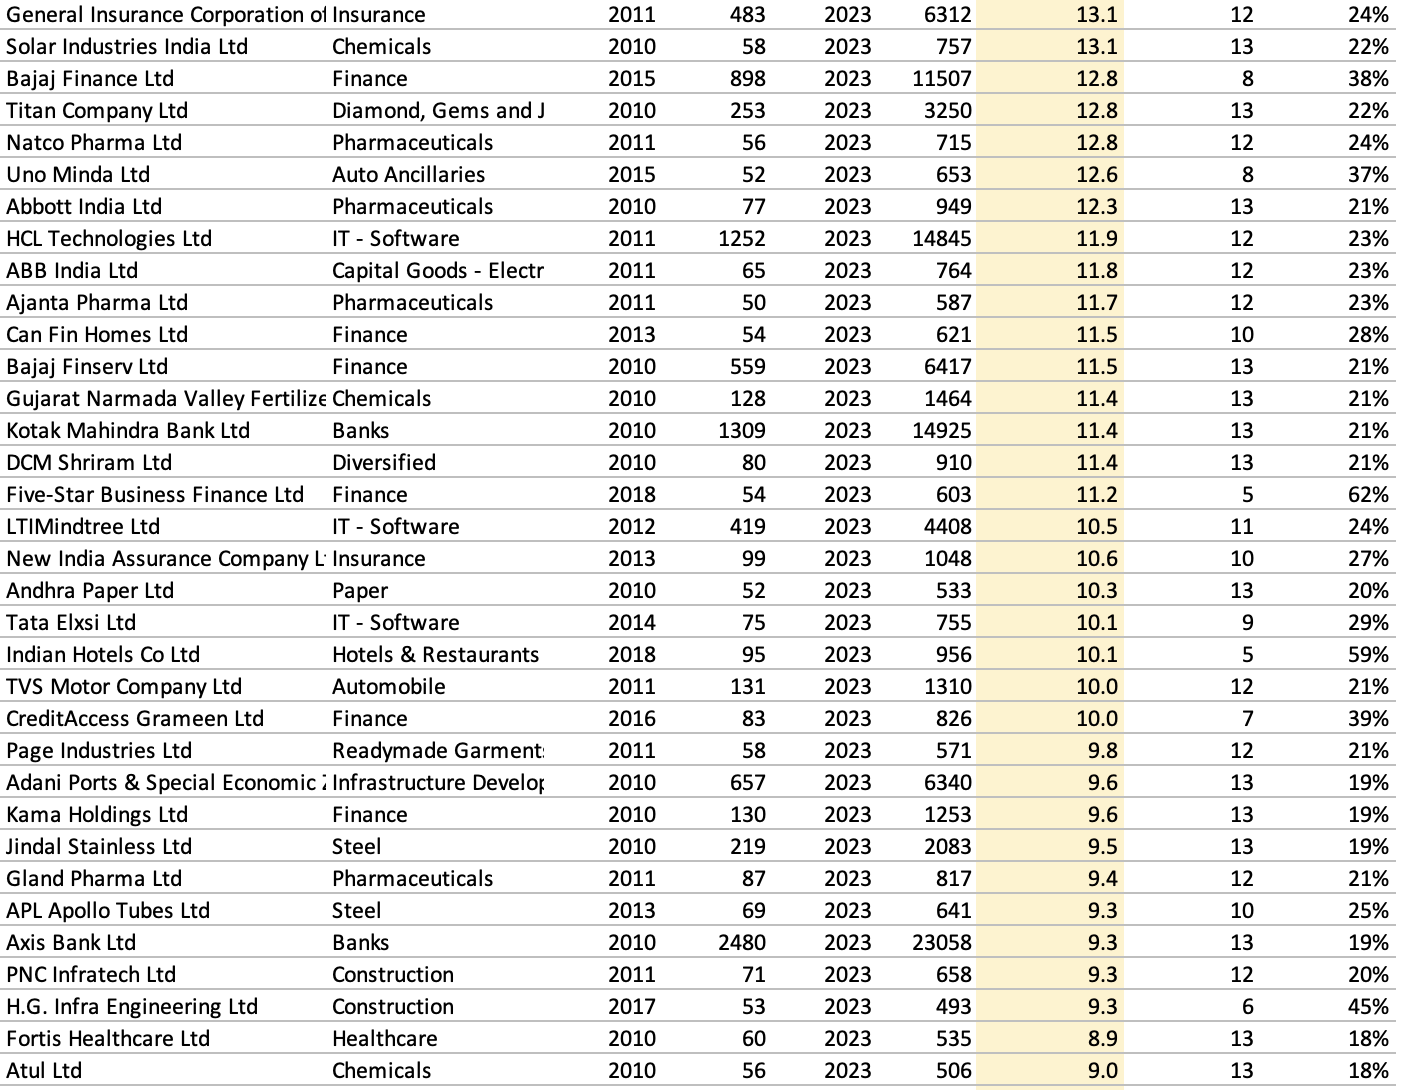
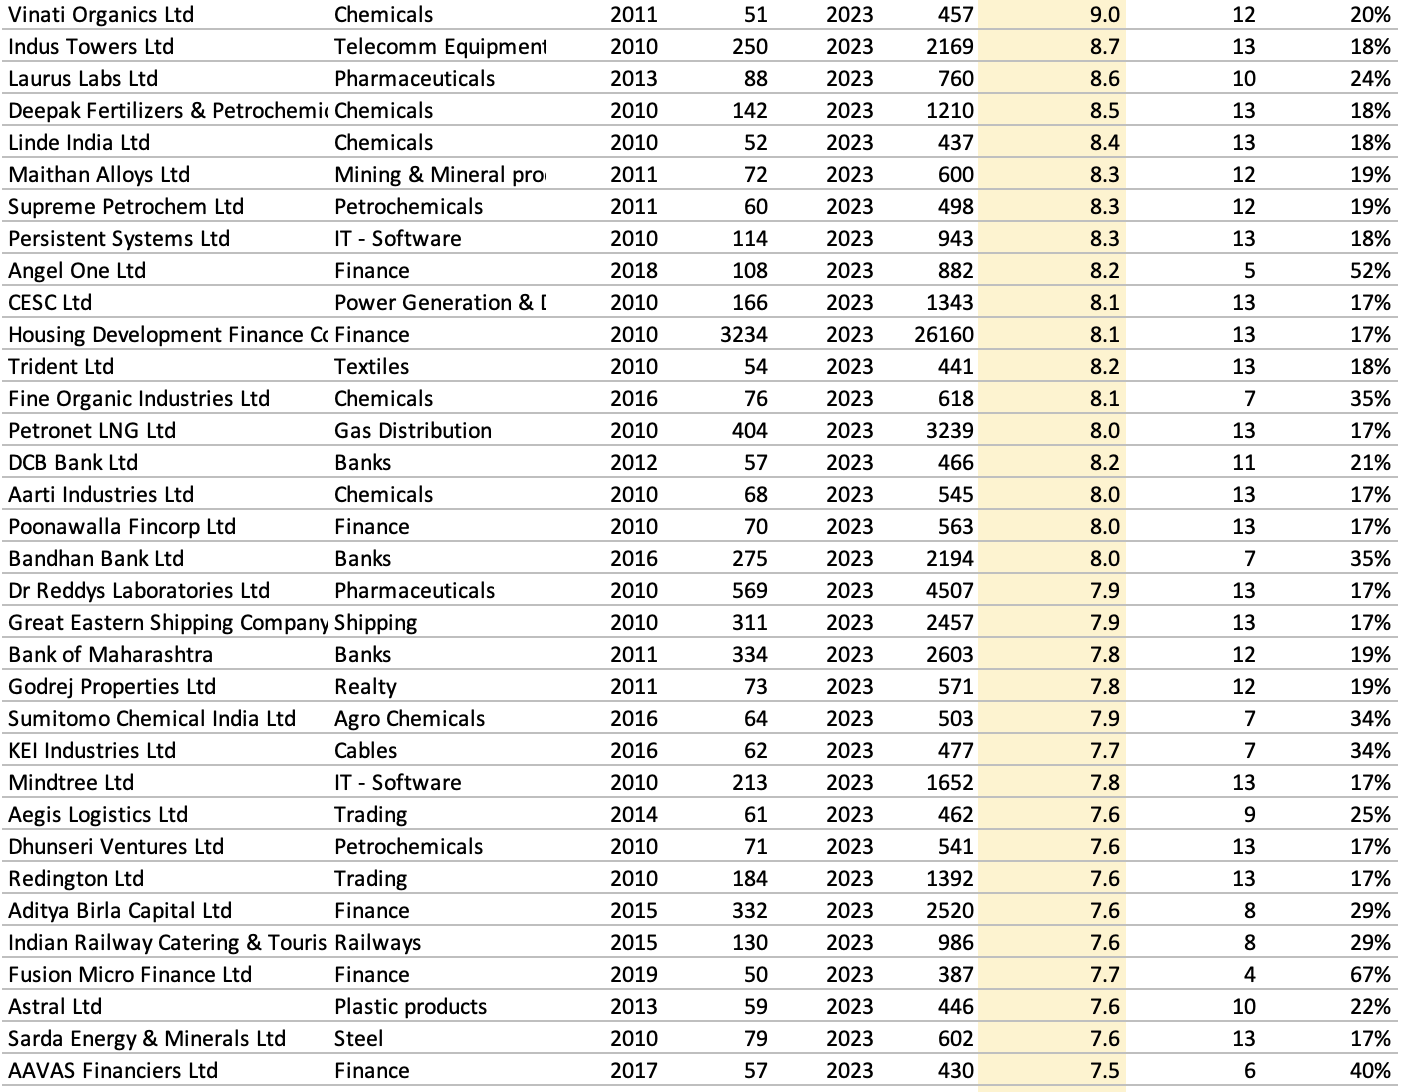
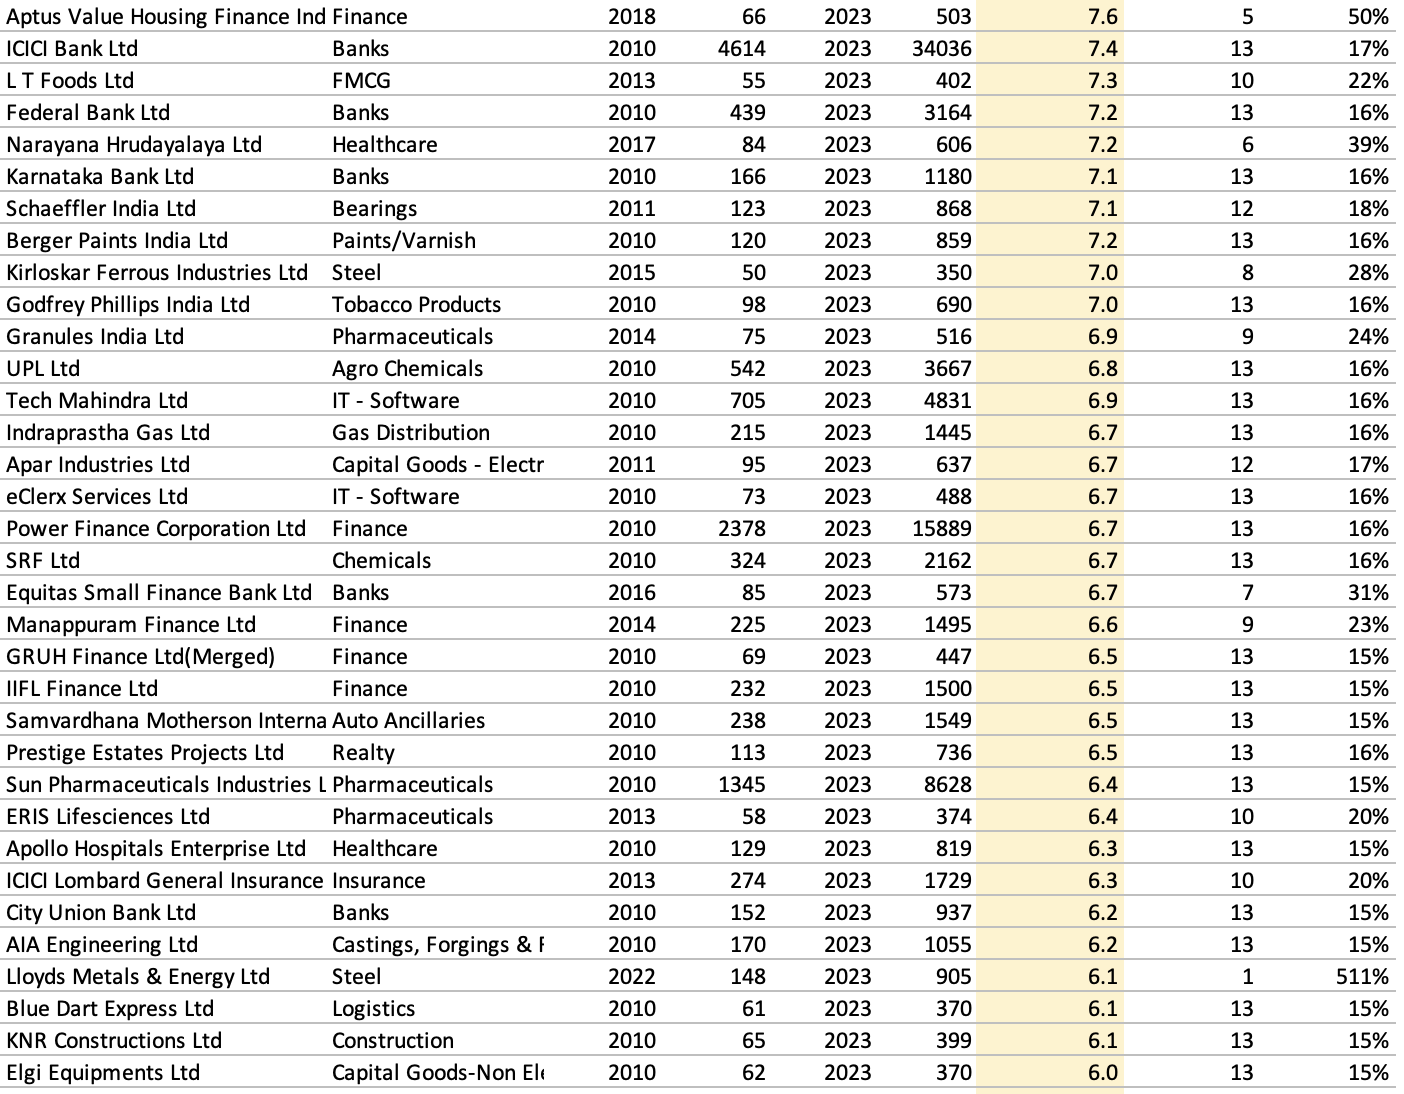
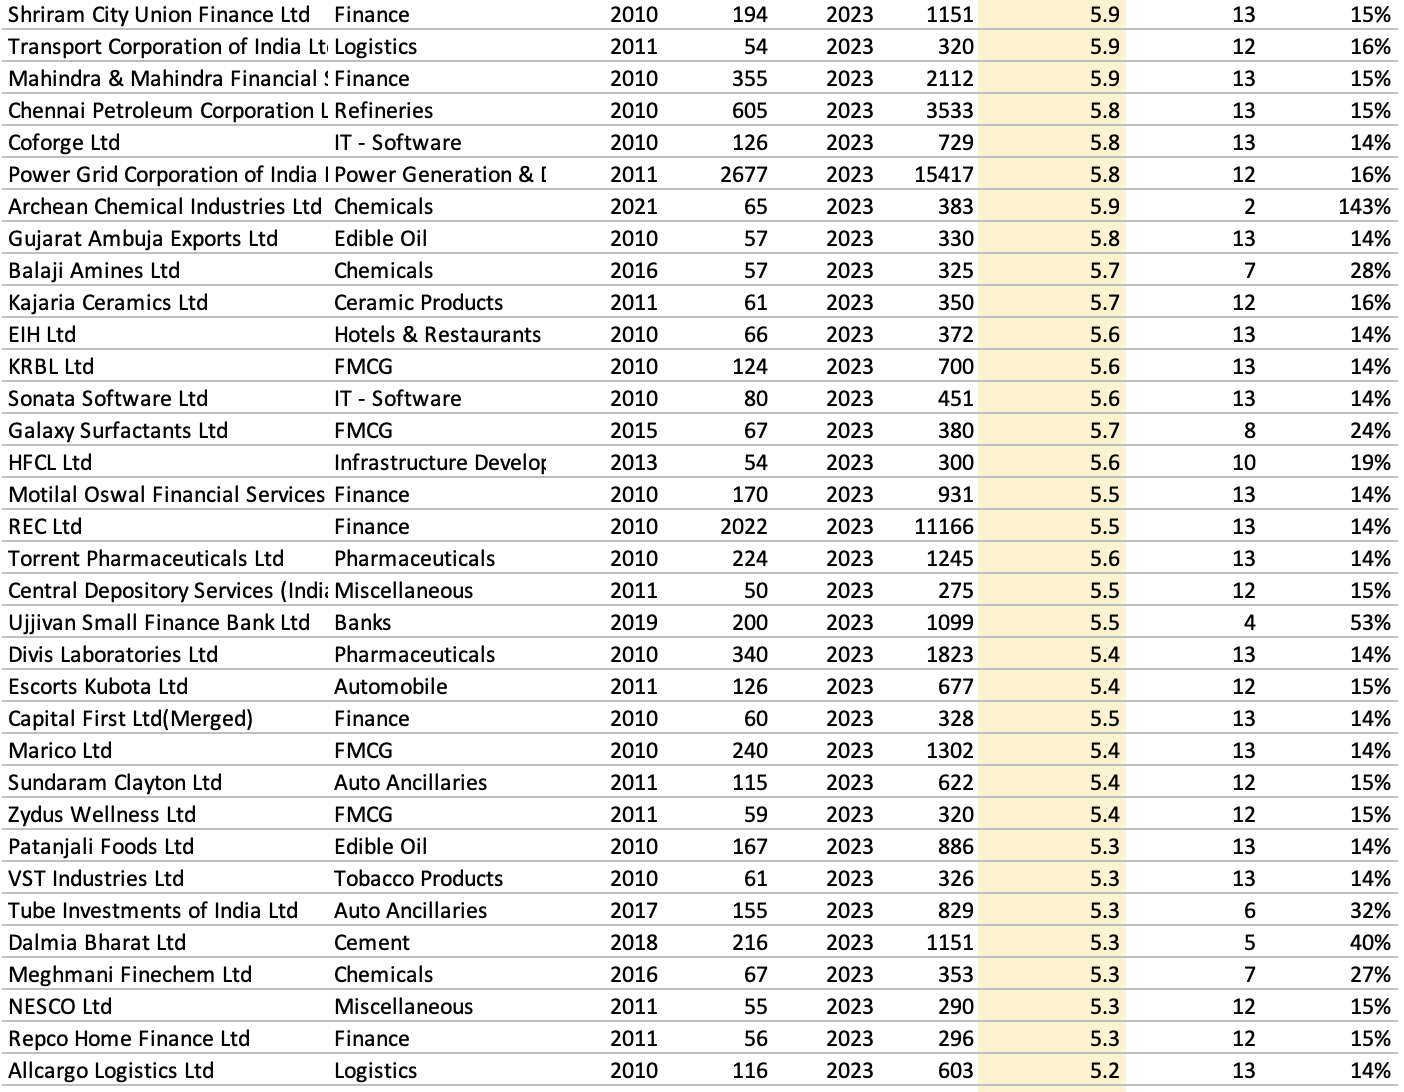
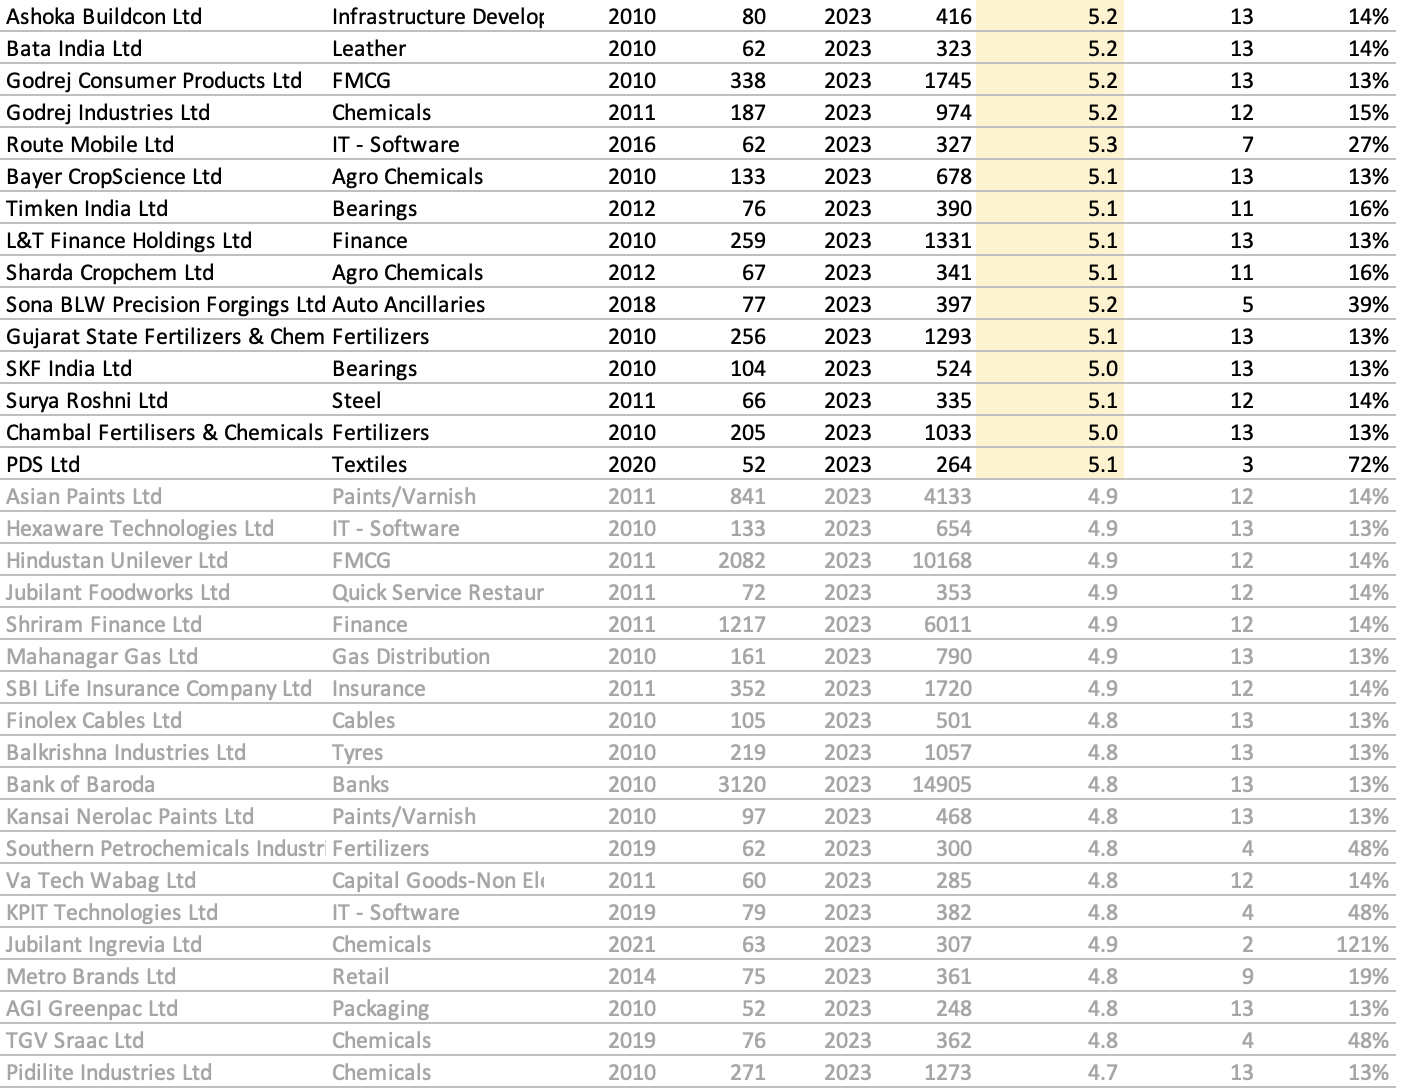
From my current set of examples - I can probably say with confidence that a Shivalik Bimetals (~75 Cr PAT), HBL Power (~100 Cr) and an Usha Martin (~350 Cr) will have a relatively easier time than say a Gujarat Fluorochem (~1300 Cr) to consistently keep scaling up from here for next say 3-5 years.

Gujarat Fluorochem has done exceedingly well in a complex playing field where far too many things change dynamically will probably cross 2000 Cr easily but for it to scale form 2000 Cr to 4000 Cr - we will need to frame the right questions to breakdown - what will GFL Mgmt need to aspire for/invest/and execute v well to cross that ? And seek the answers for that from Management as well as our grounds-up research.

What are your examples from your data-sets, and how can we go about thinking better and breaking down scalability thinking for your businesses of interest??

30 Likes

SCALABILITY THINKING #4: Let’s start talking some Data !!


Credits: generous help from @pratyushmittal Screener.in, and data parsed diligently by @spatel

This is slightly dated data set - till FY 2022.
@spatel - your turn now to take this forward with latest data sets sliced/diced around our scalability pattern questions with more beautiful charts/visuals

Capping off the series of posts with some very good suggestions received for taking things forward

  1. Take out Steel Companies, Cement Companies, PSU Behemoths
  2. Take Tata, Reliance, Adani as one individual entity each
  3. You might find that Pharma, Financials apart from IT lend themselves more to Scalability
  4. Scalability is a big function of prevailing environment. The Sundaram Finance or Chola environment in their teen years - very different financial services environment (credit lifestyle taking string roots) that Bajaj Finance found in its teen or pre-teen years
  5. India State of the Economy and sub sectors
  6. Profit Pool Totals Sector wise is a good first step
  7. Reinvestment rate and Tenure : 60% for 10 years more valuable than 80% for 4-5 years
  8. Operating History 30 years+ (many businesses in the second coming do significantly better - Shivalik and Usha Martin comes to mind almost immediately)
  9. Environment in Pre-Teens and Post-Teens growth very important in the journey of a nascent business
  10. ?

PS: I am away at a remote location for next 3-4 days; hope to see this thread full of beautiful pictures/data sets by the time I return - so we can get others from the larger investment community chipping in to take this valuable discussion forward.

55 Likes

PAT scalability remains focus area of this post.

Historical data to chew. Table illustrates list of cos whose PAT has grown at least 5x in last 14 years or less. Only cos that have crossed 50 cr PAT are considered. Table is descending sort on the ’multiple_PAT ‘parameter (marked in yellow).


Intent is to find factors contributing to the scalable stories. Some of them are -

  • niche of their own
  • not fragmented market
  • starting RoCE good mid teen and improving
  • good business model
  • competitive intensity not high
  • margin and asset turns played role (only where super efficient)
  • value migration
  • new business segment expansion
  • self-reinforcing business model

Let’s expand the above factor list. Collaborative effort call. VP members familiar with the successful scalable stories can throw light on new factors.

Interesting to note that well known names like Asian Paints and Pidilite could not make it to the 5x list yet; and not much discussed co (no VP active thread) like Bengal & Assam co Ltd made it to the list.

37 Likes

Thanks @spatel and @pratyushmittal for the initial set of much awaited baseline data points. Super job. VP Community is grateful!

Thinking through on Scalability Pointers to derive from individual success stories, might lead us to first collate and then hopefully abstract some useful Scalability Patterns for us to ponder on while evaluating newer emerging opportunities. This in itself is an exciting impact investing area :grinning: !

Being greedier, I can’t help thinking it might also be rewarding to immediately look at those that grew much faster (than the high norm :blush:) for 10+years - whether/why not can they sustain that kind of competitive advantage for the next 10+ years

Some names purely from the data thrown up (without filtering out anything/cyclicals/personal favourites)

  • Jindal Stainless
  • Deepak Nitrite
  • Bajaj Finance
  • Uno Minda
  • Tata Elexi
  • Indian Hotels
  • IndusInd Bank
  • Britannia
  • Bengal Assam
  • Varun Beverages
  • G R infraprojects
  • 5 Star Business Finance
  • and more

Many of the names I am not familiar with ( I am quite ignorant beyond my universe :slightly_smiling_face:) but have scaled beautifully - so hopefully much to learn from this ongoing exercise.

Request senior members to start sharing more from their experience set and how they react to this initial data. Would be v interesting to collate valued inputs!

@spatel and @pratyushmittal
A request for the next slice needed on baseline data. Knowing you guys, you must already be on the job

Next Baseline Data requested on

  • no of companies successfully making the transition for each doubling of PAT progressively (50 to 100 Cr to 200Cr to ….2000 to 4000 Cr and so on)
  • no of years taken (range column say 2-3 years, 4-5 years)
27 Likes

Very interesting trend here. Thanks @Donald for this ask.

Caveat: While averages are useful for comparison and high level trend analysis, they hide disparities.

39 Likes

This is an extremely informative chart!! Seems like lower PAT always have been more rewarding.
Since crossing 12.5 Cr seems to be performing best, we might want to add some lower levels too 3.125 - 6.25, 6.25 - 12.5. Still this is one heck of analysis. Firms with lower PAT generally have issues with Corporate Governance and companies with such issues generally dont make a lot for shareholders.

Some more information on how the data was sourced would be really helpful.
Ex:

  1. What is the time period which is considered for the above analysis? Maybe we can try similar analysis in dollar terms too?
  2. Can we also add the average and median PAT of all the firms which crossed X Cr PAT? And the CAGR returns for the firms!! (might make the analysis much more complicated though)
  3. Perhaps the transition from 12.5 Cr to 25 Cr happens only in some timeframe (concentrated around bull runs like 2016-17) like smallcap earnings being more volatile. But I can almost rule out this argument considering half of the companies crossing 12.5 cr eventually crossed 100 cr!!

Is it possible that the above analysis has missed companies that have gone bust? Or not trading now? This will go into how data was sourced and will help companies with lower profits looking better than they actually are.

Extra: Why the Nifty smallcap index underperforms Nifty Index? Perhaps it has something to do on valuation side? Perhaps company A and B compounded at 20% for 5 years, but market cap of A compunded at 30 and it ended in smallcap index, while B compounded at 15 and couldn’t become part of smallcap?

6 Likes

Great analysis .

But if we map sales Gr will it have similar probability and no of years .

The reason I am saying is PAT Gr can be more clouded by cyclicality of sectors , as compared to sales growth …

Unless we remove that factor we cannot say the companies has really scaled up … The growth could be temporary. and will not be indication of future .

2 Likes

Thanks everyone for starting to participate in this meaningful exploration.

@spatel
You might have opened up a hornet’s nest by including the sub 50 Cr dataset :grinning:. I am wondering if we have started barking up the wrong tree?

In our quest for “Scalability” answers, perhaps it would be more pertinent to ask baseline data for how many companies successfully made the transition to say at least 8x PAT levels

  • 12.5 Cr to 100 Cr
  • 100 Cr to 800 Cr
  • 200 Cr to 1600 Cr
  • and so on ?

Let’s start going beyond the obvious and do some second level thinking (a la Daniel Kahnemen’s ask). Every explorer must read that exemplary seminal book (on thinking through better) Thinking, Fast and Slow if one hasn’t yet !

6 Likes

Thanks for the analysis. @spatel

Would it be possible to present some qualitative data on this data set please?
Looking for prospects like if the business is B2C or D2C, sectoral information.

Historically, B2C have scaled faster and better once their worth has been established with the customer. B2Bs have a chance of being replaced in case of business-customer dissatisfaction, while B2Cs run wild on recommendations, network effect and remembering-self.

Thanks.

While making these comparisons and drawing conclusions, can we look at:

  1. Reasonable time frames, say 5 years, for analysis to account for shock events, cycles etc. I see some with 3 or 2 years and that comparison with a 20 year track does not seem logical.
  2. Can we also try and see growth in the PAT ratio CAGR for 5 year periods and see if that gives additional insights? Say a 20 year track will give us 19 5 year PAT multiples.
  3. Like Donald has hinted, scalability is definitely affected by size, inversely. So, bucketing by sizes does make better sense.
  4. How do we eliminate effects of regulatory change or shock events so that we can actually examine operational excellence which will be long term?
1 Like

Thanks @Donald for starting this thread on understanding the mechanics of scalability. I think it is one of the underrated attribute of the business (something beyond numbers and ventures into realms of qualitative aspects). Super work @spatel and @pratyushmittal on giving some very interesting data points to ponder over and ask relevant questions. While I was looking at the list, few aspects caught my eyes

  • There are set of companies that has extraordinary execution capabilities and even though the businesses are highly competitive, what sets them apart is their execution prowess…in thick and thin they execute. Some names that I know of that fall in this category are PI, Deepak, Polycab, APL Apollo, Astral, Bajaj Finance, Aarti, Gujarat Ambuja. Almost every company in above names operates in highly competitive space with many players vying for the pie…but due to extraordinary execution skills they continue to grow. As a result many such names have consistently gained market share.

  • Another interesting data point that comes out of this list is that duopoly/oligopoly/moats are overrated. In fact, many of the businesses that belong here because they were able to break free from the traditional “entry barriers” of the incumbents. Think of Eicher or Polycab or Astral…all these industries had players of scale who had advantage of brand or distribution network ( Bajaj, Hero, Finolex, Supreme) and yet they either introduced new segment/category and or deployed strategies where they beat the incumbents on their on own game to continue to grow. All these names and others continued to gain market share from incumbant…and hence I feel “ability to gain market share from existing players or ability to create new markets” is one of the factors that lead to scalability.

  • Another point to ponder over while we do exercise is why certain companies take pause/ stop to scale beyond a point? Why do companies stagnate despite large opportunity size still available? Is it just scale/market share limitation or inability to move to adjacencies for continued scale up? For example- Astral once scaled up it’s pipe business - acquired Resinova and continue to scale up that beautifully even before pipe segment slows down it’s scale up. Polycab probably is doing the same as it exploits cable segment growth, is creating new lever in terms of FMEG. Titan has done that in past and by going into eyewear and Saree is trying to do the same hence forth. Companies that take long pause (some which do not belong to this list but we have tracked and studied), Mayur or Kaveri or Ajanta or Eicher fail to do so?

34 Likes

Very interesting discussion. Trying to understand this through numbers is very interesting as well as challenging! One reason is scaling happens in stages:

  1. Seeding: Has the company taken the right direction and do they have the right person to take it through? Are the investors, board are aware of the challenges ahead and do they provide enough support for the leader to formulate a strategy and build the core team before scaling up much later.
  2. Capturing their market, even if something else looks very attractive: Is the structure loose enough to make changes, but fast enough to go after opportunities. How is it innovating? how is its competency base expanding and culture of collaboration coming up?
  3. Institutionalizing the processes to continually improve gains: How many companies find a leader to take this forward? Creator still continuing means that either the current leader has to play a dual role or someone who grew along with the company will take this forward.
  4. How to carry two cultures in the company: innovating, fast, changing company with solid operations? How does a company known for making trucks diversify itself into apparently similar business of making cars and succeed?

These phases keep repeating over time and any company that does well in each cycle will become a super multi-bagger. I am sure many smart people working in TCS didn’t see it as a great company during the growth phase: fast growth and rapid implementation appears like chaos on the ground and the way that is managed is different from a steady business which is generally taught in business schools! That method becomes obvious only in the hindsight!

One of the methods I use is to stay away from businesses that make non-business noises. Any business that is doing well will become diverse when scaled up; if diversity is their priority, customers, processes and people will not be. So are businesses that flaunt CSR/ESG: a successful business will not continue to be successful without diversity, social responsibility when it is scaled. One indicator could be how it appoints its leaders and what the company is trumpeting in the media.

Financial metrics at each stage:

  1. Below 100 Cr: Customer concentration is good. If 100 cr comes from 5 customers is better than it coming from 100 customers. A fleet operator being the largest customer is better for an automobile company than retail customers.
  2. Above 1000 crore: Top 10 customers shouldn’t cross 50% of the revenue. Number of customers added becomes an important criteria…

IPs are great, but we won’t have bandwidth to evaluate quality of IPs.

Apologies, if I took the discussion tangentially! All the best.

9 Likes