It surely helps to have ratios triangulated against industry peer/competitors to evaluate prospects standing in the packing order. Small effort to review some of the growth, profitability and liquidity ratios between VIP, Safari and Tainwala (holdCo for Samsonite).
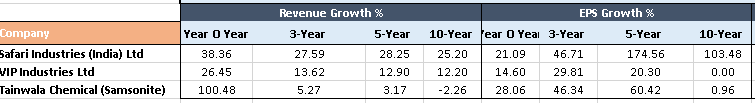
Growth Rate: - During every time frames (10/5/3/1 years) Safari has demonstrated better Revenue and earning growth rate (except most recent y-o-y where Samsonite has some stupendous growth).
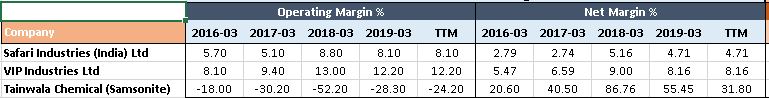
Margin Profile: - Safari margin has been lagging mostly by 300-400 bps to VIP all this while. Consolation is that there is gradual improvement.
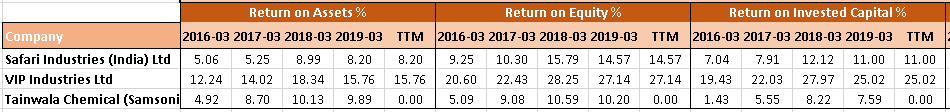
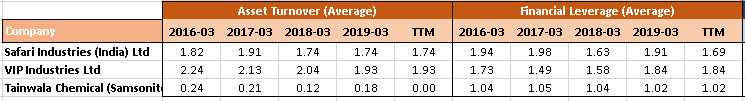
Profitability: call it beauty of numbers, so very easy to identify man vs. boy. Again, VIP has almost 2x ROA, ROE and ROIC as compared to Safari. Safari improving gradually and have sufficient headroom, if pursued well.
Well, What is the differentiation for such stark divergence in ROA/ROE profile? Is it margin, gearing or asset turn? Actually, its amplified by a function of decent margin gap and slight inventory efficiency.
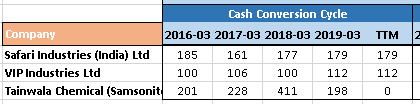
Efficiency: - Think this is the most important aspect to be evaluated well here. Safari has gruesome cash conversion cycle of almost 6 months  . VIP “comparatively” better at 4 months
  .
.
What is really different is…
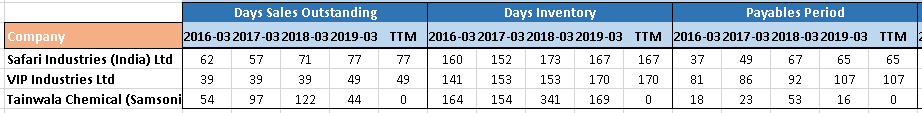
a. Inventory days almost identical at ~5 months. Not a surprise, rational was explained during Q3’18 concall for VIP industries. Basically, they pile up inventory whenever they are at better bargain position with Chinies vendors.
b. Safari on one hand is paying comparatively promptly to its vendors (possibly to extract best rates from vendors and thereby jack up sales/margins).
c. On the other hand, looks like Safari has ~2.5 months DSO as compared to ~1.5 months for VIP. Again, extending favorable terms to channels thereby ‘pushing’ sales. as a result,
I have been tracking both VIP and Safari for some time and have went through recent Annual reports, concall, presentation etc. My overall take at a very aggregate level:
- Be design or by default, there is very neat segmentation of market pie between three players. High end market which is ~35% of organized market is ruled by Samsonite/American Tourister. Mid range market is pre-dominant by VIP with ~50% market. Good line up of product offering with established differentiation within segment - Carlton, VIP and Aristocrat (in the order). Entry level segment has been cornered by Safari with some overlap with Aristocrat from VIP.
- Both VIP and Safari finds that entry level segment is growing really well. There is shift from unorganized to organized. Unorganized is approx 2x of organized industry thereby good head room.
- VIP has created really remarkable franchise for itself right at the middle of pie. Lions share of market (>50%) and that too with decent profitability. Listening to concall gives an impression that they are fighting out really well with Safari on lower segment and Samsonite on upper.
- coming to Safari, again very high growth for last couple of years. However, personally it appears that its little ‘pushed’ and not driven entirely by market ‘pull’. Margin profile, working capital needs , debtor days all of this is suggesting some heavy lifting going behind the growth.
- Other way to look at this is, there is room for decent margin expansion should management focus changes.
- May be little outlandish exercise, they will have ~250Cr. incremental sales in 2 years (@20% annual sales growth rate) entailing a need of ~75-100 Crs. of working capital (at ~30% working capital/sales ratio and no capex assumption). With current EBIT standing thin at 6%-7% they will have to go for equity dilution again (have done that every year for past couple of years) instead of debt. This time it could be sizable dilution if covering for 2+ years needs (may be upto 5-10% at a broad range with some broad assumptions).
@bheeshma - sorry to put you on spot. How do you see this extreme situation. Rapid growth → long cash conversion leading to further dilution → New equity further driving grwoth and the circle continues.
Images are not coming too well on post. Attaching the collated data sheet, surely will be worth your time. MS Collation sheet_Luggage_v2.1.xlsx (18.7 KB)
Thanks,
Tarun
Disc: Invested, less than 5% of current PF. This may change