Greenpanel is now trading at 25x TTM PE. Given the sentiments and valuation compression across the market but especially in commodities, its no longer realistic to expect Rushil to be valued at 30x 1-year forward EPS. Given the environment, probably a 20x FWD EPS multiple is fair valuation. This most likely translates into a price of 350-400 INR.
In addition, Greenpanel’s concall was cautionary about the demand environment. They are projecting a 15-18% volume growth in FY23 and have said that prices have reached a point where they can’t be increased too much more without affecting demand. Raw material prices are likely to come down due to rate hikes, so there likely won’t be a margin compression soon but realizations have most likely peaked out.
RBI’s next few rate hikes and general commentary will be key monitorables for anyone invested in real estate or ancillary companies.
I exited my position in Rushil for now at no profit no loss because of present risk reward setups. Technically, the price has breached 100EMA and is on the way to 200 EMA. Once technical signals point towards price stability, I intend to re-enter at lower prices. Risk-reward will be much more in my favour at that point.
Assigning a fair valuation multiple to a stock is one of the hardest things in investing in my experience. In bull markets, it doesn’t matter as much because stocks often overshoot intrinsic values by a lot so any valuation seems fair; but in bear markets, being cautious when factoring in a fair valuation multiple is the prudent thing to do.
The rate hikes will impact not only Rushil and Greenpanel but all stocks exposed to real estate, financial and auto sectors. These 3 sectors were considered to be ripe for expansion of valuation multiples, but looks like that will have to be on hold for now at least.
Another view - Greenpanel and Rushil sort of have a very different dynamics below EBDITA. For reaons connected to debt heavy balance sheet of Rushil.
On EBDITA basis, Greenpanel mkt cap is 12-13X( considdring normalized Q1 22), Rushil on 9-10X( Q3, Q4 annualized), discount and some derating connected to whole environment is visible already.
Greenpanel has guided Annual numbers as sustainable ( both margins and realization), i.e. 26-27% EBDITA and high teen volume growth. Key is volume growth guidance is good and annual realization sustainable.
Rushil may have more levers to play out.
Reduce interest burden - 6 cr interest and 7 cr PAT, a lot can happen here.
EBDITA margins catch-up- keeping a distance from leader Greenpanel 27%, a 18-20% looks doable, currently at 13% type. Can Q4 deliver 15% against 30% of Greenpanel?
Per Q4 call, Greenpanel lost volumes in OEM segment, somebody has gained - Rushil is strong in OEM?
Barring overall market sentiments driven moves, Risk reward tilts in Rushil favor as long as they execute well.
Near term - At 200 cr qtrly runrate and 15% EBDITA - we get 120 cr annualized runrate, at 10X multiple, they could get 1200 cr near about Valuations( 20% discount to peers). Currently mkt cap at 790 cr.
Q4 numbers are key. Plan to add if execution is good.
Agree, reduction of debt will not only improve the PAT but will also lead to some valuation expansion as the company gets de-risked.
But I am not sure about EBITDA catch-up with Greenpanel or even coming near their figures. Let’s compare EBITs of the 2 companies:
Greenpanel FY22 EBIT = 22.5%
Rushil FY22 EBIT (Q3-Q4 annualized) = 9.4%
Laminate business has delivered excruciatingly low EBIT of 6% in the last 2Qs for Rushil. MDF EBIT is also 11% only although full impact of new plant (with no disruption to Karnataka plant) will be felt in this quarter only. I am not expecting MDF EBIT > 15% in the best case in Q4.
As discussed earlier in this thread, need to pin down the reasons for substantially higher realizations and gross margins for Greenpanel vs Rushil. Is it all down to value added product mix or are there other factors in favour of Greenpanel which are difficult to equalize such as North plant which is not exposed to imports, cheaper sourcing, greater pricing power, more efficient ops?
My conservative assumptions for FY23 - 75% MDF capacity utilization @ average 23000-25000/CBM realizations - is 95 to 105 Cr of EBITDA at consolidated levels.
If price breaks below 200EMA of 378, good accumulation levels may materialize.
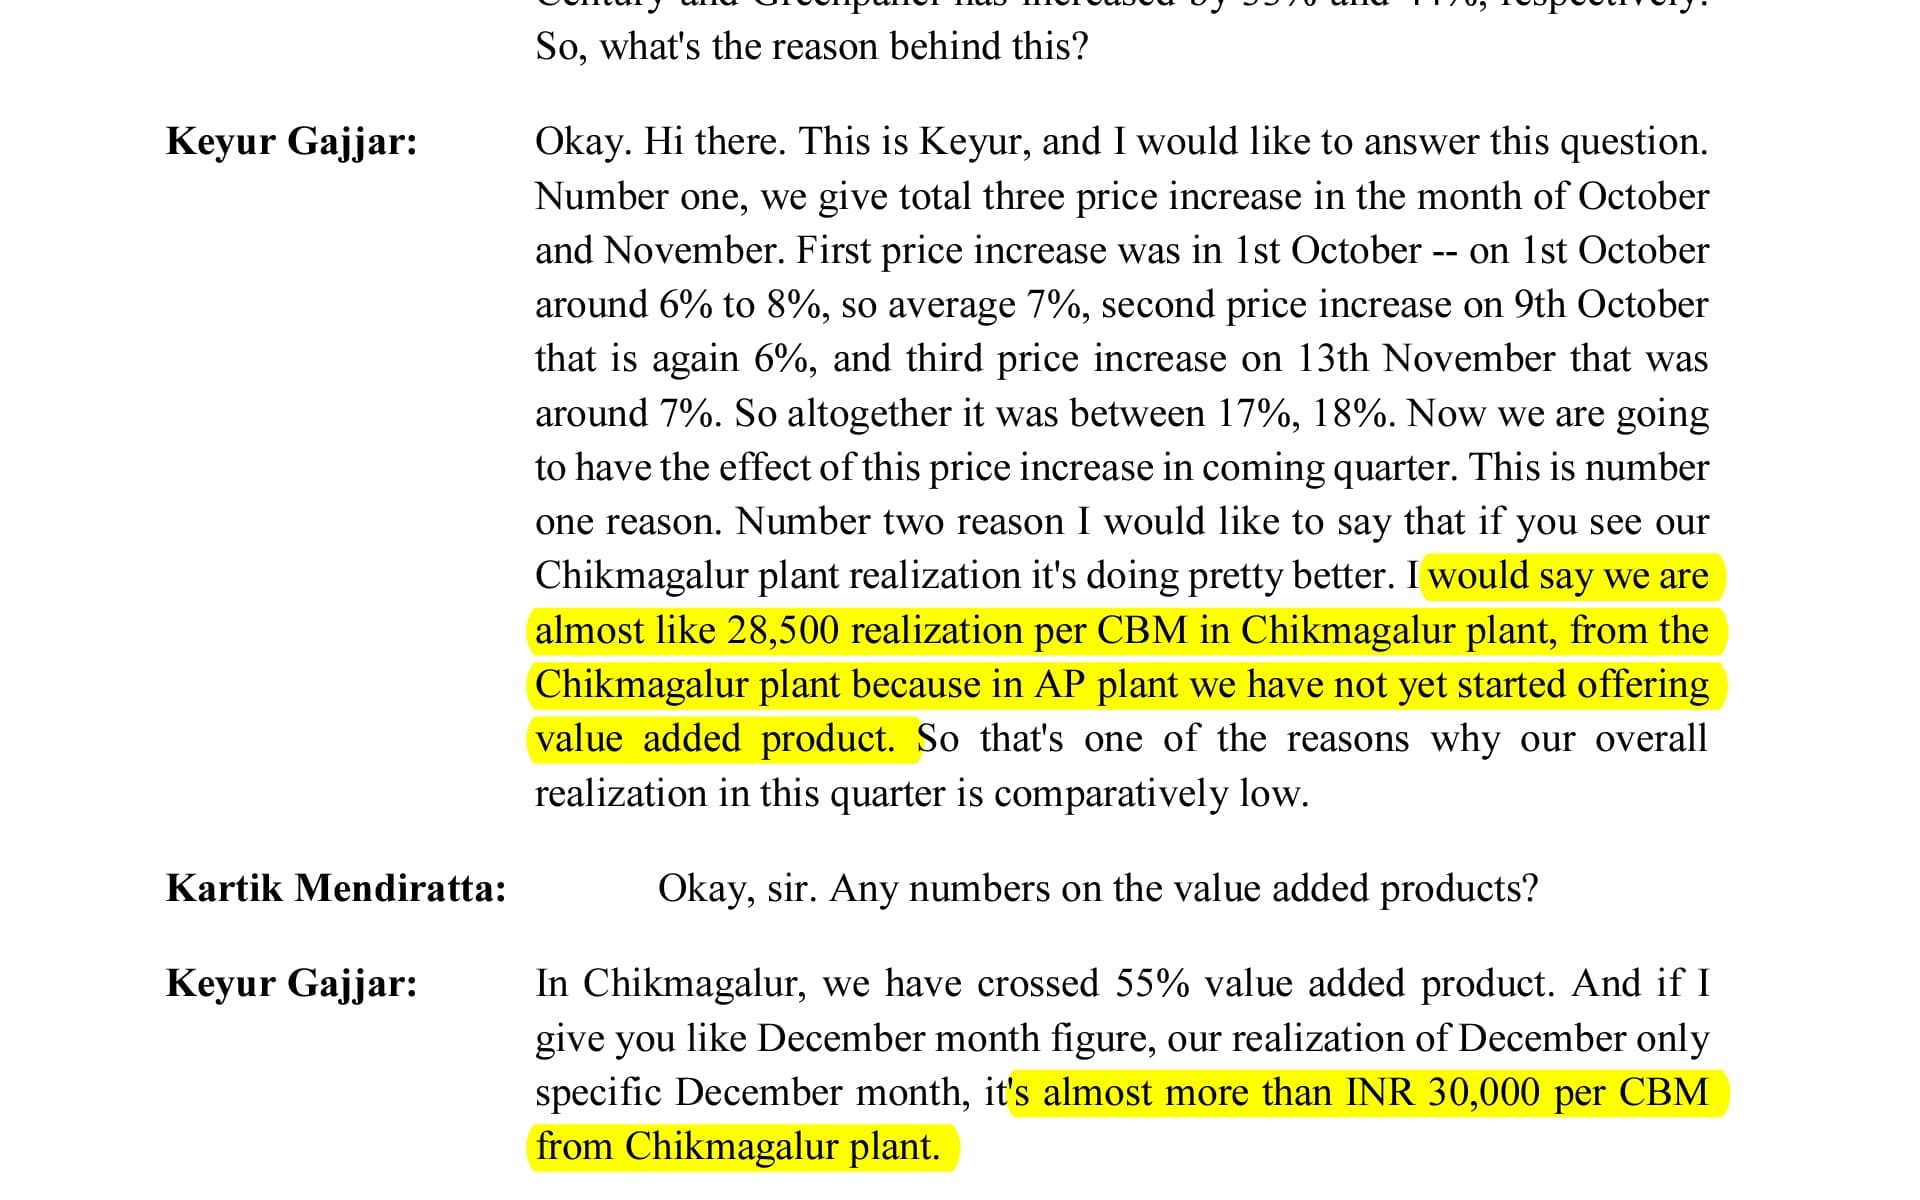
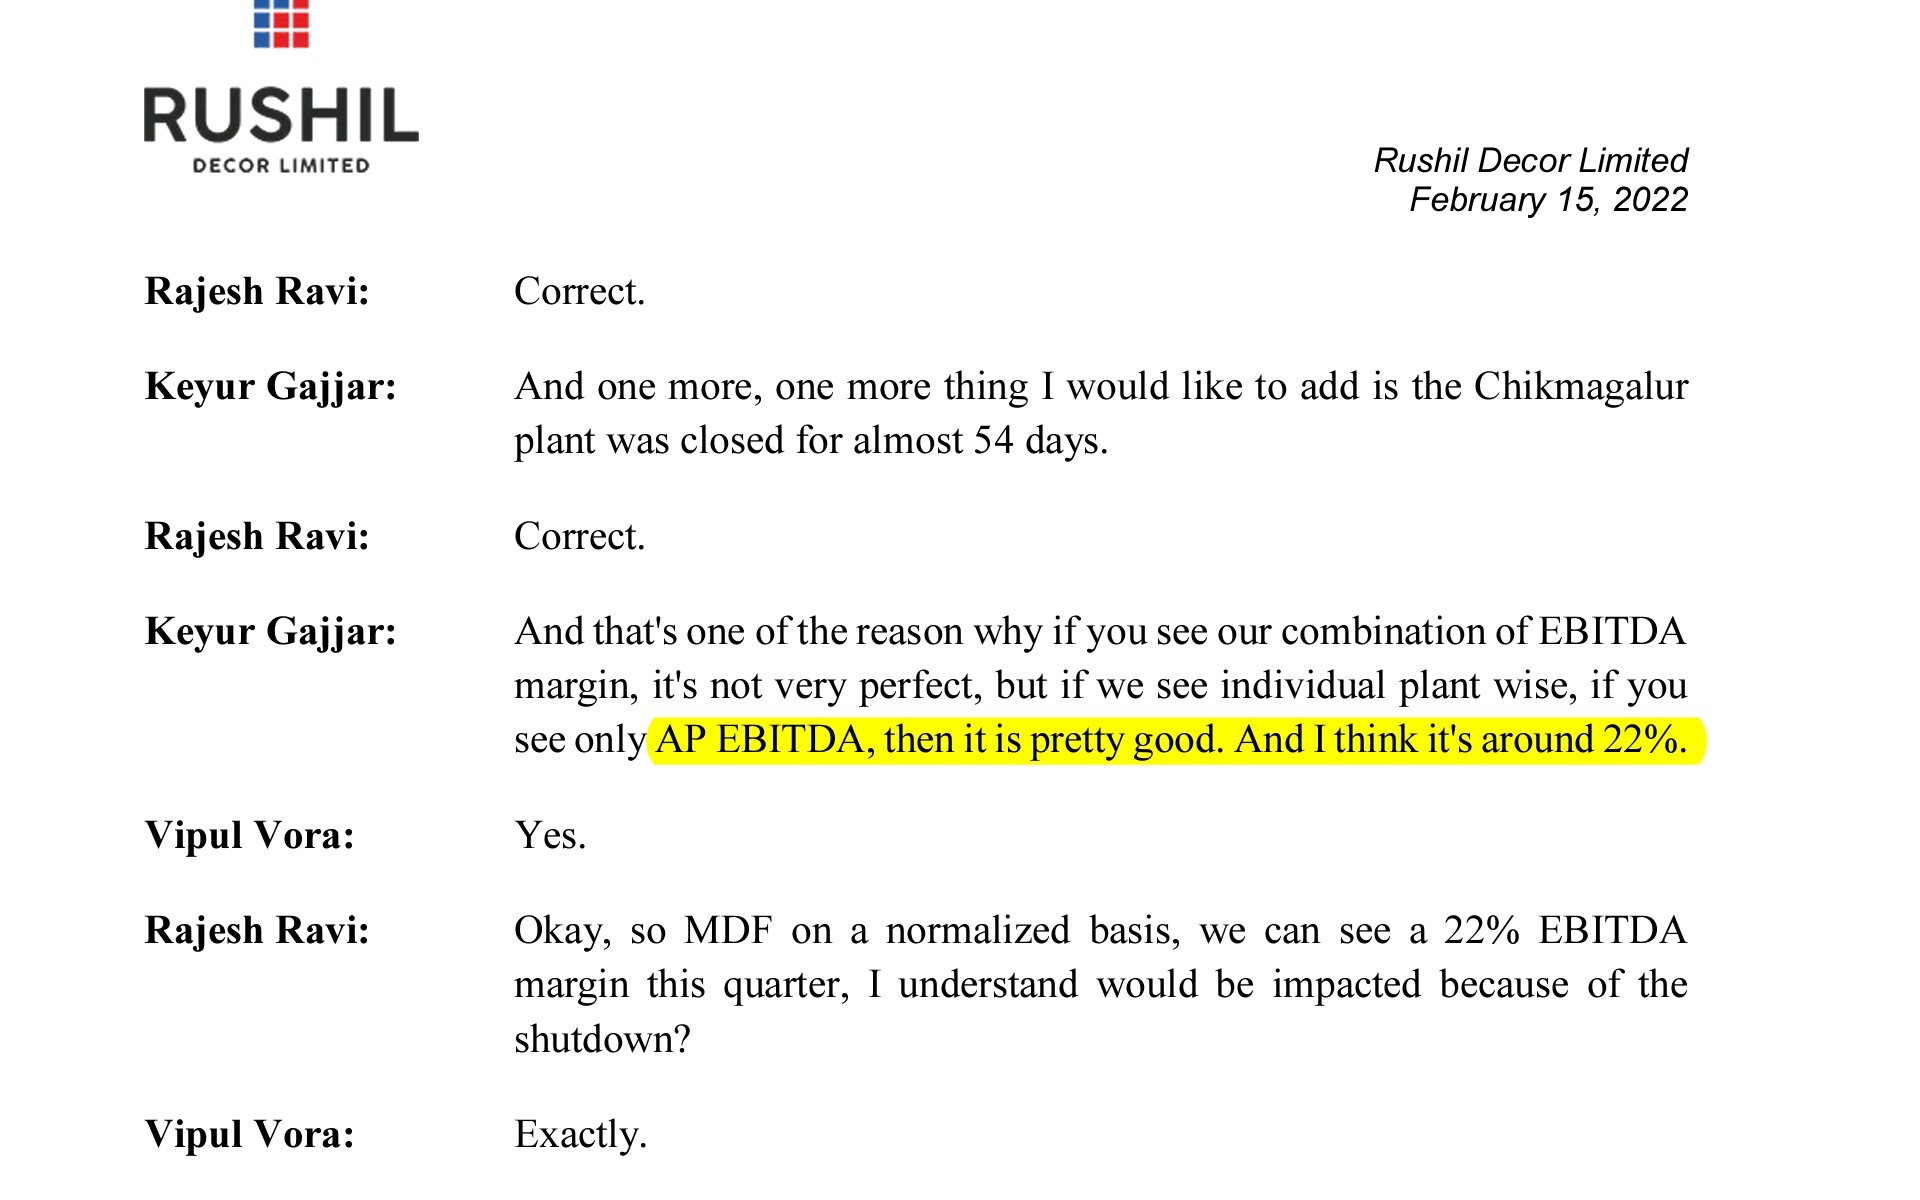
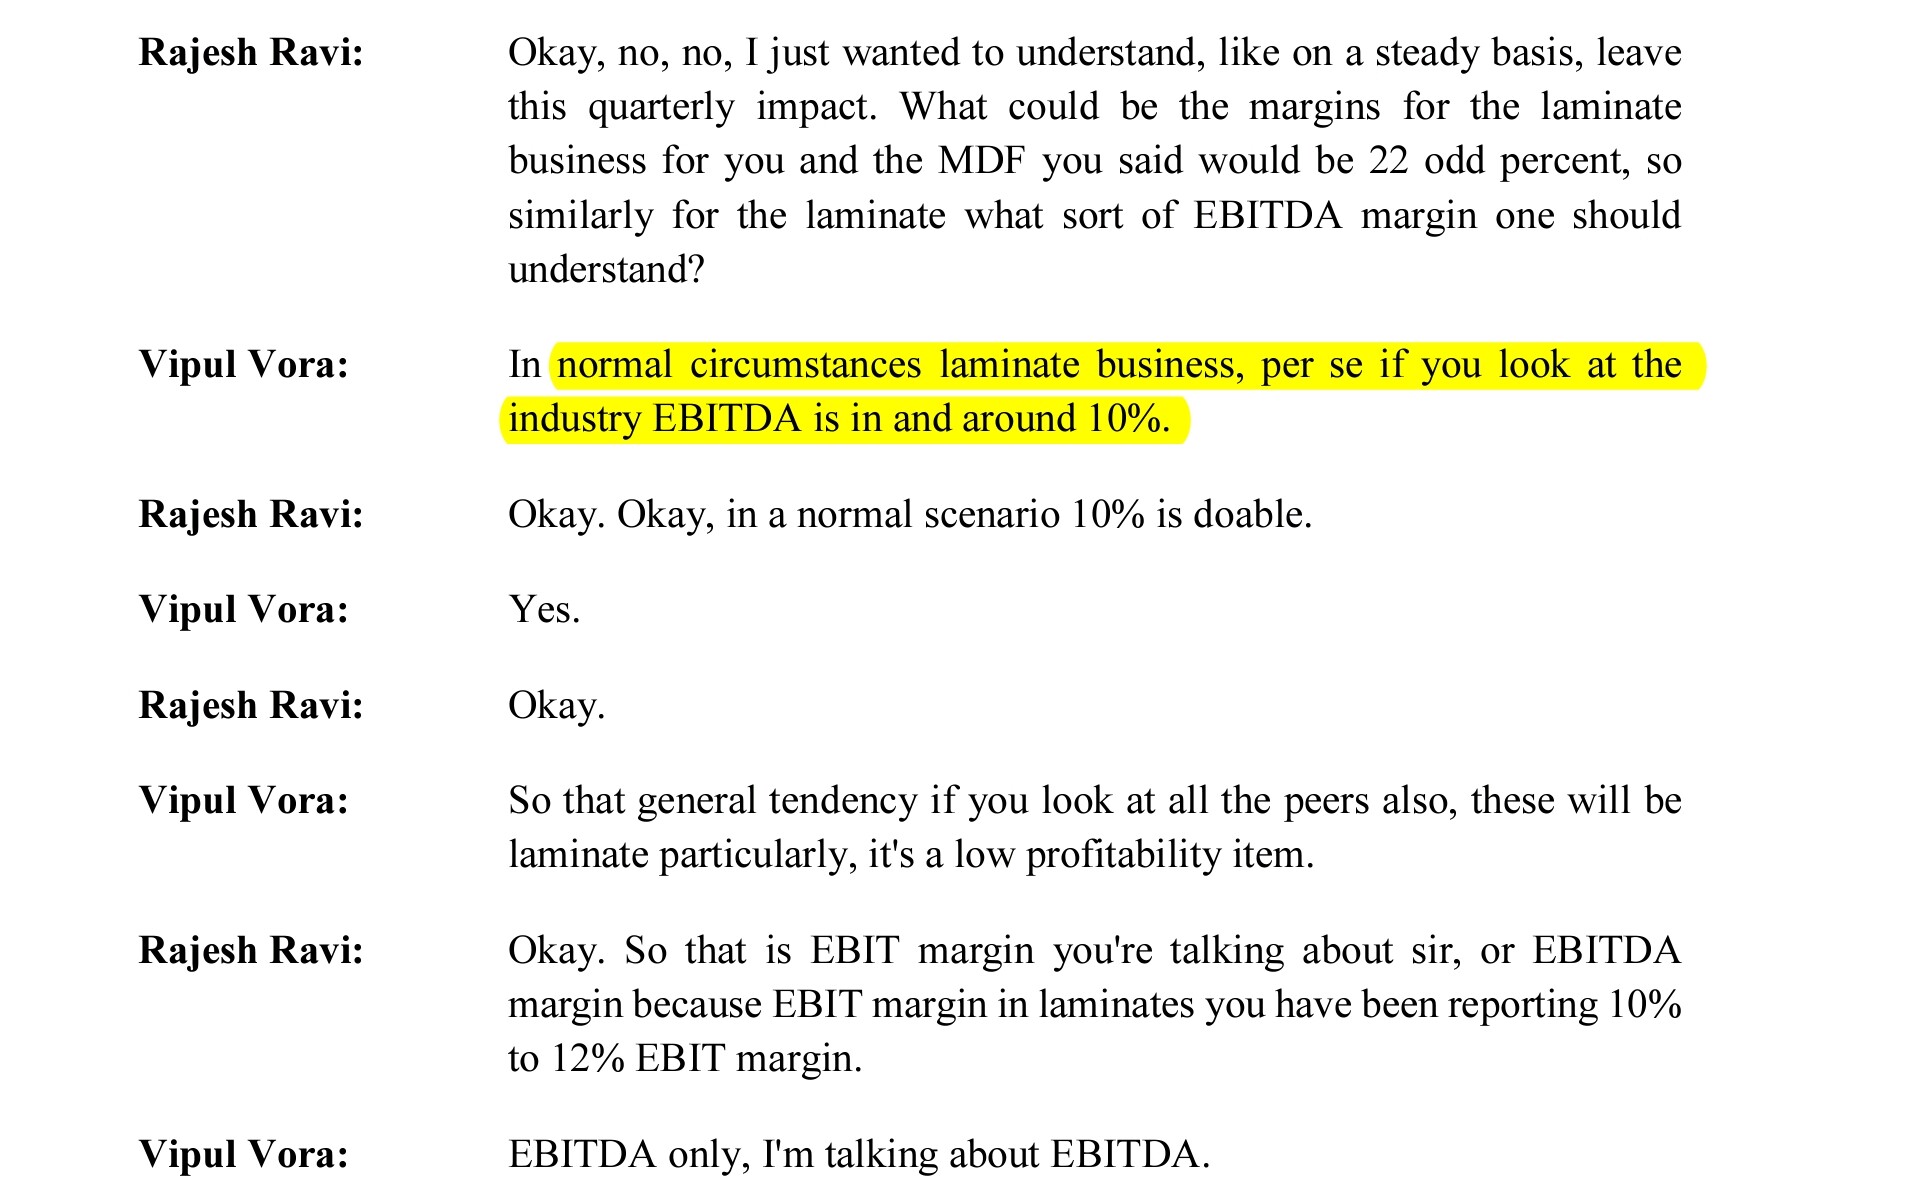
Some data points on Q3 call - AP plant EBDITA at 22%, Chikmangalur realization in Dec at between 28500 - 30000 per CBM( has value added products), Laminates EBIDTA in normal times at 10%. Though we should build some buffer but the data points paint a decent margin profiles. Also 17% price hike taken by mid Nov will also reflect majorly in Q4.
Summary - they reported 12% EBDITA nwar 22000 realization( xonsidering Chikmangalur had negative EBDITA dor Qtr due to closure)- higher realization should mostly flow through and help EBDITA inchup, alongwith higher utilization.
On broader context RE and ancillary stocks are under pressure with overall negative sentiments in global equity market, hopefully business performance is intact and demand scenario healthy. Tend to believe that RE cycle once active , will run its course ( stock price is a different matter and can oscillate between pessimism and optimist), one anecdote is Embassy REIT has accelerated office expansion plans given good demand - office space is a big driver for MDF adoption.
Overall Quarterly EBITDA margin is 16.2% against 11.4% in Q3.
Quarterly PAT is > 9M PAT for this FY.
On a yearly basis, -ve operating cashflow due to huge increase in inventories (Probably justifiable given rising price trends) and increase in receivables (No justification, probably indicates some amount of channel stuffing; Already this was an audit observation).
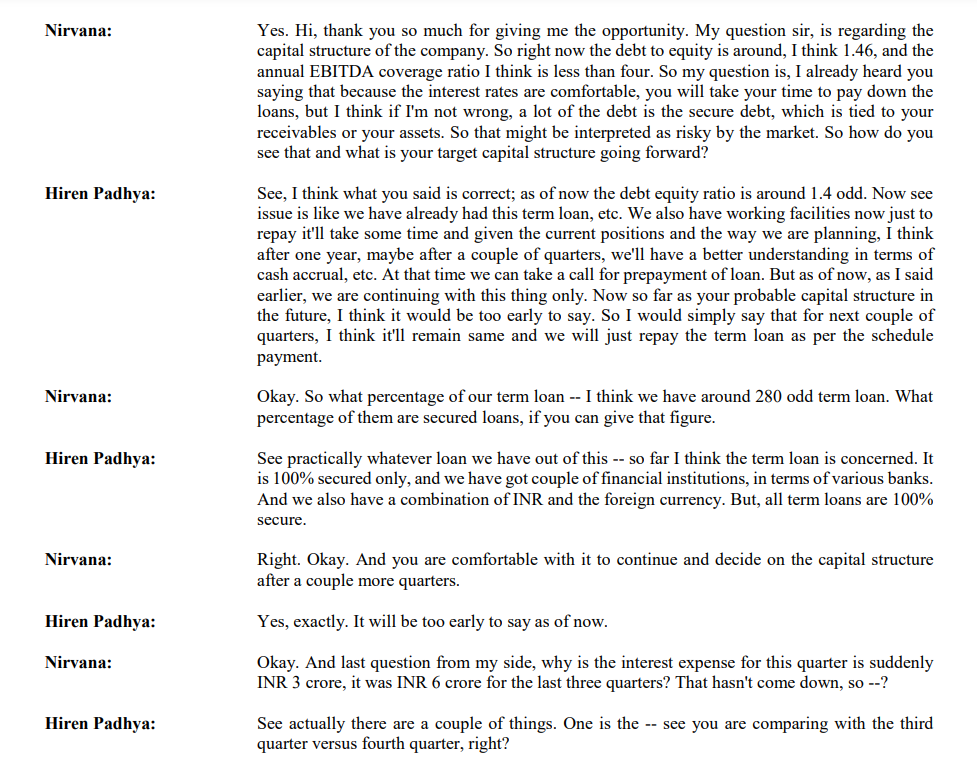
D/E ratio @ 1.45x with significant portion of working capital related borrowing.
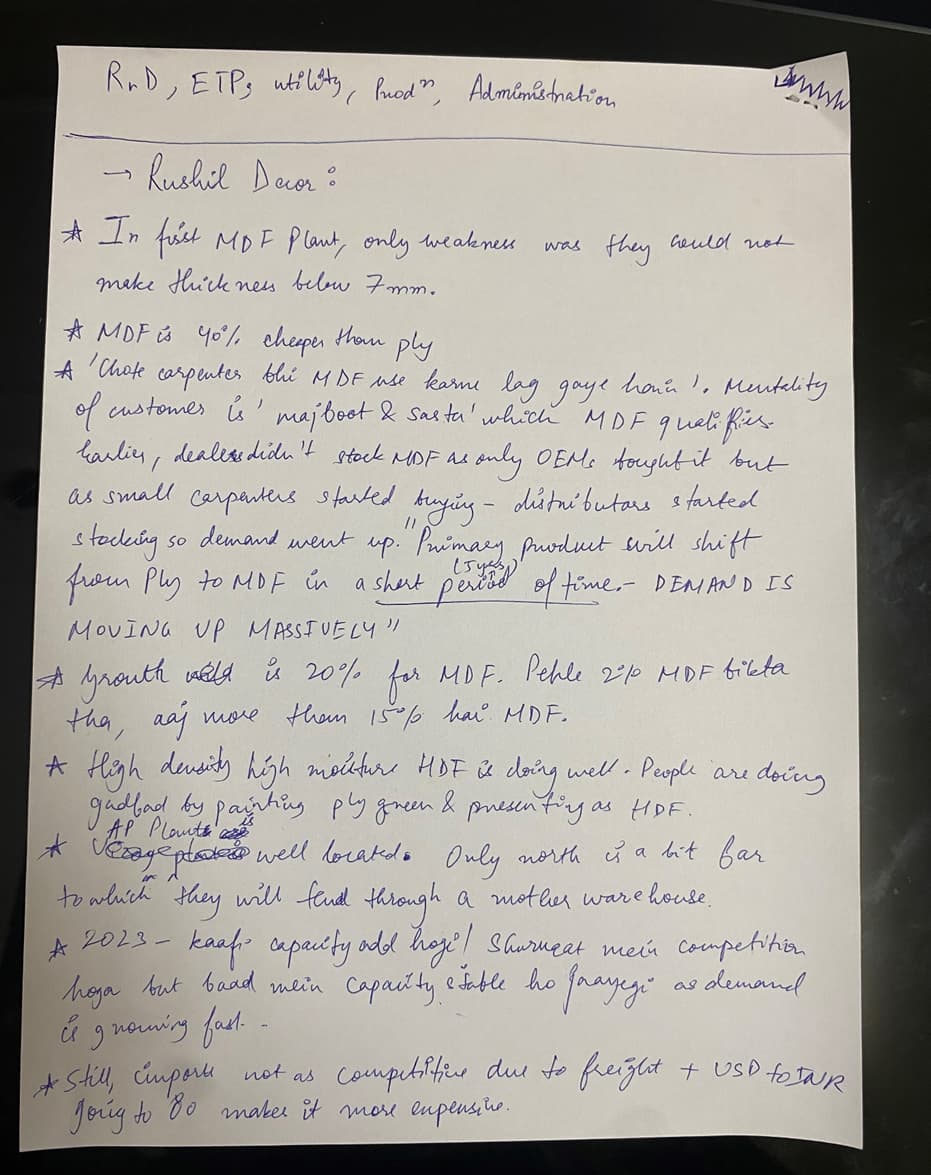
Notes from the above interview in Hinglish. Very clear that Ply’s market is being taken by MDF at a very rapid Pace. Overcapacity in FY23 and imports coming remain major concerns and need to be tracked very closely!
As one can see landing cost remains high for imports as of April, though things may stay dynamic in comimg months as global recession/slowdown evolves. Given shipping cost plays a major part in imports - doesn’t appear it would normalize in hurry.
Interestingly sub 2MM is seeing rise in imports( though at elevated prices)
Remaining part of market expectations in near term lies in price volume action of market of Rushil and peers ahead of results.
Real estate players are upbeat, both residential and commercial in India. Per recent commentaries, including price hikes being absorbed thus good demand, bodes well for ancillary ecosystem.
Exports are rising too( v small portion though), a lever to leverage on utilization for excess supplies in hand of players.
As far as supply excess is considered considering upcoming capacities- Industry has burned their hands in past - given only few major players - unlike that they themselves haven’t thought through same before capex. - something logical but can’t overlook.
Interesting juncture in industry, balance sheet strength will likely matter. Something Rushil need to address quickly to be prepared for any adversity.
Excellent results from Greenpanel. Domestic realizations stable whereas export realizations have increased Q-o-Q. MDF volumes have increased a little Q-o-Q.
This is good news for the MDF industry. It means that demand remains strong despite inflation fears.
I haven’t participated in a Rights issue yet but what I do know is that in a Rights issue, existing shareholders get the right to purchase shares at a discount to current price. The discount is given to compensate shareholders for the dilution due to expansion of equity base.
Any equity raise - whether FPO/QIP/Rights issue - will cause dilution. But it also increases firm value if the balance sheet is already stressed i.e. D/E ratio is unsustainably high, which it was in Rushil’s case. Why does firm value increase? An equity injection reduces the probability of bankruptcy due to default and hence increases overall firm value in a DCF calculation. So this equity increase is only good news for investors.
The stock is now trading at TTM PE of 16.4x. Even if this Q performance was an outlier (Which may not be the case), rolling yearly EPS may touch 40 in FY23 which would mean a PE ratio of less than 12x at current prices. I am expecting price to rise sharply this week on the back of these results and the equity raise. I was worried about the balance sheet, this move is definitely a positive for me.
I had asked them questions around this in the last concall, they weren’t sure of the capital structure then. But good to see they have acted here without much delay.
Bullish concall from Rushil. Not going into the details as transcript will be available soon, just highlighting what I thought were the main points:
23% EBITDA margins and 55% gross margins should be sustainable for the year
Barring unforeseen circumstances, they can annualize Q1 revenues for FY23 - no import threat in coming 2Qs due to high freight costs and raw material prices are now stable
Purpose of rights issue is to reduce debt - Management will participate in Rights issue. They haven’t frozen on 200Cr size yet, size may be smaller. They were grilled heavily on this dilution by investors who thought FCFs from this year onwards should be sufficient to bring down D/E ratio
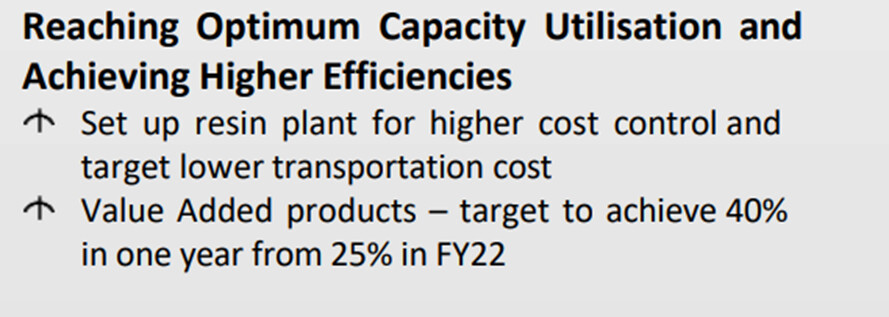
Overall value added mix for AP Plant is now 10-12% and Plant has delivered 25% EBITDA as opposed to 32% EBITDA for KR Plant. In remaining 3Qs, AP Plant should be able to improve its EBITDA further as value added proportion increases
Greenply Plant likely to go live in Vadodara in Q4 FY23, Rushil has 15-20% sale in West region and expects only temporary margin pressure if any in West due to this Plant.
As per them MDF utilisations in FY22 were around 75% and even with 6-7L CBM new capacities coming in by FY24, they expect demand to grow at 15-20% so that utilisation levels remain around 70%+ throughout this capacity expansion phase. Don’t expect sustained margin pressure in near future, only temporary while demand catches up with added capacities.
Considering idea of new capex, nothing concrete yet, capex may be be in allied products (Particleboards?)
AP Plant can function at 110% capacity i.e. 265000 CBM if needed
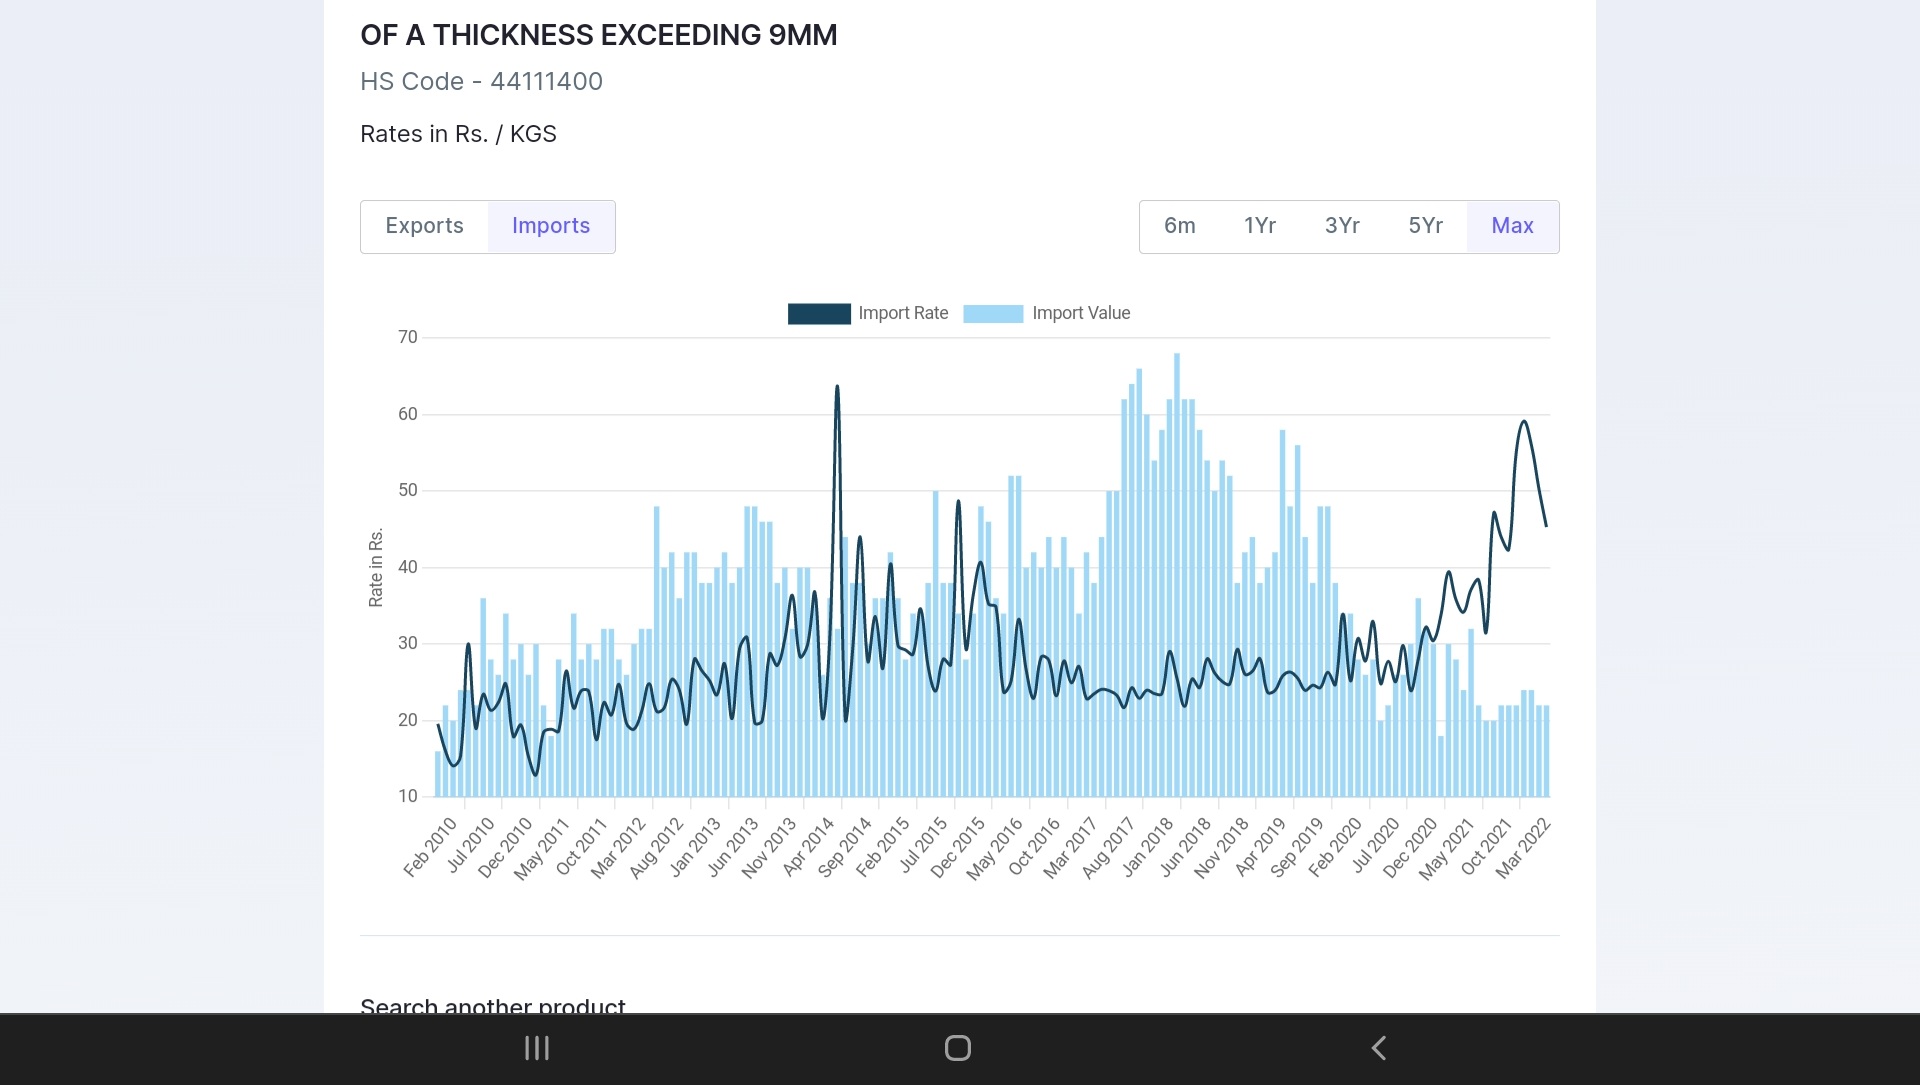
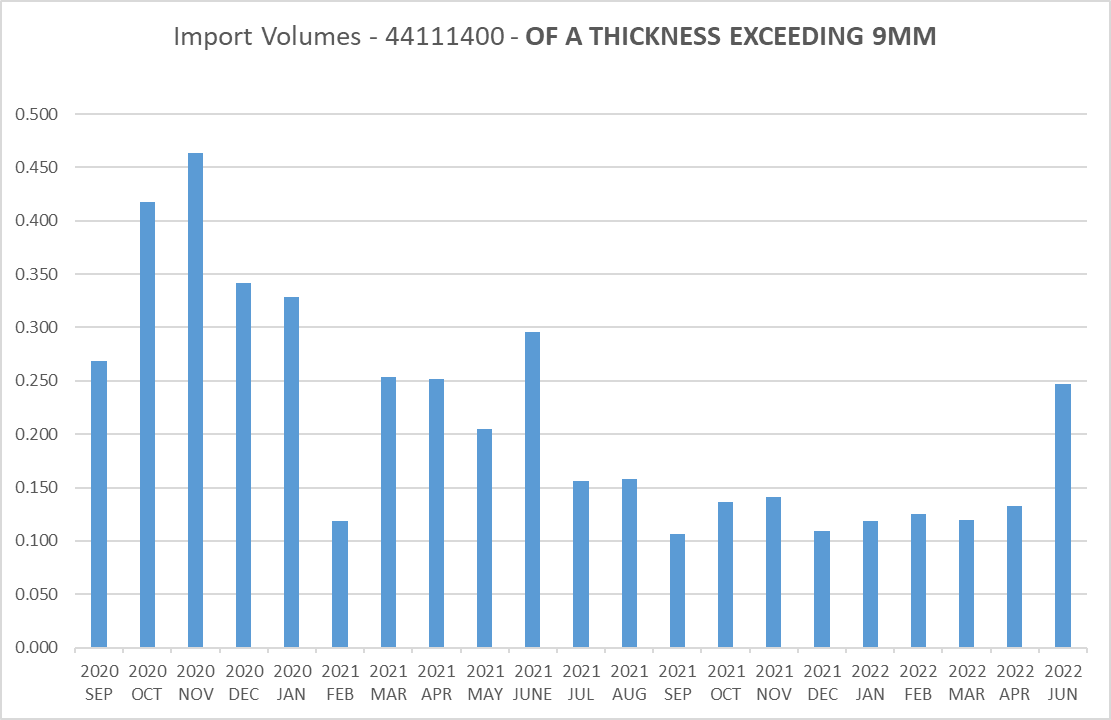
Through screener’s import data, we can get data of imports by rate ( Price Per KG ) and value.
To get qty, we can simply divide the both and Plot it on a graph to see import volumes trend.
Have done the same for all import categories for MDF, here are the results -
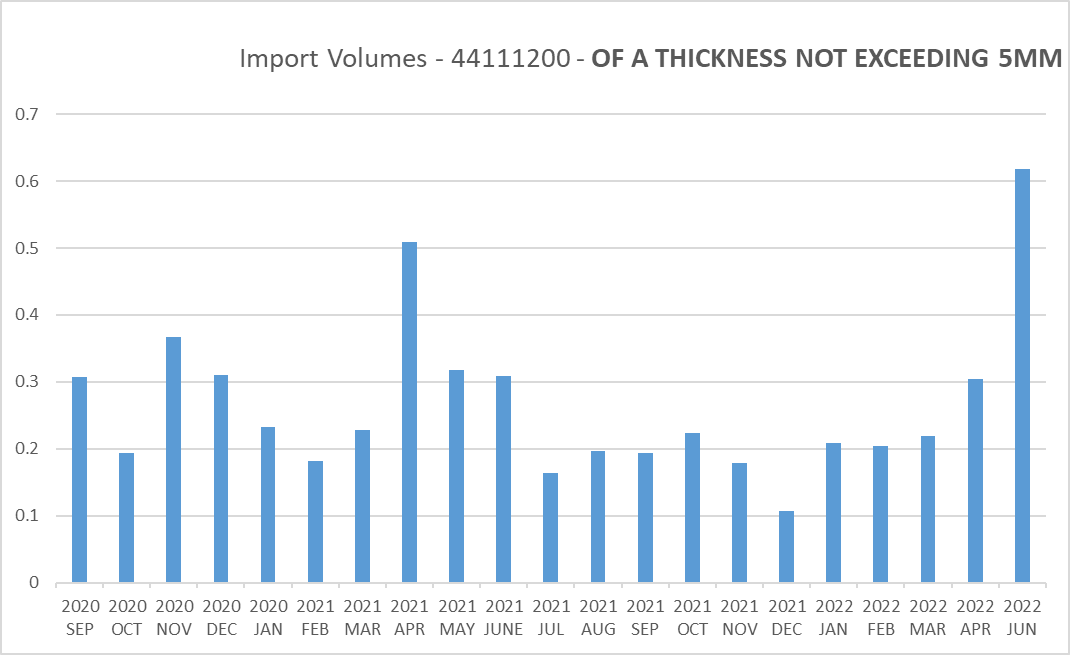
It can be seen that in June 2022, volumes are Picking up as compared to the Previous months so imports are coming back - worrying trends! The Problem with this indicator is that it’s a lagging indicator and not a leading indicator as data comes 1.5 months late!
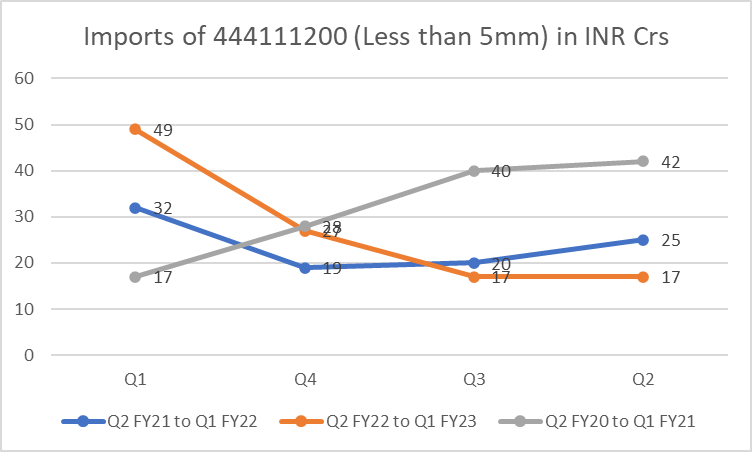
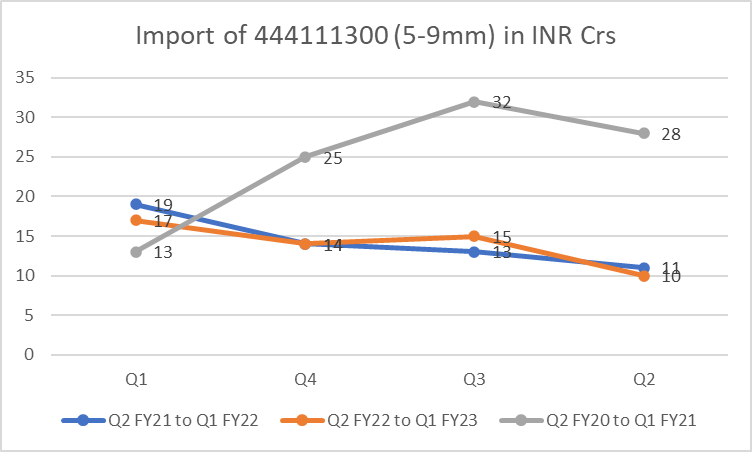
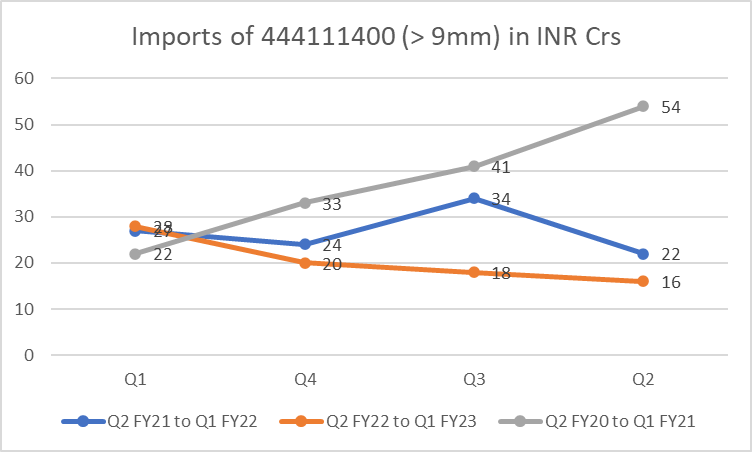
Compared import values for the 3 segments of MDF for 3 periods - Last 4Qs (Q2 FY22 to Q1 FY23), corresponding year-ago Qs (Q2 FY21 to Q1 FY22) and corresponding quarters from 2019-20 (pre-pandemic). The story in charts looks something like this
The import trends for all 3 segments are increasing in the last 4Qs as evident from the graphs. But its clearly visible that the highest increase has been in the < 5mm low realization category whereas import volumes haven’t increased much in the higher realization 5-9mm and > 9mm categories. I would interpret that as good news as long as this trend holds.
The overall Q1FY23 import value is ~94 Cr which should be around 10-12% of total Q1FY23 MDF sale in India. On a rolling 4Q basis, the total imports of around ~250Cr should amount to ~10% of total domestic sales in the rolling 4Q. If you compare this with FY20, total imports of the 3 categories of MDF were around 460Cr which amounted to almost 30-35% of domestic sales in that period.
So the current imports are still way less than peak imports and even though they are trending up in the recent 4Qs, the numbers and proportions seem to be well under control to cause any immediate pricing pressure in the domestic market. However, close monitoring is warranted for sudden spurts.
Thanks for such great insights. The Problem with this indicator remains the fact that it is a lagging indicator and not a leading one as the data is 2 months behind!
The mkt is too quick to spot such things well in advance and this indicator most likely will be a little late. Same thing happened with steel where the export duty was discounted well in advance even before the news came.
Yes this indicator lags actual data by about 45 days. But you also have concalls every 2 months (Time difference between Rushil concall and next Qtr Greenpanel concall) to track forward looking commentary.
I don’t think the MDF market is as efficient as the steel market in terms of shifting demand and supply across geographies so price adjustments won’t be as fast as steel in my opinion.
Anyway, I think its almost impossible to get out at the top unless you’re an insider, all we can do is track publicly available data as closely as possible. For those following technical analysis, price action with volumes can serve as a leading indicator too.