Ruchira Papers – Market Cap 62 crs; Debt 57 crs; Enterprise Value 117 crs
Source of Idea – Debt Capacity Screen
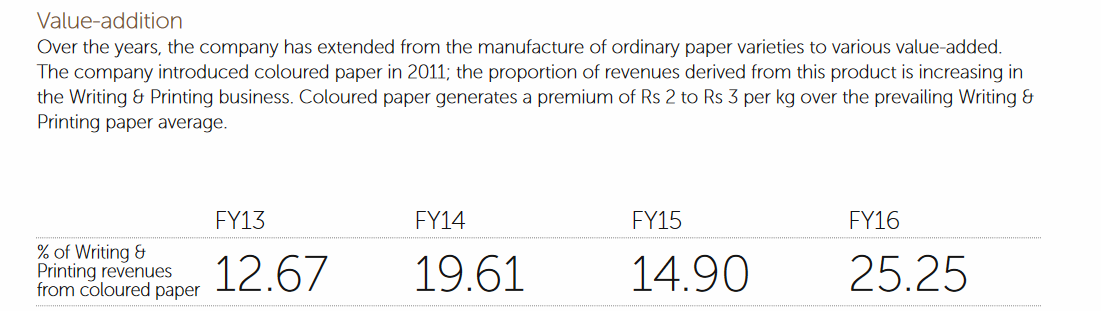
The Company is engaged in manufacturing of Writing & Printing Paper which is used for manufacturing of Note Books, Publications etc. and Kraft Paper which is used as a Raw Material in Packaging Industry. The factory is based in Himachal Pradesh close to Baddi, which is an important centre for FMCG and Pharma manufacturing.
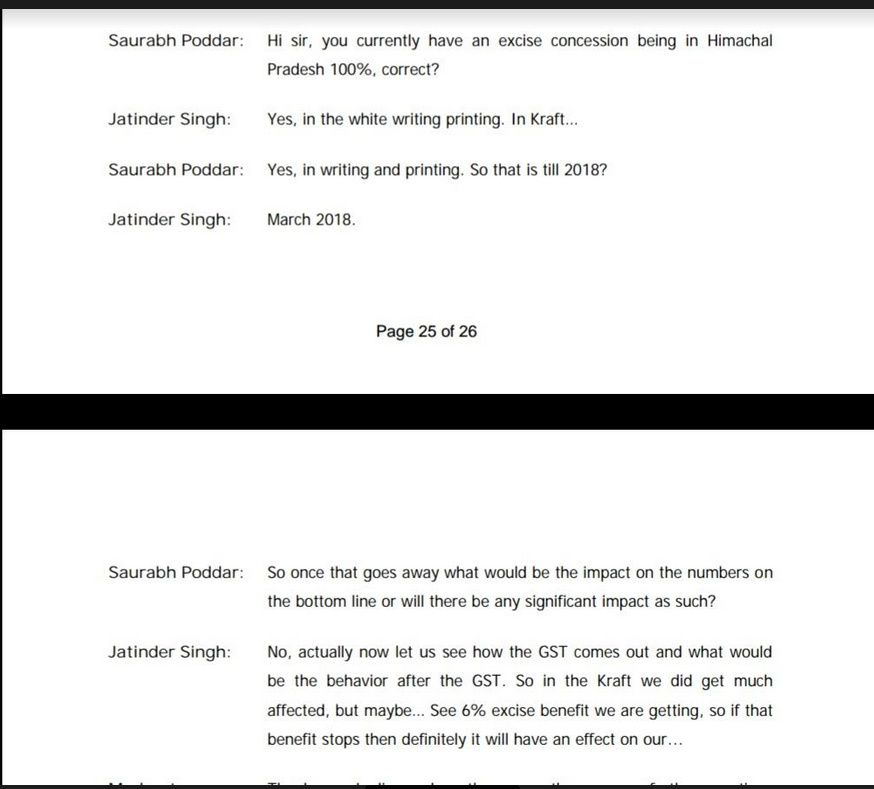
Tax Benefits - The Company being located in Himachal Pradesh is presently entitled to 100 % excise duty exemption for 10 years with effect from 30.03.2008 for the Writing & Printing Paper unit and concessional rates of Central Sales tax at 1.5 % against 2 % in other states. The Company having a Captive Power Cogeneration Plant, which helps to get the cheap and uninterrupted power supply. We are consistently complying with Environmental norms regarding Chemical recovery and have
our own chemical recovery system in place. Further, the location of the factory at the outskirts of Himachal Pradesh helps to get raw material agro residues from the neighboring agricultural rich states of Haryana and Punjab. (Excise exemption for Kraft paper lapsed in 2014)
Operational & Financial Details
Liner Kraft Paper Mar-11 Mar-12 Mar-13 Mar-14
Installed Capacity (MT) 52,800 52,800 52,800 52,800
Capacity Utilization 95% 97% 94% 90%
Production (MT) 50,014 51,097 49,706 47,722
yoy 2% -3% -4%
Sale (Rs crs) 121 125 123 123
yoy 3% -2% 0%
Realisation (Rs/MT) 24,233 24,502 24,725 25,796
yoy 1% 1% 4%
Contribution to Sales 48% 44% 41% 38%
Writing & Printing Paper Mar-11 Mar-12 Mar-13 Mar-14
Installed Capacity (MT) 33,140 33,140 33,140 33,140
Capacity Utilization 106% 121% 123% 125%
Production (MT) 35,066 40,173 40,791 41,425
yoy 15% 2% 2%
Sale (Rs crs) 133 159 173 200
yoy 20% 9% 15%
Realisation (Rs/MT) 37,960 39,654 42,515 48,207
yoy 4% 7% 13%
Contribution to Sales 52% 56% 58% 62%
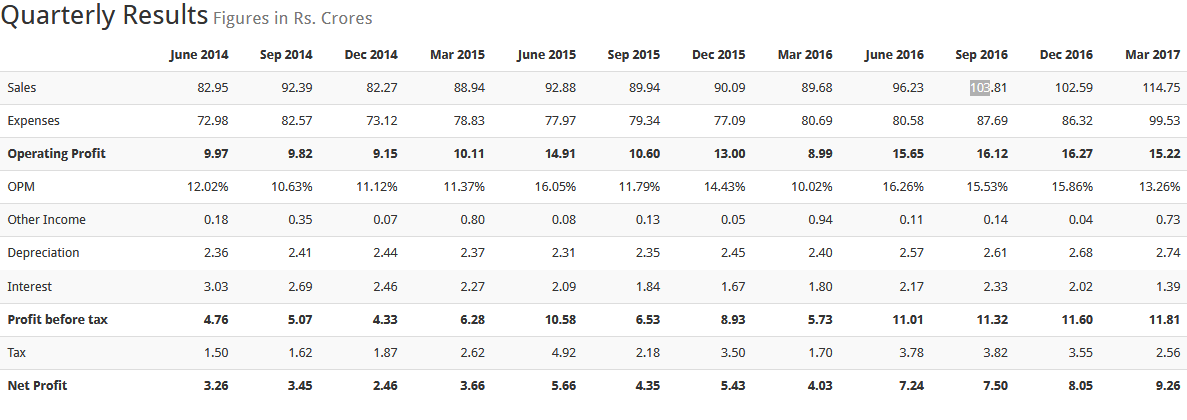
Higher capacity utilization has led to improving cost efficiency and better asset turns. Return ratios have improved to at least cover the cost of capital since 2012. Sales mix has also changed in favour of the more profitable WPP line.
Key Financial Information Mar-11 Mar-12 Mar-13 Mar-14 Mar-15 Comment
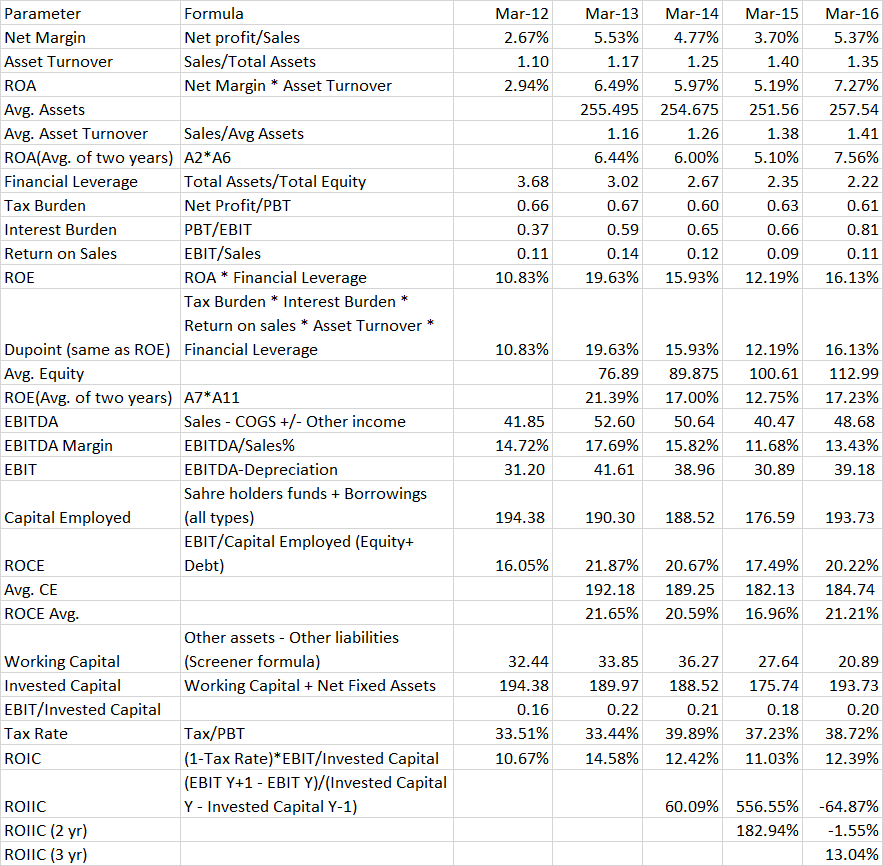
EBIT Margin excld OI (%) 9% 10% 13% 12% 9% Margins are volatile due to input costs. 10 year avg EBIT margin is 10%
Fixed Asset Turns (x) 1.5 1.8 1.9 2.1 2.3 Better capacity utilization & Depreciation
Return on Equity (%) 6% 11% 20% 16% 12% Led by asset turns
Retun on Invested Capital (%) 8% 11% 16% 14% 12%
Debt (Rs crs) 132 124 88 74 57 Debt has halved over 5 years Working capital management is good.
EBIT (Rs crs) 22 30 40 37 30
CFO (Rs crs) 27 27 43 31 30
FCF (Rs crs) 26 25 38 24 24 Maintenance Capex is being done.
Debt to Equity (x) 2.1 1.8 1.1 0.8 0.5
Interest Coverage (x) 1.3 1.6 2.5 2.9 3.0
Dividend Payout (%) 0% 0% 11% 15% 23% Excess cash being returned to shareholders
As is evident, the financial metrics have improved considerably over the last few years. The addition of new capacities is paying off now. (The company set up its new WPP line in 2008)
Risks
- Paper is a commodity business. It is capital intensive with high labour & power costs.
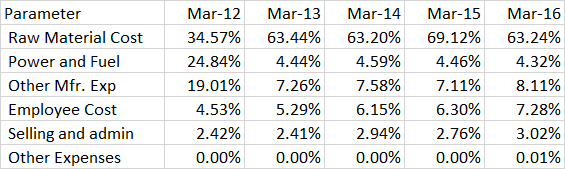
- Tax exemptions expire in 2018 for WPP. They have already expired for Kraft paper in 2014 (this could be one reason for lower margins in FY15)
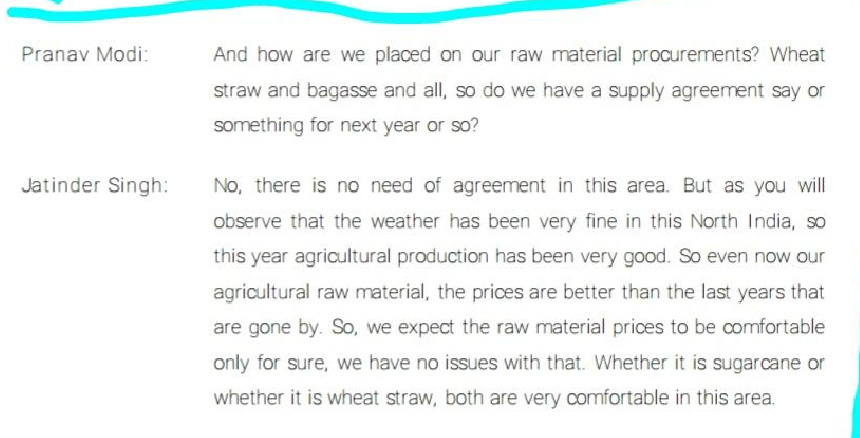
- High raw material prices are unlikely to be passed on to customers and will increase working capital requirements.
- Borrowing costs are extremely high at 16%. Although the credit rating has improved, this has not yet translated into lower interest rates for the company.
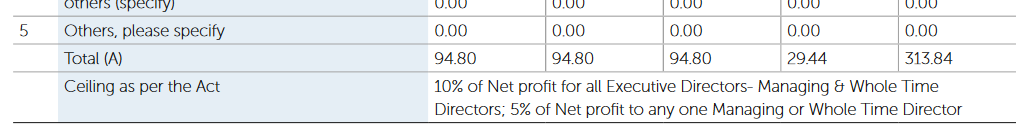
- Management compensation is too high (6 lakh per annum + benefits). This isn’t a deal breaker, especially since related party transactions are not material.
- Management may want to increase capacity which would be a deal – breaker. However reading of the annual report suggests that they will sweat the assets more before doing this. I think any capex expansion is unlikely before 2018 when the tax benefits expire.
Valuations
Mar-11 Mar-12 Mar-13 Mar-14 Mar-15
Mcap 33 22 27 27 61
P/E 8.5 2.9 1.6 1.7 4.8
EV 163 145 110 97 116
EV/EBITDA 4.8 3.5 2.1 1.9 2.9
P/B 0.5 0.3 0.3 0.3 0.6
Dividend Yield 0% 0% 7.1% 8.4% 4.8%
FCF estimated 26 25 38 24 24
P/FCF 1.3 0.9 0.7 1.1 2.6
EV/FCF 6.3 5.7 2.9 4.1 4.9
Where is the margin of safety?
Let us look at a bad scenario for the company. Let us assume the financial performance of the FY11 repeats for the foreseeable future.
Pro – forma financials Mar-16 Mar-17 Mar-18 Mar-19 Mar-20
EBITDA (incl OI) 34 34 34 34 34
Depreciation 9 9 9 9 9
EBIT 25 25 25 25 25
Interest @ 16% 9 8 6 5 3
PBT 16 17 19 20 22
Tax @ 33% 5 6 6 7 7
PAT 11 11 12 14 15
Dividend @ 20% 2 2 2 3 3
Debt Repayment 8 9 10 11 12
Debt at end 49 39 29 19 7
Although this is not the worst case for the company and certain simplifying assumptions are made (no deterioration in working capital management, no loss years etc), I think this is a good proxy for steady state operations in a bad environment for the company.
Why not earlier years taken as proxy – the WPP plant was made operational in 2008. I have taken the FY11 as it would be the 3rd year of operation giving a better indication of steady state operations. Although this is arbitrary I believe there is good reason for the same (FY10 & FY11 annual reports; power consumption per tonne of production trends down from FY11)
Assuming these numbers hold let us value the stock on P/B & EV/ EBITDA
Price to Book Mar-16 Mar-17 Mar-18 Mar-19 Mar-20
Networth 114 123 133 144 155
RoE 9% 9% 9% 9% 9%
P/B x (RoE/12%) 0.8 0.8 0.8 0.8 0.8
Market Cap 88 96 104 113 122
EV/EBITDA Mar-16 Mar-17 Mar-18 Mar-19 Mar-20
EV assuming 3x multiplier 102 102 102 102 102
Debt 49 39 29 19 7
Market Cap 53 62 72 83 95
The 5 year return in this case is 9% p.a. assuming EV/EBITDA multiple of 3x. Using P/B the return is higher at 15% p.a. Both are excluding dividends. This in my view is the worst possible return assuming steady state operations.
This would be proven false if the company makes losses in an extremely unfavourable raw material environment.
In an optimistic scenario of FY15 performance continuing with fall in interest rate for the company and a slight rerating to 1x P/B or 5x EV/EBITDA the return could be as high as 30% per annum for 5 years. This could easily be a
Conclusion- BUY
- Asymmetry is high and in our favour. Chance of absolute loss is low and is likely only if the performance deteriorates significantly. This is a very low chance event.
- Liquidation value (roughly calculated) is probably close to 40 crs. But this is most definitely a going concern and likely to remain so for a long time.
- Monitor raw material costs and peers to get a sense of the environment. Only a poor cost environment can spoil this party.
Position size recommended – between 2% to 4% of portfolio at initial buy.
Disclosure - I own the stock