Is there any way by which we can make baskets of stocks (on the basis of what goes up and what goes down together). For example, commodity-related stocks like stell will go up and together most of the time. So our algorithm should separate these stocks in form of different baskets.
I was thinking of implementing it by DBSCAN Algo for clustering(Which is part of ML). Any other approach by which we can do it?
1 Like
You can always find groups of stocks with high correlations and make baskets of them. But most traders look for the opposite, i.e. some set of stocks that go up when another set of stocks fall.
You need to do some backtesting to figure out if there is any edge in such a system. I haven’t tried it myself so can’t really say.
2 Likes
Hi Abhishek, will you be updating the performance on the website?
http://www.quantamental.in/performance.html
Thanks… Updated…Since I have to do it manually, keep forgetting.
Q30
Q10:
Note: The performance data is based on daily NAV as publicly available on smallcase.
5 Likes
Hi Abhishek, with the recent drop in the markets, could you please share the highest drawdowns both the strategies faced? Also, when did these highest drawdowns happened? Moreover, just trying to understand if the strategies hit the stop loss and you were forced into cash? Thank you, Swapnil
Yes. Both strategies have been forced into cash gradually and currently, the cash level is very high, almost half to just a quarter invested in the other.
The lowest drawdown level was on 24th Feb recently when there was a steep fall on a single day. The highest drawdown on that particular day reached 27% and 31% respectively.
Drawdowns usually have a linear relationship with returns. The tighter you control the drawdowns for a given strategy, the lower the returns. We have consciously tried to strike a balance, neither try and limit it a lot which puts a serious dent on its long term returns potential nor let it bloat to scare people away. As to what level of drawdown suits a person is an individual specific matter. For someone, 15% may be a serious drawdown, for someone else 30% may be okay in the quest for higher returns.
6 Likes
Q) Can you blend fundamentals with quant?
There is this huge misconception that quant means only technicals. It is not. Quants is using quantitative techniques (statistics) to take decision-making rule-based and non-discretionary.
Actually, unless you are a very brilliant and superior investor like Buffett, you are better served by following some quant methodology either fully or partially.
Various quant screens help generate ideas for me to then go and study fundamentals and technicals.
Example: 20 stock portfolio rebalanced quarterly based on the following filter criteria:
- Operating margin QoQ growth >10%, PAT > 0, ADX > 20, CMP > 50 day moving average
- Cumulative returns: 933.38%; Return CAGR: 17.29%
- Nifty 500 returns of 191.52%
- Max DD: 30.45%
- Period – 1/1/08 – 31/6/22
- Winners:Losers – 266:144 (~1.85)
A completely passive strategy would have outperformed the benchmark by a mammoth margin over a duration of over 14 years. This is a very simple system. It can be refined further to improve performance and reduce maxDD etc.
11 Likes
A simple trend following quant system
I was teaching basic quant to a friend. My effort was to focus on explaining how reasonable returns could be had from investing in a systematic strategy with less churn and low headache 
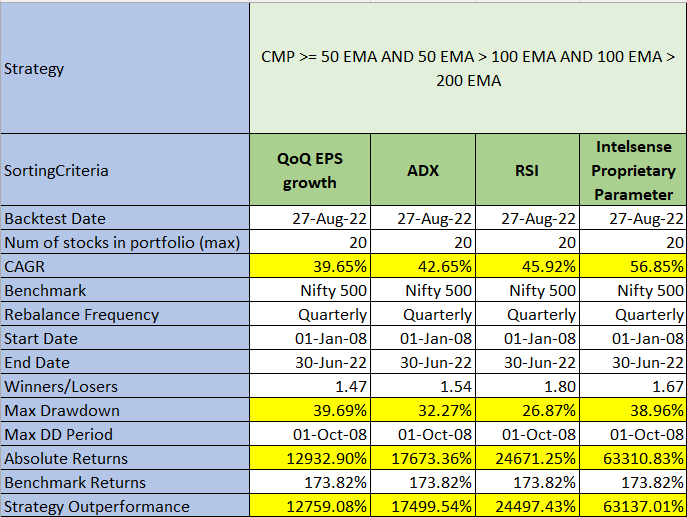
So, what I did was I tried a very basic system. Mark Minervini suggested this combination of moving averages in his book. The idea here is to look for stocks whose current market price was greater than the 50-day exponential moving average (ema), the 50-day ema should be greater than the 100-day ema and that should be greater than the 200-day ema. The strategy then selects the top 20 stocks filtered by specific filter criteria. I tested it with 4 different options - RSI, ADX (both technical indicators), QoQ EPS growth (fundamental indicator) and our own proprietary indicator which we have developed in-house at Intelsense.
Additional work is needed to reduce the max drawdown (if required) but we need to keep in mind any efforts to reduce maxDD also reduce the return CAGR.
The results are superb. The return CAGR varied from 40% to 56% over 14.3 yrs (before costs and taxes, for which you should deduct around 6-8% since this is a quarterly strategy).
The bottom line is that if you can stick to a mechanical strategy there is a lot of returns to be made over the long term.
This is primarily a technical system wherein most of the screening parameters are technical in nature. I will be sharing similar fundamental and technofunda strategies in the future which will hopefully be able to showcase why more and more capital globally is moving away from discretionary investing to systematic investing.
18 Likes
Any particular reason why the backtest was limited to 14.3yrs? Does this coincide with the bullrun that began after the 2008 crash? Would the returns be significantly different if backtest went back to say 18yrs or 23 yrs or more? Just curious.
hi @basumallick
Thanks for sharing a base system that one can build on. I run quant strategies intraday and I normally assume 2X DD from Backtest. Although backtest DD is also seen in live at times, DD can exceed maxDD from backtest. How does is compare of Short term positional systems in live. Does the DD reflects and stays within backtest limits ? Im asking this mainly because DD showed in the table is pretty high and if one can stand to stay quiet when its getting tough.
Once again thanks for sharing your views.
Firstly, starting from 1/1/08 means we capture the full GFC fall and the subsequent recovery. Basically, we are starting at the high point. Data in Indian markets are not realistically available from before 2006. So, all backtests start in and around 2007-08.
1 Like
This is some great work and amazing results!
I see the benchmark is Nifty 500. So is this the universe of stocks on which this strategy was run? NSE and/or BSE? Constituents of top-500 index? This may be relevant coz liquidity can be a big issue, just entry and exit can cause significant price movement to reduce the gains. So larger caps having good amount of liquidity is of importance if the idea has to be applied at an industrial scale.
Algorithmic trading is nothing new, it begs the question then why are fund houses still working the old-fashioned way. Esp. Mutual-funds who have zero switching costs, they can trade at will with zero tax (since only liquidation is taxed).
I have run multiple strategies live or have been tracking a few in my personal portfolio. Usually, as the strategies I run are long term strategies, drawdowns tend to be the same as we see in backtests. Intraday or very short term trading systems have the challenge of slippage which does not happen in this case.
3 Likes
Yes, liquidity is a major concern. That is why in real-life investing we need to filter out stocks with low liquidity.
The reason mutual funds don’t do it is many. My guess is as follows:
-
Lack of knowledge amongst the key fund managers: Most of the senior MF / PMS / AIF fund managers are 50+ and are completely clueless about quant strategies. They think it is some form of gobbledegook.
-
Indian markets are illiquid and lack depth: A large fund say has 10,000crs in AUM. Assume it needs 20 positions in the portfolio. That means 500crs per position. If you wish to keep your holding less than 1% of the company, then the minimum market cap you can target is 50,000crs. That limits your investment universe drastically.
-
A super-skilled discretionary investor can beat the market and any passive strategy: Once in a while, there will be a great investor with brilliant acumen who can beat the market and other passive strategies either by finding brilliant investments or by betting with high allocation in their big winners.
-
Everyone thinks they are the “super-investor” mentioned above: All discretionary investors believe they are better than the average even when the data says they are not. No one wants to believe that all the effort they put in that makes them look important like reading annual reports, talking to management, attending AGMs, questioning on concalls, doing channel checks all add up to nothing tangible and a passive index is doing consistently better than them
18 Likes
Yes, all very valid points! I am still a bit curious about this point:
Thanks!
Hi @basumallick
Thanks for sharing your knowledge on quant investing!
I am inquisitive if replicating the out-performance of these strategies on various sub slice of the market would be a good test of the system robustness.
eg: What will be the performance if we restrict our investable universe to only Nifty50 stocks and also benchmark against the same. This will alleviate any liquidity concern and also give an idea of the “size” factor contribution to total return.
I run nearly all my test portfolios on Nifty 500.
1 Like
I haven’t tried it. Right now just putting a volume and market cap filter is good enough for the capital level I deal with.
As, if and when I get to a stage where liquidity becomes a major constraint, then will consider such framentation.
The more you restrict the universe the more you will constrain the returns.
Another point to remember is that such strategies can show good returns in a backtest but real life may not mimic the past exactly and with new situations coming in the future, the returns and maxDD can vary (reduce) significantly. Another point to understand is that personal experience tells me that people get really really scared when the drawdown starts going over 15%. So, when ou are looking at a strategy and see 40% CAGR and 30% drawdown, you might feel that this is great and I will stay put, but in reality very very few people will be able to stay put in a system when the portfolio falls more than 20%.
4 Likes
Is this data backtested on current N500 constituents or you went back to reconstruct the N500 at different points in time to make the backtest survivor bias-free?
1 Like
Another point to remember is that such strategies can show good returns in a backtest but real life may not mimic the past exactly and with new situations coming in the future, the returns and maxDD can vary (reduce) significantly.
This is the point I wanted to stress on it. Very well pointed it out openly.