@sarthakkunar19_
Why wonder? This index has a long track record
https://www.niftyindices.com/indices/equity/strategy-indices/nifty200-momentum-30
18% cagr over 15 years
16.3% cagr over 10 years
7.2% cagr over past 3 years.
@sarthakkunar19_
Why wonder? This index has a long track record
https://www.niftyindices.com/indices/equity/strategy-indices/nifty200-momentum-30
18% cagr over 15 years
16.3% cagr over 10 years
7.2% cagr over past 3 years.
the result you have mentioned are all backtested results. They are not so-called live results. All of Nifty Strategy indices are relatively new.
@basumallick ji,
Thank you so much for generously sharing your knowledge.
One question I wanted to ask, by what percentage (a very rough estimate) should a momentum strategy outperform let’s say NIFTY to compensate for the transaction and tax expenses.
Thanks
I always think of returns in absolute terms. A very senior investor told me very early that one can’t eat relative returns!!
So if I want a certain return, say 20% CAGR, my strategy should help me reach that over time. How does it matter what NIFTY does??
@basumallick sir,
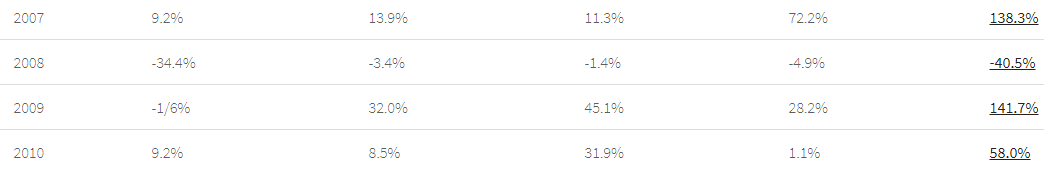
I was seeing the historical performance sheet on your website Quantamental - The System is the Edge, in the year 2008, Concentrating only on the down months , the 1st Quarter returns in 2008 were -34.4%.
The returns on monthly basis (Jan-Mar’2008) were all negative
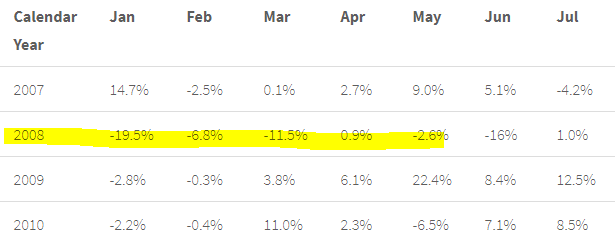
The -19.5% return generated in Jan’2008 remained the big loss till Sep’2018 where the system generated -22.1% loss.
These 2 were the only months (in the historical performance sheet) where the loss were more than 15% in a month, if we are discussing about stop loss on individual stock level or portfolio level, I want to know what was the SL decided for the historical performance posted on the website and also if it was considered on individual stock level or at complete portfolio level.
The backrest does not have a stop loss. The current system has graded stop losses, at both individual stock level and at portfolio level, along with a regime filter.
I am actually really interested and need answer to this question.
Do you have a stop loss incorporated now? And is the Stop loss based exit alert given in the quantletters? Has the stop loss reduced your returns (shown in the backtest) ?
Hope its okay to ask here…
We do have stop losses. But these are not static price based stop losses so cannot be pre-determined. They are dependent on multiple factors including regime stop losses (basically geek-speak for index-based stop losses). I only communicate it to subscribers if a stop loss level has been hit.
Using a stop loss usually results in a drop in performance, but it is a cut worth taking because once in ten times it will protect from catastrophic loss.
This is a great book for traders and investors alike. @hitesh2710 suggested I read the book sometime back. Unlike a lot of other books, this one is packed with practical advice from successful practitioners. Because it is written in a Q&A style, it is very easy to read and brings together the answers of all he 4 participants together so that you can understand the similarities and differences in their individual approaches.
Below are my notes & highlights from the book. They are a bit exhaustive and hence a bit lengthy.
The first thing I do is look at earnings released and news items that may affect my holdings, and I also look at premarket futures to get an idea of how the market will open. I then review all my current holdings and update my stops and set alerts; I set audio alerts on my buy candidates at price levels near my target purchase price and also at levels near my sell stops.
Everything I do is thought out; I don’t like surprises, so I try to work out as much as possible in advance so I don’t get blindsided and caught off guard. I do this work outside of market hours to remove emotion.
I usually don’t do much in the first 45 minutes of trading because there are many false moves and reactions to overnight news.
I know what and where I’m going to buy before the market opens, so there are no surprises, and I just act without thinking. I start in the morning by checking all my open positions.
Everything I need to know is based on the stock’s price behavior and volume; the rest is pure noise.
If a market is going to move, then big funds and institutions are going to drive it. The bigger players have to buy and sell often during days or even weeks. Individual traders have a significant advantage over the big traders, because individual traders can move in and out of positions much faster. So they can change direction very quickly when market conditions change, and to me, that’s a tremendous edge.
The big money is made in the longer-term moves.
Bottom line, if you hone your timing and talent to spot the setups and if you have the fortitude to stick to the rules, it doesn’t matter if you start out small; you have a true edge that few traders possess, especially if you do your homework every night and on weekends.
You shouldn’t be afraid of thinly traded stocks; you should embrace them. Some of the biggest winners are small companies that you’ve never heard of before. But you have to be careful and only trade a position size you can get out of safely. A small position is better than no position, especially if the stock has the potential to skyrocket.
All the biggest-moving stocks I’ve owned during the past 20 years, where I’ve made 95% of my money, were ones hitting new highs from very solid bases.
The best time to buy the large-cap names is coming out of a bear market or a deep correction. With small caps, I tend to trade them close to new highs because they’re less efficiently priced, so I don’t have to “beat the crowd” and try to buy lower.
By definition, if a stock is covered by many analysts and watched by thousands of traders, then it has a far less probability of being inefficiently priced and thus yielding a quick alpha move. It doesn’t mean the stocks shouldn’t be traded or purchased at certain times; but in general, if you’re looking for alpha, you should be discounting the larger capitalization.
It is rare when you have a market where you can have both longs and shorts. In a market that is trending in one direction, that’s the side you should be leaning toward. Markets moving sideways can be very tough to trade both ways.
Even though my intuitive feel is pretty good, I have learned not to trust my opinion, because it will eventually be wrong. If you have a strong conviction on a trade, it will be difficult to trust the market and divorce your idea.
I will only add to positions that are moving higher and performing well. Positions only become bigger with appreciation and follow on purchases after new bases are formed.
The overall market must be showing strength with higher highs and a significant portion of those market stocks marching into new highs as well. Many strong bases on the charts, as well as strong expanding earnings on a high number of those stocks, are critical indicators of the overall health of the market and ultimately my portfolio.
The only way to consistently outperform is to be concentrated in the names that are outperforming.
There should be a period of a week or more of very quiet and very tight price action before a stock makes a move.
Many of the best trades occur when you have fundamentals, technicals, and a bullish general market all in your favor. So I try to focus on companies that have solid fundamental and technical characteristics during a healthy market environment. However, life is not perfect. Stocks that set up well technically, in a manner I refer to as “unexplained strength,” are often good riskreward plays because they are less obvious and not as likely to be “crowded.”
So, yes, I will trade stocks with a lack of apparent fundamentals when the chart is really strong. Most of the time when I ignore surface fundamentals, the stock is in a very high-momentum situation, and the chart is saying that something really big is definitely going on.
I define an uptrend as a stock with its 50-day moving average above its 200-day moving average and both are trending higher. Even stronger uptrends can be defined as the 20-day moving average above the 50-day, and the 50-day is above the 200-day moving average.
The most important indicator is the overall market trending up with higher highs and higher lows, and the same goes for the stocks that I look to buy. Next would be a well-defined base and then the strength of the group.
A breakout is a stock emerging out of a base or sideways consolidation. I like a base to be at least four weeks or longer. As the stock breaks out, the volume should be larger than average. The volume should increase at least 25% or more. The best moves start with very big increases in volume of 100% or more.
You want a stock to rise on higher volume and pull back on lower volume because the buying and selling by institutions is what moves stocks in the market, and the institutions can’t hide the fact that they have to buy in size. The most important area to concentrate on is what volume is doing at key points like breakouts to new highs, breakdowns from bases, and even when a stock undercuts a previous low.
I want both the fundamentals and the technical characteristics of the stock to be in an uptrend. I have much more confidence in holding a stock that has good fundamentals than if I’m buying based solely on a good chart. There are so many stocks to choose from, why not go with the one that has the best characteristics.
I am usually more successful if I spend a number of hours researching the fundamentals, listening to conference calls, investigating the company’s website to really get to know where the company has been and its future plans.
You want to watch the general market but not to the point that you sell all your stocks when your indicators flash a downtrend.
I think most traders would do much better if they completely ignored the “market” or the major indexes and just focused on the stocks themselves.
Stock trading is about anticipating coming movements and then waiting to be proved right or wrong. Even if I turn bearish on the market while I’m holding longs, I will usually let the stocks stop me out. I don’t usually sell everything on my “opinion” of the market. I simply tighten my stops and let the price action take me out of the positions one by one. Very often a handful of my stocks will hold their stops, and I’ll even get through a market pullback still holding names I had before the correction began.
If things are working, I get more aggressive. When my stock trades are not working well, I cut back my exposure and the number of commitments. This is a very simple method but very effective. If you scale up when trades are working and scale back when things are not working well, you ensure that you will be trading your largest when trading your best and trading your smallest when trading your worst.
In a year, you really only need one or two really good stocks to have great performance, but you must handle them right. You must add to a stock after it has built a new base following its first move up. You can add to it again on subsequent bases. On a longer move, you can build the size of the position into 20–25% of your portfolio. A position of that size should only be achieved through price appreciation and by adding more on subsequent bases.
The problem about setting price targets is that the best stocks usually end up going a lot further than anyone expects.
I don’t usually make all-or-nothing decisions, especially on winning positions, but instead I scale in and out of them. If something has had a big move and is extended and looks like it is starting to pull back, I might sell a portion of the position, but I never want to lose a position in a stock that looks like a leader. Once you sell out the entire position, sometimes you can miss the next move higher.
During the beginning stages of a new bull market is the best time to hold, and in the late stages of a bull market—usually after several years—is the best time to trade shorter-term
During the beginning stages of a new bull market is the best time to hold, and in the late stages of a bull market—usually after several years—is the best time to trade shorter-term moves and sell into strength.
I also had to learn to practice patience. The fear of missing out is a strong emotion when trading. It is the root of many trading failures. I have two main rules: (1) no forced trades. (2) no big losses. You must develop “sit-out power,” the ability to wait for correct setups and not force action and take subpar trades.
Minervini:
@basumallick I am fairly new to technicals. So please pardon my ignorance ![]()
Could you help understand, what is the definition of a proper base?
Read about proper base in The Next Apple as well but couldn’t really decipher what it means.
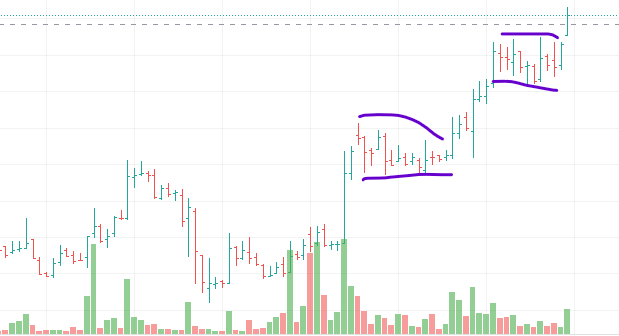
A base is an area of consolidation after an up move. For example, the areas marked are bases.
Interesting article on why we should never have a strategy that is targeted for a single index / stock / commodity etc. Mainly due to curve fitting… best is to have a strategy that works across similar underlying markets so that you know it is not sort of data mined
Out of the 14 months, 2 have been negative and 12 have been positive months, for the Quntamental Q30 strategy that I follow. If you ignore the daily fluctuations in the market, we have been in a bull phase that continues unabated. Month on Month returns over the last 14 months: (Return % of every month is on the capital at the start of the month)
![]()
While it is very important to follow the process and take what the market gives us without letting our emotions override investing decisions, it is also important to remember that market returns are lumpy in nature.
In trending markets, the strategy will make a lot. In a downward market, we will give back some portion of it. In a sideways market, we will bleed a little as the market takes its breath and before starting to move in one direction whether up or down.
What happens if you start at the wrong time and the market declines thereafter and the momentum doesn’t return for few months or several months?
Framed differently, the question is how long do you need to remain invested to gain a 100% probability of profit?
If past is any indication, that period could be anything from a couple of quarters to a couple of years. You must be willing to remain invested and follow the process with discipline throughout these periods to come out of the drawdowns, recover your investment value and then make a decent return on your corpus over a longer time frame of 2-3 year rolling return basis.
To put that into an example from the above table, if one only has a 1-month outlook, one could get anything between (-4%) to +18% return. But if one has a minimum 3-month outlook, the chance and magnitude of losses reduce. Returns between 3 months of March 20 to May 20 period is (-0.35%) whereas returns between 3 months of Feb 21 to April 21 is 34.06%. Stretch that time window to 6 months, a year, 2 years and you get the drift.
Future is not exactly going to mimic the past. The past does however provide an indication of likely scenarios. Based on data from the 2007 calendar year onwards, below are few inferences:
When the Corona crisis hit us in March 20, many of us thought markets would not do well for several months or quarters. In the second half of the year, many were still in disbelief that the market can’t go higher.
Over the last few weeks, many have been expecting the market to fall like last year. But Q30 has instead gone up 9% in a month like April 21.
To summarize, we should let the market tell us what to do rather than follow our own opinion. Remain invested for a minimum period for the strategy to play out and let the edge work for us.
The longer you follow the process with discipline, the bad periods and good periods even out and the edge of the strategy plays out and whatever the market will do in longer time frames, we expect to do better and by repeating that over and over again, we let the magic of compounding work in our favour.
Disclosure: This post, although completely based on how to approach quant-based investing, takes data for evidence from Q30, a strategy we run as part of the Quantamental advisory. This is purely for educational and academic purposes only.
Quantitative way of thinking is very critical in today’s day and age. For example, if we say an industry has high returns on equity, it is technically a meaningless statement. We should dig deeper. How do we define high? Is high to be defined in absolute terms or relative terms. If relative, relative to what and for how long? The moment you start making an effort to quantify things, you will see a lot more clarity. You will need to spell out your assumptions. There is no place to hide behind vague terminology.
There is a lot of discussion on the market being in bubble territory. Again, we should stop ourselves and ask, what is a bubble? How do we quantify a bubble? There are a lot of academic papers on quantifying bubbles but suffice it to say that there is no universal definition or quantifying methodology of a bubble. So, we should try and define what we would think a bubble would be in our own terms. A bubble is when a particular asset price goes up significantly over a short period of time without the underlying cashflow (if any) of the asset changing meaningfully.
So, from a stock market perspective, we could think of a finding out how many stocks are trading say 2x-3x above their 200-day moving average. Another similar approach could be to look at the number of stocks that are above 3 standard deviations of their 200-day moving average. Couple that with a valuation metric like say 3 times PE or PEG or EV/EBIDTA over their mean for 3-5 years. And voila, you have a framework to understand what a bubble looks like. It may not be perfect, but you can keep refining it over time. But your understanding of markets will increase significantly more than listening to random people bandying such terms all over the place.
Hi folks ,
Naveen here. I have been very keen in learning and building a quant system for myself and have been taking some time to know the prudent way to build a ones own quant system. After research I realised that the best way is bottom up i.e if you have any inclination to programming then choose the language and the available libraries in that language.
Have been evaluating between Pysystemtrade, Pyalgotrade, Backtrader . I found Pysystemtrade to be much more easily to work with and good amount of help in github with code repository(personal choice).
Information that I pulled from reddit (https://www.reddit.com/r/Python/comments/7thmfp/best_framework_for_systematic_trading/)
I guess the most important of all is the quality of data and that comes with price. I am also looking into IB charges on data and shall evaluate and update the same here. Though I did find a website which is beginning to work on offering quality data at an affordable price and currently it focuses on US data only ; https://icebergh.io/ .
Would like to know others view points on the same.
@basumallick and people who did bIn the backtesting you did, did you handle look-ahead BIAS.
In other words, if you create a watchlist of today’s NIFTY 500 members and then do backtest like for the past 10-15 years, then there can be two problems:
Please share your insights or any members in this forum who did backtesting or maybe a data provider who handles this scenario
FYI… I am using Amibroker for backtesting
One easy way to get away from this problem is to use a combination of marketcap and volumes traded to weed out smaller thinly traded companies. You do not need to then have the problem on index constituents.

Great thread. Trying to digest as much as I can.
Nifty Alpha Low Volatility 30 has some data now apart from the backtesting. And it would qualify to be called a Quant system, I guess. So, What is your opinion on this strategy index?
Doesn’t it sound the best combination for a passive investment?
As a retail part time trader, can one create a screener similar to this say with Sortino Ratio and Std Dev?
Thanks once again for the wonderful thread.
Nifty Alpha Low Volatility 30 is a factor index with two factors – Alpha and Low Volatility. Alpha is calculated on an annual basis based on outperformance over the Nifty 50 index. The second condition is to have stocks that preferably have lower than index volatility.
The strategy picks 30 stocks from a universe of 150 large and midcaps so there should be fewer problems of liquidity and slippage. It is rebalanced every 6 months.
I don’t have any specific opinion on this particular index. For people who are investing in a broad index fund like Nifty 50 or Nifty Next 50, this may not add any significant value. Most of the Nifty strategy indices are interesting and as and when they are available as ETFs or index funds, they can be looked at for passive investing.
The answer to your question on if this is the best combination then I would unequivocally say it is not. There are better well-diversified options available that give far superior returns than this strategy.
You can definitely create a screener for standard deviation but you need to know what you are looking for. Sortino Ratio is an output parameter and it may not be simple to use it as an input variable.