
Is there any broker who provides a simple way to automate such quant investment (screening and rebalancing) without manual supervision? I am vaguely aware that brokers provide programming APIs to make this possible, but is there a simpler/direct way?
Practically not possible to get historical Nifty 500 constituents in India, so we have to make do with what we have.
Survivorship bias issue does not come in this kind of a strategy simply because the stocks that will get picked in this kind of a strategy will not be the bottom-of-the-barrel kind. Survivorship bias is more relevant in strategies which are mean-reversion based.
The way to remove this in the backtest is to run it on all stocks and put a marketcap and volume filter.
5 Likes
A lot of new-age brokers have APIs. I know Zerodha does. You can get the coding done by people who do such work. But in the real world, it need not be automated simply because the transaction frequency is once a quarter or a month or something like that. Coded systems are really needed if you are doing intraday.
2 Likes
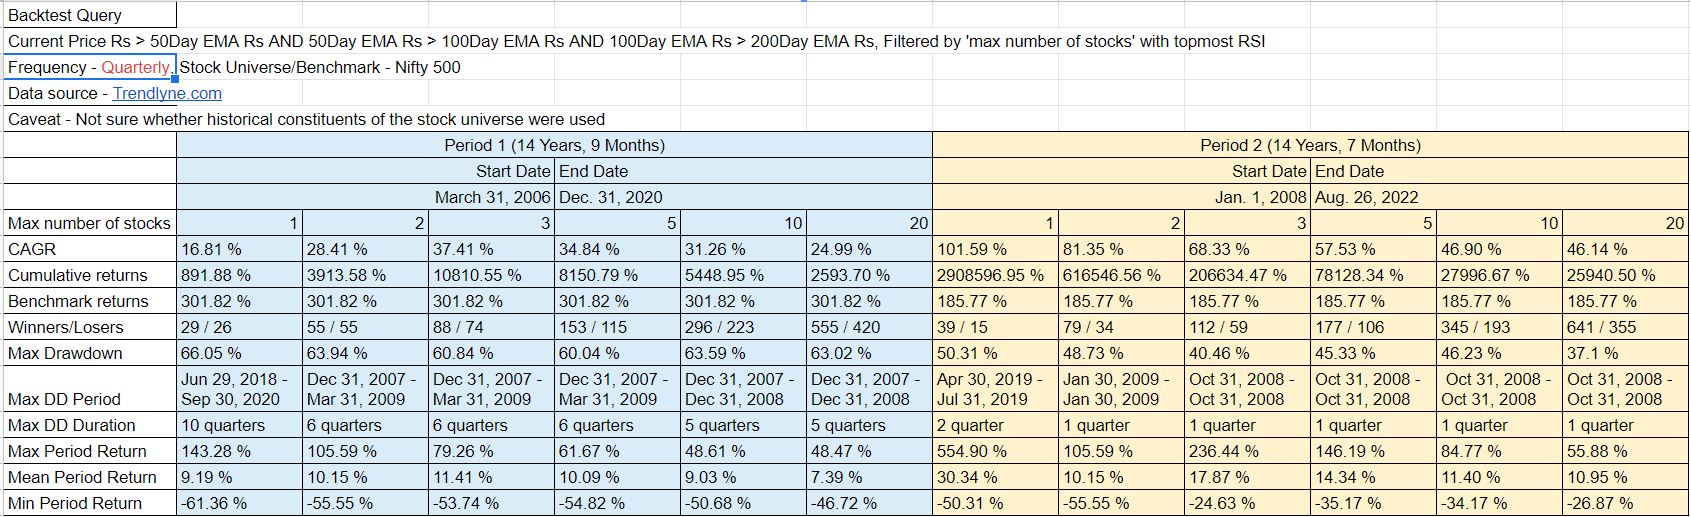
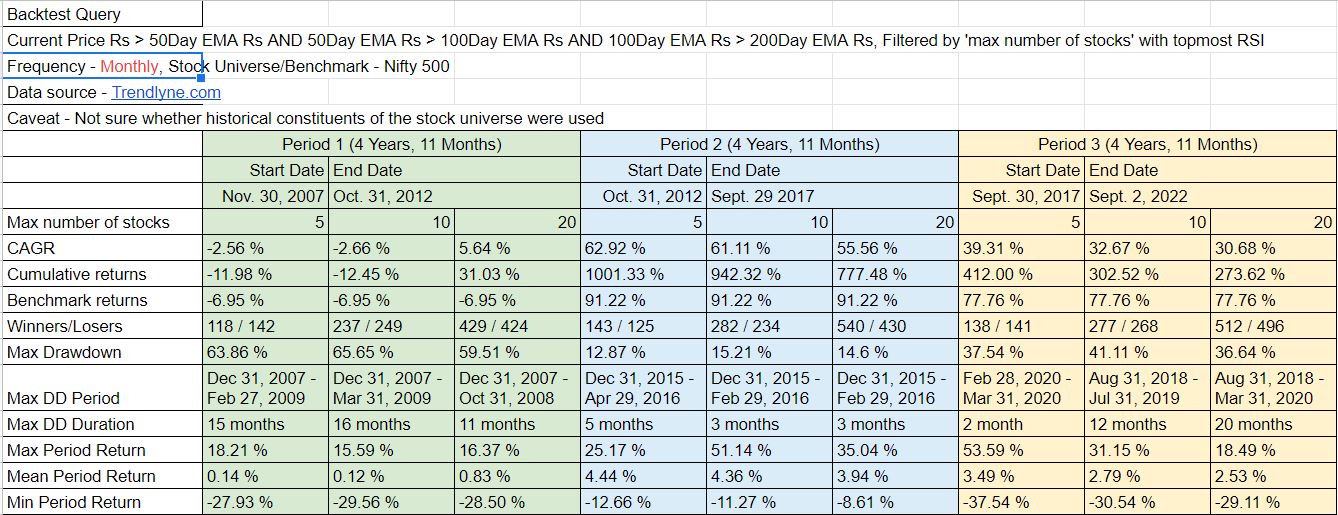
Thanks for the reply. I backtested your EMA + RSI quarterly strategy on Nifty 500 universe using Trendlyne. ( had to break-up into ~4 yr periods due to plan limitations). What I observed is that every quarter has approx 15 entry and 15 exit among the top 20 filtered stocks. For someone like me, who is not a full time investor (working on second-hand research and borrowed convictions) and who would like to try out quant based investing in real life, a quarterly churn of 30 stocks itself is slightly discouraging. A simple screen-rebalance-invest kind of interface would go a long way in popularizing quant approach.
Zerodha already has basket concept, but not very useful for automation. Also their screener (technical) is in another product called Streak, which is targeted at intraday traders. Hopefully soon they’ll integrate both and provide a simple interface in Kite itself.
But I’d like to thank you for sharing all your insights and data here on the forum.
2 Likes
Smallcase is the only option I know. But at an individual level, it does not solve the problem that you are highlighting.
My effort is more towards trying to educate both myself and others about the possibility of using simple strategies to generate reasonable returns using quantitative analysis.
Once that is done, will start looking at maybe seeing the options available for building simple tools to automate such strategies for individuals.
2 Likes
Basu bhai, If non-proprietary filters you mentioned are already established and backtested, is there any need left for the historical data for the rest of us?
This is purely an academic question, and I understand that response to it cannot be taken at face value to start investing from tomorrow. I am curious on the value of historical data for weekend investors like me, who just want to do small quant based experiments using regular screeners.
This is a list of changes in Nifty 500 till 2018. It can be used to construct historical constituent of any time. This was taken from old NSE website when I was experimenting with simple momentum strategy on Nifty 500. I couldn’t find the new data in NSE website.
Nifty500 Historical Constituents.xlsx (147.0 KB)
9 Likes
I am not sure I understood the question. If you are planning to invest using any quant model, either you need to create one and test it or use an existing one like say the ones given above. But you will still need some environment where you are getting the updated stocks every quarter. Also, these strategies need to be made more robust in terms of drawdown management (through stop losses), re-entry post early exit etc.
1 Like
I’m presenting some data compiled from my backtesting using Trendlyne.com. Please draw your own conclusions.
4 Likes
In this trend following quant system when using RSI based sorting as filter are we looking for the highest RSI group (near peaking out) or the bottom ones (possible uptick due to trend reversal)?
Indeed, survivorship bias is fundamentally likely not significant, also past 13.3 years only 2.15x churn of constituents in Nifty-500, on top of the quarterly churn of strategy seems not that big a deal.
Relative & Absolute Momentum
We hear the term momentum investing a lot. Most of us don’t really understand it. What we understand is in momentum investing we buy stocks which are in momentum, meaning, stocks that are going up. But, there are different types of momentum. Absolute (Time Series) and Relative (Cross-Sectional) momentum are the two main types. Let us understand these two with two very simple examples.
Imagine you are taking a train ride. Relative momentum is wanting to be in the fastest train. So it compares the train speed with all other trains and tells you the one which is running fastest and you jump on to it. Sometime later you check again. And find out if it’s still the fastest. If some other train becomes faster, you switch to the other train. So in relative momentum, we rank the stocks based on their speed and quality of momentum relative to other stocks and select the top ones. And keep switching by checking periodically.
In comparison, absolute momentum just checks if the train is running and running fast. It doesn’t compare with any other train. If the train slows down, we get off. If the train stops we get off. This train may be among the top ones on relative momentum criteria or it may not be. We are okay as long as the train is moving ahead at a decent speed. If we can’t find such trains we wait.
What does it mean in practical terms? The entry and exit points and holding periods differ basically. To take a simple example, in one of our strategies that I use, we will exit a stock even if it is going up but it has become slower than other stocks. Due to this difference in entry and exit and holding period, it is expected to give a diverse set of stocks and the equity curve is expected to behave differently providing us with a diversified combined basket of stocks which has a smoother equity curve.
It may appear the same because in any case, we are buying stocks which have been going up. The first sentence of Leo Tolstoy’s novel Anna Karenina reads, “Happy families are all alike; every unhappy family is unhappy in its own way”. Stocks also behave in a similar manner. They all look similar when they are in their bull phase. But when studied deep, there are a hundred ways of filtering them with different results.
Gary Antonacci’s book Dual Momentum is a good read to explore this subject in a bit more detail.
12 Likes
@manhar sorry to be blunt, why this excel in the Quant investing thread and what it does?
1 Like
@S.A.B With my limited understanding I thought Quant investing was investing on the basis of mathematical calculations. I didn’t know it need to be only on historical data.
The excel I shared projects the future cash flow of a company on the basis of certain assumptions. There after different valuations model could have been used to calculate the share price. There after a sensitivity and scenario analysis could have been performed to calculate different share prices on different assumptions.
Sorry I have deleted the post.
1 Like
@manhar The idea of a quant system is to use current or historical numbers in a rule-based system to buy and sell stocks. Whenever you are forecasting, it means you are using human judgement which is not rule-based.
4 Likes
I had the same doubt while starting out the analysis, so did couple of backtests with bottom RSI as well as RSI near 70 (not the topmost, but maybe trending to reach there). Results were not particularly encouraging. I am not sure about why it is so.
In my backtesting, I am yet to find a strategy without wild drawdowns and probable long drawdown periods. So I haven’t got the conviction to bet real money money in any quant system yet. Can you please elaborate and give some tips on the drawdown management and stock re-entry criterion which can be used in such systems?
You have done really well in your studies, and your backtest numbers seem to match the claims, so I do not understand the concerns! Your back-testing clearly states using highest RSI, so thanks for answering my doubts! ![]()
Focusing only on the quarterly re-balancing figures, “Period 2” (yellow shaded) looks to me a perfect match for the claims vs results. ![]()
Drawdown will always happen, there is simply no escape, when entire market bottom falls off and stays so for a while. Only frequency, duration and size can be controlled. This strategy follows a strong positive trend and stays invested, so that is bound to happen anyway. Looks very good in these aspects also, since it seems to not perform worse than the general market in these drawdowns.
If no (or lesser number than total holdings) fresh stock picks are found for the strong positive trend criteria then exiting previous positions instead of holding them can help escaping the market falling. Though trying to get the timing right will mean much higher churn, or maybe a discretionary triggering. ![]()
1 Like
I believe this will be very true with my investing temperament. Even though I have individual stocks upto 40% down in my current portfolio, it will be difficult to digest and stay put when the whole portfolio is down >40%. And to keep executing the churns thrown out by the strategy for 5-10 quarters, will require loads of conviction. That is why I believe I should have a defined and practical drawdown management strategy, something non-discretionary, before investing using this strategy.
Regarding the two periods in the backtesting - please note Period 1 includes GFC of 2008 but excludes the 2020-21 bullrun, and Period 2 excludes at least one quarter of the 2008 GFC. (I think Trendlyne excludes a quarter if start date doesnot align with a month end). And the variations in benchmark returns vs portfolio return across the two periods suggests that this strategy can be highly successful in bull markets, but not so much when markets are low or stay flat. I agree it generally is above the index, but is it a practical strategy is my apprehension.
The whole idea for me to put up these strategies (and I will try and put up more such in the near future), is that people can get an idea of what kind of strategies are possible and practical. These strategies are definitely not something you can take and start trading the next day. They need a fair deal of refinement.
Also, there is no strategy in the world that will work all the time. All strategies work only sometimes and that is why most professional system traders run multiple strategies concurrently to have a smoother equity curve.
4 Likes
Marcellus started a new Quant fund of 10L investing. This could be their new leg for growth.

Interesting to watch how they execute this one.
Disclosure: Not invested in any Marcellus PMS Funds, Though hold lot of stocks from their portfolio’s
4 Likes
Yes, I read about it. Like I mentioned in the first post in this thread, quant is not a catch-all phrase. Quant system can be designed for all types of strategies. All indices are essentially quant systems.
Over time, quant systems would do better than average Investors but worse than very good ones. Also, the type of strategy employed is more important.
With the excellent performance of the Quant mutual fund, I guess you will see a lot more of similar look-alike or sounding-alike funds being launched now because no one wants to be behind on the asset gathering race ![]()
10 Likes