
Would you be interested to put it on GitHub and take it forward. I have been thinking to invest some time on models.
1 Like
Yes there is one library called yahoofinancials, by using this you can get the historical data ,like historic price data,200 day moving avg data,50day moving avg data ,etc.
1 Like
Hi,
My model is a simple momentum and still WIP phase. I shall probably publish result for backtest for analysis by experts here.
Till then you can refer to following github codebase already in public space contributed by experts in fields.
1 Like
Great work!
But what are the return expectations of the people trying to use quant strategies? When i say returns, i mean post tax returns. Other than taxes, there is brokerage and other charges too… Then the strategies have to work consistently for a decent period, otherwise one will keep creating and testing the strategies… It appears to be a highly intellectually stimulating pursuit, especially for people those who have coding knowledge, but they also need to pay attention to returns per unit of effort.
Frankly, this is not something an individual investor should get into. Others, those who have a product or service to market, it is different thing.
Finally, not taking away anything from people those who have done the hard work… Really appreciate the effort. It was good to learn about basics of this stuff…
Regards
You are falling vicitim to the popular notion of quantitative investing being equal to high or higher frequency trading. That may not be the case. There are a lot of long term traders / investors who follow a quant based approach.
The returns that people who have good quant strategies can be significantly better than what they would have done if they had no strategy. Secondly, it need not be an either-or approach. For example, I invest in my discretionary long term portfolio, I do positional trades and I follow a few quant strategies.
In terms of returns, I can only speak from my personal experience. The returns are significantly good to continue to follow my quant strategy and also explore other strategies.
9 Likes
Agree with @basumallick
Algorithms ensure you are disciplined. More recently I use simple pine scripts to enter and exit. Here are my rules.
- Only trade in companies that have consistent ROCE of 24% plus in 3-5-7 year time frames.
- Only trade in companies above 20,000 mcap with the odd exceptions (but not below 10k cr mcap)
- I have programmed simple criterias(nothing complicated) with basic Pine Script. I take 15-20+% and move out.
I do not take a loss most of the time, unless there’s another opportunity. Believe me, when you have high ROCE criteria in large compounding companies, it is possible to employ good trading strategies with not too much risk.
5 Likes
Hi,
I have created a simple strategy on quant. The strategy is mostly based on price momentum where ranking is created based on weightages of few technical parameters. Few stocks are purchased on from top of ranking and sold after a stipulated timeframe.
Following is the rolling return from 2010 to 2020(till date). Can I request @basumallick and anyone to comment and point to me to major failure/improvement point which should worked upon further?
I have used blueshift platform to code & backtest the strategy. I guess adding fundamental parameter should give better result but till now I couldn’t use any fundamental api(yfinance etc.) to return required data.
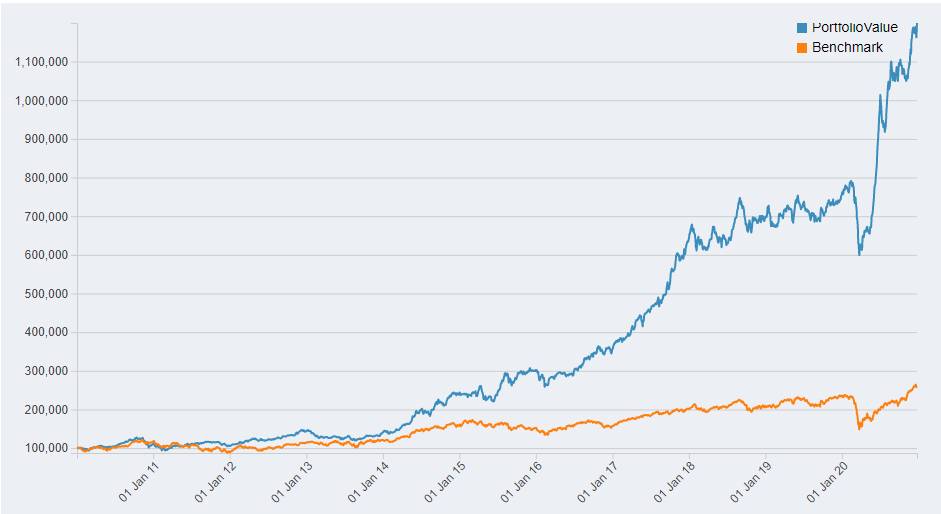
Performance Metrics for 2010 to 2020 backtest
Annual Returns24.43 %
Cumulative Returns1099.79 %
Annual Volatility15.53 %
Sharpe Ratio1.48
Maximum Drawdown-26.76 %
Omega Ratio1.29
Sortino Ratio2.14
Skew-0.5
Kurtosis3.03
Stability of Timeseries95.56 %
Following is year wise return.
| Year | Return | Sharpe | Dropdown |
|---|---|---|---|
| 2009 | 94.72% | 3.19 | -13.34% |
| 2010 | 10.34% | 0.67 | -21.25% |
| 2011 | 1.72% | 0.2 | -10.21% |
| 2012 | 31.99% | 2.69 | -5.00% |
| 2013 | 1.50% | 0.18 | -14.53% |
| 2014 | 75.27% | 3.15 | -10.95% |
| 2015 | 22.29% | 1.11 | -15.49% |
| 2016 | 20.07% | 1.3 | -11.79% |
| 2017 | 69.41% | 3.61 | -7.38% |
| 2018 | 9.20% | 0.67 | -11.61% |
| 2019 | 6.49% | 0.59 | -9.05% |
| 2020 | 44.92% | 1.69 | -32.61% |
I again sincerely thank this forum and specially @basumallick for giving pointers to blueshift and sharing very valuable knowledge. It helps a lot.
4 Likes
With the limited info that you have shared, this looks to be a decent strategy. Try to tweak the parameters including reset period so that you get a higher Sortino ratio.
1 Like
Simplest momentum screen on Screener. Copy-paste the below equation to the screener. Just rank the stocks in descending order of 1yr returns. You can add other filters to your liking. Then pick the top 10/20/30 as per your liking. Rebalance weekly/monthly/quarterly as per your liking.
Return over 1year > 0
In most cases, you will get junk microcap stocks, which will kill you sooner rather than later. To get to a respectable set of stocks which have a chance of working over time, you will need many filters to weed out the junk.
4 Likes
Yes, Abhishek Bhai. You are absolutely right.
Here is my full screen. I didn’t share it initially because one has to understand and build these filters themselves.
Percent from ATH > -25% AND
Market Capitalization > 1000 AND
Return over 1year > 0
Per cent from ATH is a custom ratio I built in the screener. One can build it yourself using the formula,
(current price/high price all time - 1) * 100
I would love to use a daily volume traded filter as well, but screener only provides volumes for the past week.
3 Likes
Percent from ATH > -25% looks similar to the Mark Minervini template where he looks for breakout after consolidation. Although he also likes close>sma200 and sma150 > sma200
1 Like
I have been writing short notes on different topics related to quant based and systematic investing for the quantletter we publish every month as part of quantamental. Some of the notes deal with the real-world challenges of following a systematic portfolio and some deal with various theoretical constructs.
I have extracted the notes and compiled them in one place for easy reading.
A Year of Quantletters.pdf (1.5 MB)
13 Likes
Random Thoughts:
• The more optimization that is done, the less likely the system will work well going forward.
• People can generally handle half the maximum drawdown they think they can handle. For instance, if an investor decides before implementing a system that he can handle a 30% maximum drawdown, when real money is on the line, he will start to panic, and likely quit or change the system, at the 15% drawdown point
• The importance of the entry is directly related to the time you spend being invested in a trade. If you are someone who has trades lasting weeks to months, you don’t need pinpoint accuracy on the entry. An entry a few days early or a few days late will probably not ruin the profitability of your strategy. An entry a few points higher or lower will also not ruin your strategy. The main idea is to focus on the broad trend for longer period holders.
18 Likes
Thanks Abhishek…Really good compilation…
Behaviour aspects of investment is somewhat underrated and I believe that’s best part of Quant investing…
Very insighful read… Thanks Absheik. I had been backtesting various strategies from the past 6 months. Some thoughs i have are:
- The system yeilds better results if its simple
- Too many criteria acutally results in a less CAGR results. Without backtesting my thinking was if we put too many criteria we will get better results.

@basumallick can you please eloborate as to how you use the ATR Based Trailing Stoploss. One Observation i have is Parabolic SAR gives early trailing SL in comparision to ATR.
I have 2 questions egarding recently launched nifty 200 momentum 30 index fund by uti.
1.Those who are into quant systems, how do you find the criteria used for creating the nifty momentum index.
- By what percentage approximately would the higher churn reduce returns compared to a more stable index like the nifty.
I am asking since this fund (or others like it in near future) could be a simple way to allocate part of one’s portfolio to momentum theme without buying individual stocks.
@basumallick is your strategy available on smallcase. If not do you have any plans to launch it on smallcase?
The UTI index fund tracks the Nifty strategic index of the same name. You can see the details of the index and how it is constructed from here -
https://www.niftyindices.com/indices/equity/strategy-indices/nifty200-momentum-30
Here is the performance chart that is available on the NSE site.
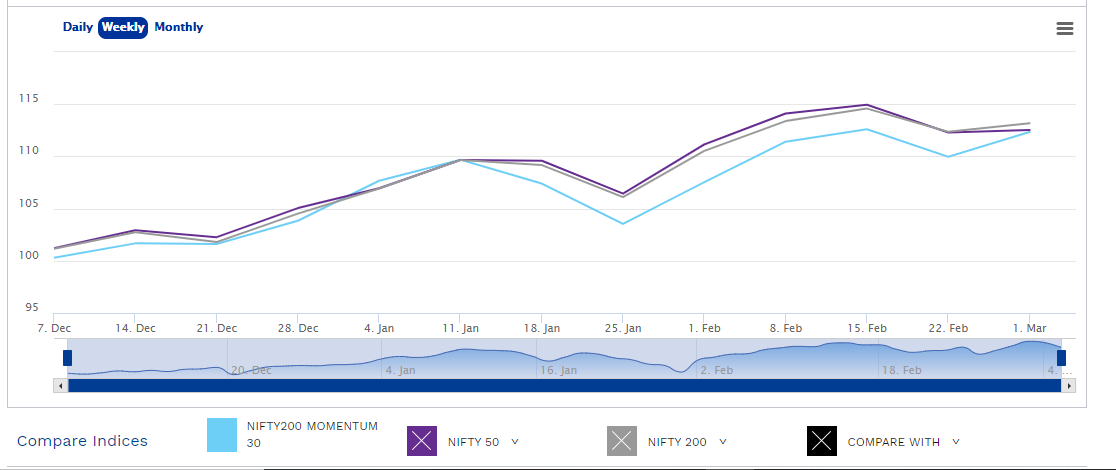
https://www.niftyindices.com/market-data/advanced-charting?Iname=Nifty200%20Momentum%2030
If you see the comparison of the index with Nifty 200, you will realise that someone is making a lot of effort for nothing!!! ![]() There is no perceptible performance difference. In fact, in the last 1 year, you would be better off just investing in a normal Nifty 200 fund.
There is no perceptible performance difference. In fact, in the last 1 year, you would be better off just investing in a normal Nifty 200 fund.
2 Likes
I use the lower ATR range as a stop loss. Also, I most of the time use a 10,3 ATR trailing stop instead of the regular 14,3. This can vary based on the time horizon of the trade / investment I am making. The higher time horizon I have, the more leeway I give to the stop loss.
I personally don’t use Parabolic SaR but it can also be used as one major benefit it has is that it can be used for time stops.
3 Likes