
Look at BackTrader and Zipline. I have been personally using Zipline for quite a while. It’s a little bit of a pain to get Indian equities to work with it but works really well with tools like PyFolio which will chart returns, drawdowns etc beautifully.
4 Likes
Never used backtrader. What is support for data feeds for Indian markets?
Backtrader is gaining in popularity these days. The community in github is very active. Regarding Indian equities, there is no direct support. I download data from external sources (e.g yfinance) and then massage it into backtrader/zipline.
1 Like
Zipline is worth it especially in terms of analytics it provides with pyfolio. We are exploring to integrate it on our platform inuvest.tech, by providing users to build models using UI but facing certain technical difficulties of it being built on older versions of python. We are yet to ingest Indian stocks data but in case any of you want to try it on US data would be happy to provide the access.
2 Likes
@basumallick Can you provide some strategies as examples to explain how a quant system can be built?
Interesting read. @basumallick thoughts? https://papers.ssrn.com/sol3/papers.cfm?abstract_id=3614509
1 Like
I am using backtrader actively. One need to be familiar with OOP (object oriented programming ), otherwise learning curve could be steep. Once one get familiar with its logic and architecture, one can backtest strategy and deploy the same using backtrader. Very well written and completely open source.
PS: I haven’t tried zipline so far.
1 Like
@sougataG This is fairly straight forward and simplistic paper (more an article than a paper, IMO) which concludes that momentum works. Momentum is a well established across markets and across time periods. There is a lot of information on the fact that momentum has worked for over 100 years.
5 Likes
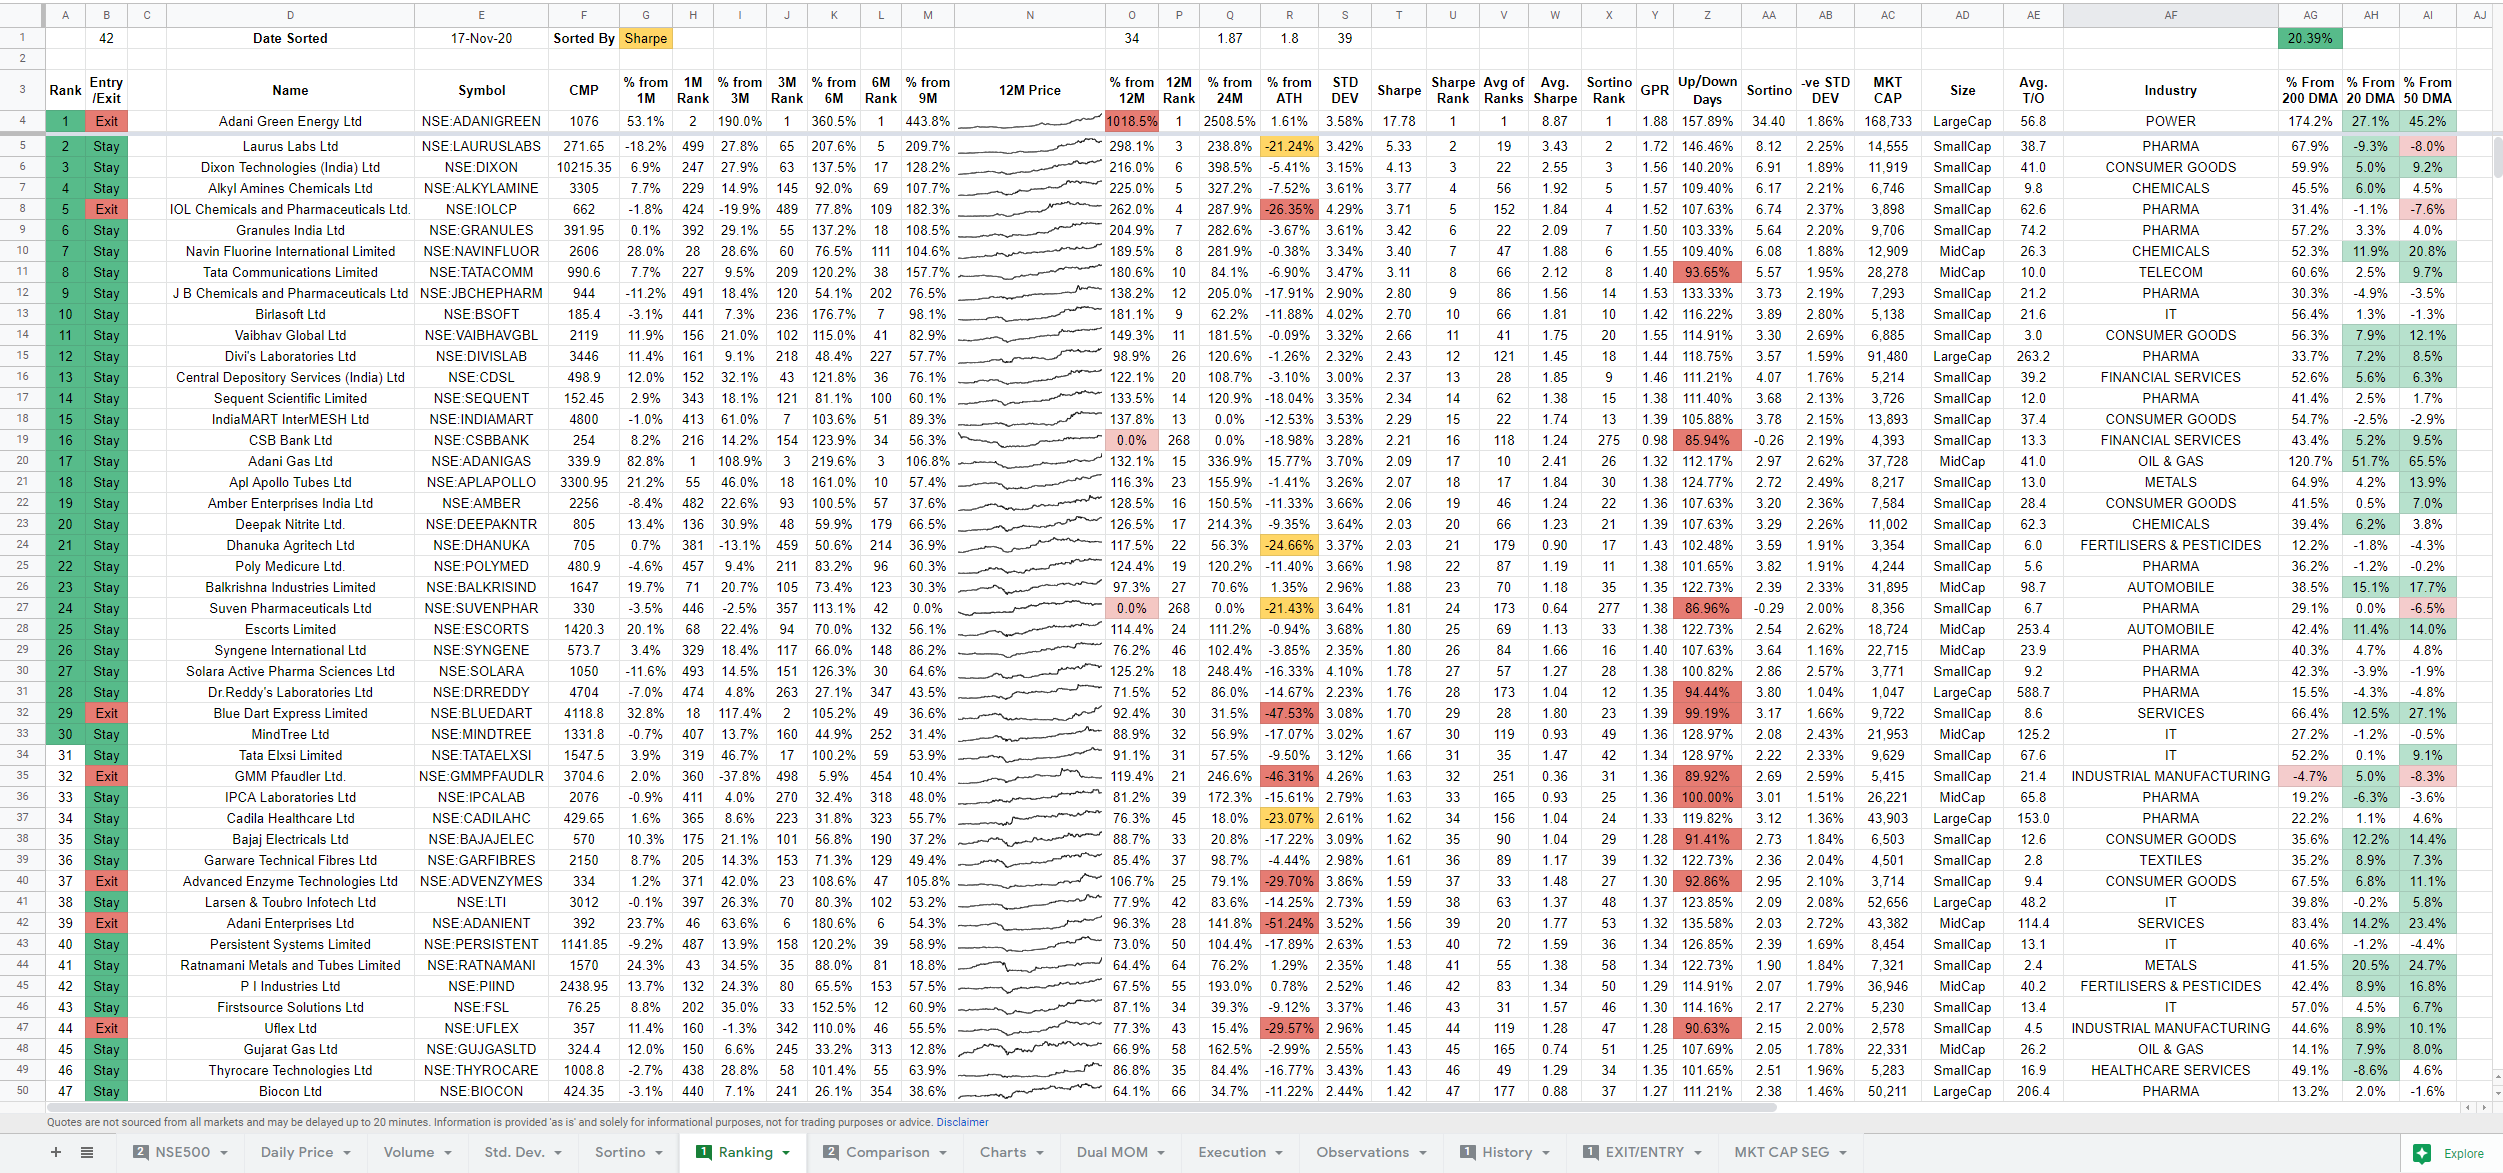
A sample for those who want to build their own DIY momentum system.
Live Dashboards -
10 Likes
Came across this webinar on Quant Investing on youtube today which is directly relevant to this thread.

The most important takeaway for me was about “style diversification”. Being a value investor, there are so many stocks, where the value investor lens will end up rejecting them either because they are overvalued or because you are not comfortable with management or you simply don’t have confidence about growth prospects and so on. Basically there is a corner of the market, where you won’t be able to find value. Having some allocation to such straregy ensures that part of the capital benefits from those stocks where you won’t be able to invest based on value investing criteria. Ultimately investing is about returns and not about falling in love with stocks where you find value. Like someone said, there is always a bull market going on somewhere. Quant is a way to find out where and have some participation there no matter how illogical it may seem to a traditional value investor.
19 Likes
What a great webinar Basumallick! The strategy explanation and psychology part was superb. Thank you so much for sharing your knowledge and experience. Must watch for all class of investing people.
3 Likes
@basumallick How do you take care of survivorship bias ,do you have access to a database with delisted stock data ?
2 Likes
Is this true
2 Likes
Same question. Please do let me know, I searched a bit on NSE/BSE they have listed then unlisted stocks information and/or other way around. @basumallick
Hi @basumallick,
How important is Sharpe Ratio as per you in Quant Investing? I have been backtesting some strategies however the best of them had a low Sharpe ratio of 0.6. I understand from some searches that anything above 1 is good, but does it really matter?
Thank you
Swapnil
In the strategies I use, survivorship bias is not an issue since it is unlikely that stocks that are market leaders would have suddenly disappeared. Getting good quality data in Indiais a major challenge and we have to make do with some level of approximations and work arounds.
1 Like
If you have followed anything on this thread you would have realized that there is no one cohesive “quant” investment type. It is not like a factor in factor investing like value, growth, momentum etc. Quant funds can follow any approach. So, for the economist to say that quant funds have had a bad year is foolish! For example, my own Q30 strategy in Quantamental.in advisory is up 50% since we started it on 1st march 2020 and included the massive fall in the first month. If despite that it is doing so well, I can’t say that quant funds are doing poorly.
Some funds following some particular strategy may be doing poorly, but that will always be the case. Someone somewhere will be doing well and someone somewhere will do poorly.
5 Likes
Hi Swapnil,
Sharpe ratio is a risk adjusted return measure. Basically you try to ascertain how much additional return you are getting above the risk free rate for the risk being taken. Where risk is calculated based om the standard deviation.
I have two issues with this ratio:
- It considers both upside and downside performance as the same.
- It considers standard deviation is risk
You can look at Sortino ratio which is better than Sharpe ration because it takes care of my objection number 1 as it only considers downside change for the standard deviation calculation.
Personally, I give more emphasis to CAGR returns, max return, max drawdown and standard deviation of returns.
2 Likes
Hi,
Thanks much for this note. I tried hand in blueshift using python code and zipline library. It is pretty good considering ease of use and NSE data already available.
Can someone guide is there any api/library available for getting fundamental data?If Yes, are historical data also can be available like zipline gives technical history data.
Again, I thank for this forum and pointer to blueshift.
1 Like