
@agarwalk2 I am not sure I understood your question. If you are asking, what prevents the severe drawdowns, it is the fact that there are essentially 2 things working here. 1) A stop loss that takes you out of the market if there is a severe crash and 2) an automatic sell after 3 months. If the market continues to be weak, you do not get any stocks in the subsequent month(s) so you are possibly out of the market when it is at a very weak position.
3 Likes
@pratyushmittal @ayushmit Do you have any plans to add backtesting feature to screener? The data you have can power these quant strategies from part-time retail investors like me who wants to do it himself/herself. I would be willing to pay a good amount as subscription for this service and I think others will be too… Please consider
6 Likes
@alexander- sorry, no such plans as of now. Backtesting is complicated and would need focused efforts towards the same.
Wanted to understand the difference between Quant investing and momentum investing…
Is momentum a subset of Quant? While researching to learn this, came across a lot of stuff on people using automated logic based systems on momentum investing. This person, Alok Jain seems to be practising this successfully in India for sometime - https://weekendinvesting.com/. I am also planning to read this dual momentum book by Gary Antonacci…
Returns from such systems are good, but I am conflicted in putting my hard earned money in such a system as it feels like gambling  Do any of the others here face such qualms? Value investing seems so much more logical compared to this… Just because something has worked for 15-20 yrs, is it enough to believe it will work in the next 15-20 yrs? (Eg: P/BV was a great indicator till end of 1990s but then lost its power to provide additional returns apparently)
Quant investing is a style of investing where you are purely dealing with numbers. Please see the first few posts in this thread to understand the basics of quant investing.
Momentum is one factor that can be used in quant investing. There are value quant models, quality quant models etc.
Momentum investing actually has a far longer history than value investing. There are documented 200 years of history with the momentum factor. Here is a good article on the history of momentum investing.
There are a number of people who run equity based momentum portfolios including me. Weekendinvesting, Mystic wealth, Capitalmind and Quantamental.in (which is the one I run) are the ones I am aware of. There are differences in each of the systems so when one talks about momentum it is not a catch-all phrase.
For example, I use a type of momentum along with trend following techniques that works well for a period of 3 months and I have a buy-once-a-month approach. There could be many variations on portfolio selection, timeframe, entry and exit strategies etc within the broad category of momentum.
8 Likes
There is never ever a situation where some style will work seamlessly forever.
To expect that is stupid. value, growth, quality, momentum etc etc all will have their time under the sun.
As an investor, there are mainly 2 ways we can think…
-
focus exclusively on one style and become extremely good in it so that when it works you maximise your returns and then during the other period when it does not work, you don’t lose much.
-
you have some way of diversifying your style and adapt to the underlying market theme of the period.
Most investors try to be in the first camp. Think of it like this - either you choose to be a Sunil Gavaskar or you choose to be a Kapil Dev. Very rarely you can be a Gary Sobers who is equally proficient in both batting and bowling. (well, I stopped watching cricket after Sachin retired, so maybe the examples are a bit old!!)
6 Likes
Coming to your analogies, I am a big Kapil Dev fan and would like to point out that he was a fantastic cricketer in all forms of the game. His record in test cricket was for all to see and his one day game was proven by the fact that he was the first captain who brought home the One day world cup against all odds, whiile carrying cricketers, some of whom were not suited to the one day game.
Coming to the styles of investing, the idea should be to try and keep learing new things all the while and keep getting better at the style currently in vogue and be prepared to adapt to new style as and when it catches fancy. Luckily for most investors, most styles make comebacks every few years and the basic fundamental and technical styles do not go out of fashion too frequently.
I myself am a momentum (funda and technical) investor but have seen a few friends (very few mind you) who have successfully practiced the art of value investing in its true sense. I have been after him to share his knowledge on VP but he does not seem to be taking the bait.  I know he is a regular on VP and hence knows who I am hinting at and takes my message to heart and starts posting again on VP frequently so that a wide audience is benefitted by his expertise.
19 Likes
@basumallick Great stuff, thanks for starting this thread on quant. I have been practising pure momentum models for myself. Would write about it in a few days. One of the challenges I have faced is getting the data while backtesting it for years.
Your stock universe is Nifty500, in your backtest is this fixed list on a particular day or you have the new list on every rebalance period? Why I’m asking is because roughly 30% of the stocks which were part of NSE500 in the last 15 years, we do not have the data available them (rather I was not able to get the data). These would be those companies which got delisted, winded up or taken over. We can argue with some comfort that these wouldn’t get picked up in your model as the qualifying criteria would take care of these stocks to disqualify during your rebalance period as they might not perform so well. But since your rebalance period is 3 months anything could happen.
My next question is when did you rebalance your model before the start of the market fall in March? Just trying to understand your drawdown.
1 Like
When I started researching I used NSE500 data refreshed every time it was published. But nowadays I am looking at mainly at volume-marketcap combination to rank my own set of top 500 stocks.
For Q30, I have a monthly buying and quarterly reset model. So, I buy every month for 1/3rd of that allocation. The publicly published Q30 (www.quantamental.in) has had a drawdown of around 5% if I remember correctly in March.
Interesting article on how lookback period is drifting to shorter timeframes - https://seekingalpha.com/article/4240540-optimal-lookback-period-for-momentum-strategies#:~:text=The%20optimal%20lookback%20period%20for,lookback%20period%20performed%20the%20best.
The Jagadeesh and Titman recommendation of 12 m momentum is also not holding apparently…
Sample period of just 11 years (2009-2019) is too small in back-testing world, imho. And this period has seen one of the best bull runs in the market history. This period has hardly seen any meaningful drawdown/correction. So 3-month look back performing better than 12-month is not surprising at all. In my view, a good testing period should capture at least 1 full market cycle of trough-to-peak-to-trough for any strategy. This full cycle data is missing in the example ‘handpicked’ by Mr. Hantea.
Experts recommend that the best way to predict the future is to bet with the base rate that is derived from a large sample.
I like James O’Shaughnessy’s below lines:
“strategies that demonstrate a consistent ability to outperform over the long-term tend to return to doing so just as everyone has lost faith in them. Take this message to heart if a long-term strategy you are using has a few bad years. Chances are, it is getting set to rebound.”
5 Likes
Read ab[quote=“rupaniamit, post:91, topic:35451”]
“strategies that demonstrate a consistent ability to outperform over the long-term tend to return to doing so just as everyone has lost faith in them. Take this message to heart if a long-term strategy you are using has a few bad years. Chances are, it is getting set to rebound.”
[/quote]
Read about P/BV. It was a very good predictor of outsize returns for over half a century but has underperformed the index consistently in the last 20 years. Why? Because the nature of businesses changed (from manufacturing to technology/IT) and P/BV is no longer a good measure of valuation. EV/EBIT is the hot value metric now.
Hence it is important to understand the reasons. Has something fundamentally changed in the last 12-15 years. Yes. Algo trading. Information explosion. High frequency trading. Broadening of market participation with lots of discount brokers. Ease of investing through click of a button. Growth of Index investing (where the higher a stock price gets, index buy them and increase the price further) etc. Is it possible a combination of some of these things have changed the ideal momentum lookback period? Possible…
I am currently trying to figure out a system for myself based on information available publicly and start testing with some Rs 1/2 Lakhs in the next 1-2 months.
Below is what I have read:
Momentum in the short term (past week, past month) is mean reverting. Momentum in long term (> 1 yr) is also mean reverting while momentum in intermediate term (2-12 months range) is trending and is the basis for momentum investing. Within this 2-12 month period, 8-10 months lookback is the sweet spot and a combination of different lookback periods in the intermediate term works the best.
Combining momentum with another factor such as value, size, volatility etc. improves returns significantly in backtesting apparently.
To make outsized returns, it is most important to figure out an exit strategy (minimize whiplash and maximize right exits) and that is where I am reading up now. It is also important to have rules on when to not be in momentum and stay in cash/Liquidbees/InvIT (when market is sideways or negative) as drawdown of momentum is more than the market in general.
3 Likes
@basumallick @hitesh2710 just brain storming this idea.
If I had to generalize, then, momentum technofunda investors pay more attention to the P&L (growth) and put less emphasis on balance sheet. My reading of deep value is that very little emphasis is placed on growth, if at all.
On the other hand deep value investors pay more attention to balance sheet and focus less on growth (P&L).
The above 2 pointers are not to say that deep value folks don’t pay attention to P&L / Growth. They do.
Just that in deep value style of investing, more weight is given to the balance sheet and less to the P&L statement.
Conversely, technofunda investors give more weight to growth/momentum while giving lesser weight to the balance sheet.
Now, let’s suppose the deep value style of investing starts to dominate the market fancy at some point.
Wouldn’t those same deep value stocks start showing up on momentum screens? Logically they should.
If yes, then doesn’t momentum style of investing provide the best of both worlds? 
7 Likes
I have a question. Google finance seems to have a good amount of historical data… I was just trying out here to get 1 month’s day on day price data and data completeness atleast seems to be there to a good extent- https://docs.google.com/spreadsheets/d/1b7Q5gFRXztITLSAgRFeu3JMJP1IWMqXeiDgqDb7h8sU/edit#gid=0
If I just download few bhav copies from BSE and NSE for different years to get all the names and codes of companies that went bankrupt over the years also, why can’t I just use google finance data for all the backtesting? This should be pretty simple and a few days’ worth of work.
Is the data correctness in google finance bad? Anyone who knows, would be grateful for an answer. Thanks.
2 Likes
@basumallick Awesome stuff. Some really good insights on momentum investing in the article.
Here are some pointers that I found useful.
Richard Driehaus took the momentum torch during the 1980s. In his interview in Jack Schwager’s The New Market Wizards, he said he believed that money was made buying high and selling higher.
That means buying stocks that have already had good moves and have high relative strength – that is, stocks in demand by other investors. I would much rather invest in a stock that’s increasing in price and take the risk that it may begin to decline than invest in a stock that’s already in a decline and try to guess when it will turn around.
In 1967, Robert Levy published Relative Strength as a Criterion for Investment Selection. Levy found that there was “good correlation between past performance groups and future … performance groups” over 26-week periods. He states:
the [26-week] average ranks and ratios clearly support the concept of continuation of relative strength. The stocks which historically were among the 10 per cent strongest (lowest ranked) appreciated in price by an average of 9.6 per cent over a 26-week future period. On the other hand, the stocks which historically were among the 10 per cent weakest (highest ranked) appreciated in price an average of only 2.9 per cent over a 26-week future period.
But a mere month later, Narasimhan Jegadeesh and Sheridan Titman published their seminal work on momentum, titled Returns to Buying Winners and Selling Losers: Implication for Stock Market Efficiency. Within they demonstrated:
Strategies which buy stocks that have performed well in the past and sell stocks that have performed poorly in the past generate significant positive returns over 3- to 12-month holding periods.
But momentum went long misunderstood and ignored by academics.
While momentum’s philosophy of “buy high, sell higher” may seem counterintuitive, prevailing explanations identify its systemized process as taking advantage of the irrational behavior exhibited by investors.
Over the two decades following momentum’s (re)introduction, academics and practitioners identified the phenomenon as being robust in different asset classes and geographies around the globe.
2 Likes
Momentum investing catches a situation where the stock price and business momentum is in sync. Sometimes even though the business momentum is strong, the price refuses to budge and tends to remain sideways for long periods of time. That part of problem is taken care of by the momentum investor guys because they buy on breakouts and ride the momentum. If the breakout fails, they are prompt to exit till the time they see momentum again in same stock (or go to some other stock where clear momentum is there.)
The other aspect of problem is that the price tends to keep going up and we cannot figure out any fundamental reasons as to why stock price is going up. This often happens when sometimes markets know more than us or often happens due to froth. If it is due to the froth, it will subside and stock price gives up most of the momentum once trend is broken.
Coming to value vs growth investing, the discussion is too much theoretical and endless to get into. I personally tend to leave that stuff to the acaedemicians .
I have personally seen that whenever the investment thesis is very simple and can be put up in few sentences, or few paragraphs, chances of investment success is very high. So I am always on the lookout or simple investment theses.
24 Likes
https://drive.google.com/drive/folders/17FX9ps3CKAEoU8UgVVey7EsQ4V0hoisj?usp=sharing
Sharing my repository of research papers on factor-based investing.
10 Likes
I have got price data from ~20 years for companies > 100 Cr mCap (~1450 companies) and listed on BSE using Google finance. Below are the links
- Top 100 companies by mCAP - Top 100 BSE - Google Sheets
- Next 500 companies by mCAP- https://docs.google.com/spreadsheets/d/1DHZ4zlEPtAyiuQeSTCBqBXrHLlLhiM3t-eW4ErX2uvg/edit#gid=0
- Next 500 companies by mCAP- https://docs.google.com/spreadsheets/d/1jN7iy5cXZoH5aT8LOI_VEqKlM07P9aX1WZ0SuqzW-eQ/edit#gid=0
- Last 350 companies
https://docs.google.com/spreadsheets/d/1D4guPvatT3SFidlvgd3jrjExuHf3yOo4xKtgf9HGbV4/edit#gid=0
Divided it into 4 sheets as Google sheets seems to have a limitation on number of cells in a single workbook. You can download and combine it in MS Excel / R etc.
Over the next couple of months, during weekends, I will be doing some analysis using this price data and will share in the forum. Anyone else interested also, please chip in. Let us learn together.
I am planning to check the following:
- What is the best momentum strategy which will maximize returns? What will be the drawdowns in these scenarios? [For buy rules, I will use variations in lookback periods used, # of stocks in the portfolio, different relative and absolute momentum rules. To exit stocks also I will use both absolute and relative criteria to capture loss of momentum]
- In the best case return scenarios, what intelligent rules can be applied to minimize drawdowns when market crashes happen? Understand the trade-offs in applying these rules.
Note:
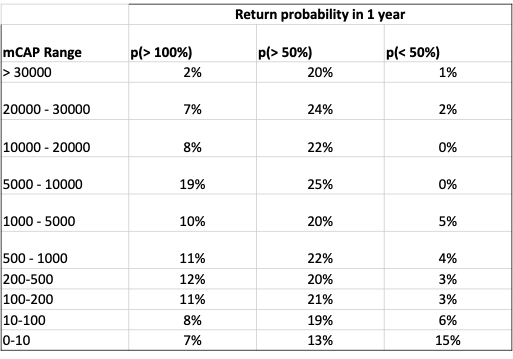
I looked at last 1 year data and below is the insight:
- mCAP between 100 Cr to 5000 Cr seems to be the sweet spot for getting multibaggers. Below 100 Cr, there is just too much randomness i.e. > 15% probability of losing more than 50% of value in a year
- Surprisingly, the probability of multibagger returns is not very different in the 100-1000 Cr and 1000-5000 Cr mCAP range. I would have expected the 100-1000Cr range to have more probability of multibaggers
Need to look at more years to generalize but take this insight for what it is worth
This is past 1 years data:
Return probability in 1 year
13 Likes
Hi,
I am following Valuepickr for 3 years now and heavily benefitted from knowledge perspective and would like to thank everyone who contributes here.
Is it possible to share which software/tool and programming language are generally used in beginning for model design and back testing?
Thank all again,
Prasenjit
There are many tools available. If you are doing only using price-vol data then tools like Metastock, Amibroker etc are very useful. If you use both fundamental and technical then you can use tools like Blueshift from Quantinsti (https://blueshift.quantinsti.com/) where you can backtest on both US and Indian equities. Primarily Python is used. Some used languages like R or Java or C++ but python is by far the most common and has a very large set of packages built for it.
For those interested in learning, https://www.quantopian.com/ has great resources and tutorials. Also, there are a lot of courses on coursera.org on quantitative finance or python for finance.
Hope this helps.
17 Likes