
Thanks Abhishek for nice article. What should be the ideal frequency of running Algo. You can run it every minute or every hour or every day or every month. Any input ?
Is there a website from where we can gather the above charts or have you made the charts yourself? i just wish to know the source
Completely depends on the strategy you use. Typically you will design a strategy based on your preference of time period. For example, the time period I am most comfortable with is monthly and quarterly.
1 Like
Custom charts on chartink.com
5 Likes
Kotak Quant Fund…
Very detailed and thorough presentation.
They also shared Portfolio Construction Process & Kotak Quant Model and NSE Equity Index Values ( available in forms and downloads).
Kotak Quant Fund-Presentation.pdf (1.7 MB)
4 Likes
@basumallick Sir,
This is a great thread and sincere thanks for sharing the immense knowledge.
I am trying to develop a model for myself to transition to quant from discretionary stock picks. Will you be able to share your thoughts on following pls.
-
I prefer filtering the stocks only from Nifty 50/Midcap 50/Small cap 50 indexes (with 50,30 and 20% allocation) as I want to stay within index. Stock selection (Max 10) could be based on highest Alpha. While I need to do back test, wanted to know the opinion(s) on this approach pls?
-
You did mention the exit based on stop loss, is there a simple method to arrive SL in quant world? (Instead of considering fixed SL say 10%/20% etc.)
-
Let’s say if the stock is in F&O, is that a good approach selling the OTM calls to generate some additional returns? (Asking this since there could be a sizeable margin available and can do martingale if needed)
Thanks Much.
1 Like
You can definitely select any universe of stocks as you wish or a combination of a few as you have mentioned. I have a friend who runs a fairly large capital pool of some private clients using only Nifty 50 as the universe.
There is no easy way of defining stop losses. The most common quantitative methods are as follows:
- Using ATR (takes care of volatility in the stock)
- Using a moving average (for example, stock closes below 20 or 50 day moving average)
- Fixed percentage (the easiest method)
- Using other indicators like RSI, MACD etc (like RSI going below 30 or MACD crossing below zero)
I haven’t tried using F&O in my quant systems. Mainly because of my lack of knowledge and competence in F&O and also because I have found non-index options are mostly illiquid except for very large stocks. Maybe someday I will learn enough to try some experiments.
Nowadays, my experimentation is on commodities on MCX ![]() (I have to keep trying something new in life!!)
(I have to keep trying something new in life!!)
2 Likes
State of the Markets
Note: Why do we need to understand the state of the markets?
The state of the markets is like the “pitch” in a test match. The captain needs to read the pitch and then decide on the playing eleven. For example, if it is a turning wicket, you may wish to play an additional spinner. Similarly, based on the state of the market, you might wish to change your allocations or stock selection.
One of the ways in which market health can be measured objectively is by monitoring the market breadth. It is purely data-based, unbiased and objective. Like any other indicator, it needs to be evaluated in sync with many other factors together and never in isolation. However, it is a good metric to keep track of. As of now market breadth is strong.
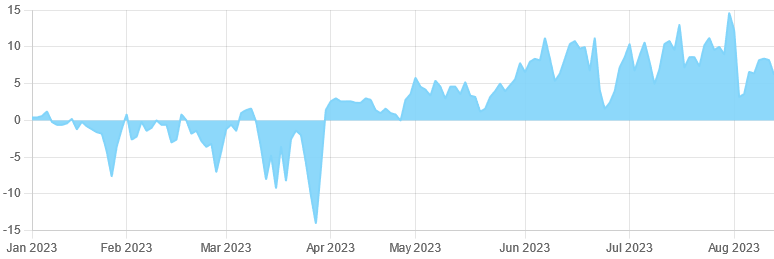
No of stocks hitting new 52 weeks highs has cooled down but it continues to be much higher than no of stocks hitting new 52-week lows (Universe Nifty 500).
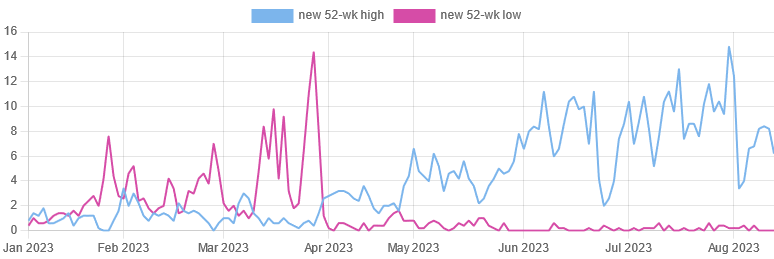
Therefore the net new 52 highs and lows are continuing to remain strongly positive. (Universe Nifty 500).
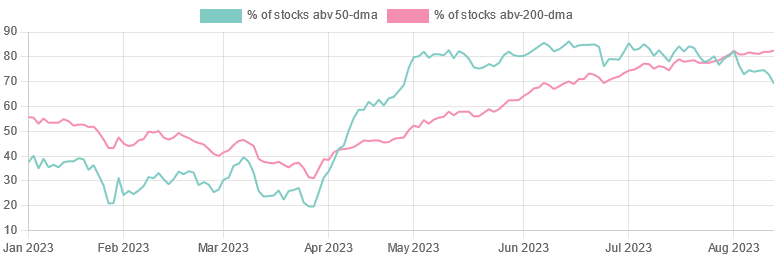
% of Nifty 500 stocks above key long-term moving remains elevated.
Factor Investing - A basic introduction
As an investor, it is important to have some grasp of factor investing. If you hold a portfolio of stocks, the return it generates is due to something. This something is the reason for the return. The return generated could be because the stocks are paying handsome dividends or maybe because they are blue-chip companies. These reasons are known as factors.
We all do factor investing, either knowingly or unknowingly. Investors buy cheap stocks. That is the value factor. They chase momentum stocks, the momentum factor. Some investors prefer growth, the growth factor and some others may prefer smallcap stocks, the size factor.
Factors in use
Individual organisations, mainly large quant firms, have defined their own factors. For example, MSCI has defined the following factors in their process.
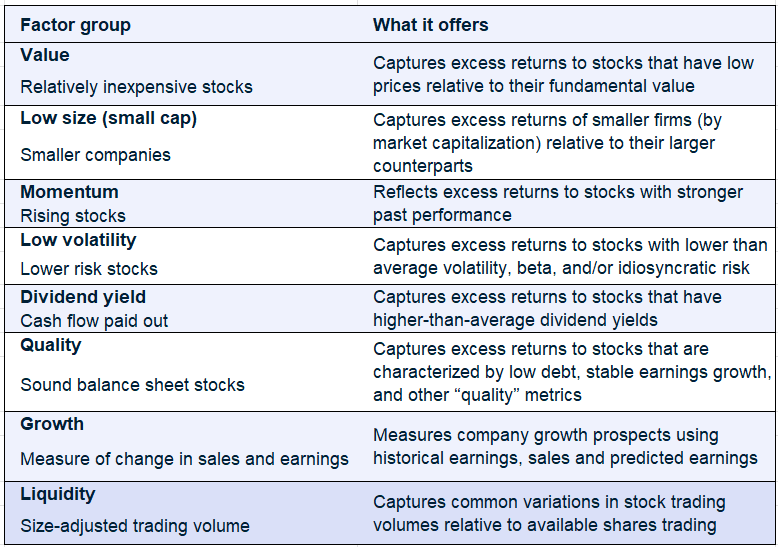
Factors can also be defined at a macroeconomic level with determinants such as GDP growth, inflation, interest rates etc being considered as defining ones.
Multifactor Models
In real life, we rarely invest if only one thing is going for us. We need more. In comes multifactor models. So, you might be interested in stocks which combine growth and quality together. Or momentum and liquidity. Or Value and Dividend Yield. Or low size, growth and momentum. The combinations can be many. But the idea is that we look for more than one factor to be in our favour when we search for stocks to buy.
NSE Nifty has rolled out strategic indices and has four defined factors - Quality, Value, Alpha and Low Volatility. It has created both single and multifactor strategic indices that you can look at.
The multifactor indices are:
- NIFTY Alpha 50 Index
- NIFTY Alpha Low Volatility 30
- NIFTY Alpha Quality Low Volatility 30
- NIFTY Alpha Quality Value Low Volatility 30
Use of Factors in Quant Investing
In India, most people equate quant investing with either high-frequency trading or momentum investing. It is neither. These are small subsets of the quant investing universe.
I personally prefer using those quant factors, which augment my own investing process. So, momentum, mean-reversion or multifactor models like quality+growth+momentum are where I try to focus on.
Some references if you wish to learn more on this topic:
https://www.blackrock.com/us/individual/investment-ideas/what-is-factor-investing
19 Likes
Some additional information and articles about factor investing in the thread " Factor investing & available passive instruments in india
1 Like
Hi, my question is on the re-balancing timeline for a Quant portfolio.
I have gone through a few quant/momentum based smallcases, and it seems that most monthly rebalancing ones have beaten the weekly rebalancing ones, on all timeframes. Especially, in a sideways market, the weekly ones have given 0 to insignificant returns b/w 2021 mid - 2023 mid.
Weekly: Pros
- Quickly captures a trend.
- Exits quickly on fundamental news, bad earnings etc.
Weekly Cons:
- Volatility, sideways movement. Bad returns.
- Transaction costs, hassle managing it on a weekly basis.
Monthly Pros:
- Reduces volatility. Many times stock doing well for 2-3 days don’t do well for next few days and so on. But they will be in Momentum Radar for Monthly time frame. Ex: AngelOne
- Low transaction costs
Monthly Cons:
- Fails to capture major news or events, turnarounds. Ex: Momentum in Adani stocks post Election result.
Momentum in IT stocks in Mid of December due to positive on US exports. - Late into the trend, especially during Earnings season.
I already invest in individual stocks, and am considering a Quant based strategy as an alternative to Quant Mutual Fund holding. I definitely won’t be able to track earnings result and sectoral trend for 10-20 stocks which are part of my Quant portfolio. Regardless of that being a smallcase or picked on my own quant model.
1 Like
@Ascendant The period of rebalance essentially depends on the strategy. As you have already pointed out there are pros and cons in any period you choose.
One thing that people forget when they talk about quant or algos is that a strategy is an extension of the beliefs of the creator of the strategy. For example, I am, at the core, a long-term trend-following investor. I will always prefer strategies that are slightly on the longer timeframe unless I specifically want to exploit a shorter timeframe anomaly or opportunity.
This is why I typically prefer monthly or even quarterly timeframes. In my experience, the shorter the timeframe, the more statistical (technical-based) info becomes important. If you stretch your time horizon to months, quarters or even years (like the Magic Formula has a yearly rebalance), you move to the fundamental side more. The reason for this again is that there are more fundamental data points in longer timeframes.
8 Likes
@basumallick ,
hello sir,
I normally use momentum indicator as Average of sharpe returns of 3months, 6 months and 12 months on the small cap and microcap universe.
Instead of using average of these three time periods ,
If for ranking I use only 3 months sharpe returns or just 1 month sharpe returns, what difference it will make? And which one is more desirable from returns point of view?
1 Like
What is Trend Following?
Trend following is an investment strategy that seeks to capitalize on the sustained movement of prices in a particular direction, either upward (bullish) or downward (bearish). Traders use this strategy to identify and ride trends until the trend reverses.
- Trend following relies on the following:
- Price action is the primary indicator (technical analysis is heavily used).
- Trades are usually medium- to long-term in nature.
- Stops are used to protect against large losses.
- The strategy assumes that trends persist due to investor psychology and market inefficiencies.
- Common Tools and Indicators:
- Moving averages (e.g., simple or exponential moving averages).
- Breakout strategies (e.g., 52-week highs or lows).
- Trendlines and channels.
- Relative Strength Index (RSI) and Average Directional Index (ADX).
How is it different from Absolute Momentum?
Trend Following seeks to profit from sustained price movements in a particular direction (up or down). It involves both long and short positions, depending on whether the trend is upward or downward.
For example, a trader might use a 50-day and 200-day moving average crossover system. When the 50-day MA crosses above the 200-day MA, they go long; when it crosses below, they go short.
Main Proponents of Trend Following
- Richard Donchian: Often called the “Father of Trend Following,” he introduced the Donchian Channel and popularized systematic trend-following strategies.
- Ed Seykota: A pioneer in computerized trading systems, featured in Market Wizards by Jack Schwager.
- John W. Henry: Founder of JWH & Co., he utilized trend-following strategies to become one of the world’s leading commodity traders.
- Paul Tudor Jones: Known for applying trend-following methods with discretionary trading.
- The Turtle Traders (Richard Dennis and William Eckhardt): Famous for teaching trend-following principles as part of their experiment.
Summary
Although people sometimes confuse trend following and absolute momentum strategies, they are distinct. A trend can still be in place even when momentum has started to reduce or even reversed. Usually, momentum strategies are shorter term in nature in relation to trend following strategies.
17 Likes
What is a Markov Model?
A Markov model is a mathematical model used to describe a system that transitions between different states over time, where the probability of moving to the next state depends only on the current state and not on the sequence of past states. This property is known as the Markov property.
Imagine you’re playing a board game. In this game, you move between different squares on the board (these are the states ). Where you land next doesn’t depend on where you’ve been before—it only depends on the square you’re on right now. That’s what a Markov model is about: it looks at the “now” to figure out what might happen “next.”
Markov Model in Investing
A Markov model can be used in the stock market to help guess where stock prices or market trends might go next based on what’s happening right now , without worrying about how they got there.
You’re watching a stock, and it can be in one of three states :
- Going up
- Staying the same
- Going down
Now, you notice a pattern:
- If the stock is going up today, there’s a 70% chance it keeps going up tomorrow, a 20% chance it stays the same, and a 10% chance it starts going down.
- If it’s staying the same today, there’s a 50% chance it goes up, a 30% chance it stays the same, and a 20% chance it goes down.
- If it’s going down today, there’s a 40% chance it goes up, a 30% chance it stays the same, and a 30% chance it keeps going down.
These percentages are the transition probabilities of the Markov model.
Practical Uses of Markov Model
- Predicting Trends :
By looking at the current state of a stock (e.g., “going up”), you can use the probabilities to guess what’s most likely to happen tomorrow. Over time, this helps investors decide when to buy or sell. - Market Behavior :
Markov models can also analyze how different market states (e.g., “bull market” or “bear market”) change over time and predict what’s likely to happen next. - Risk Management :
It helps investors understand the chances of a stock entering a “bad” state (like going down) and adjust their portfolios accordingly.
Summary
Stock prices don’t have a perfect pattern—they’re unpredictable and full of ups and downs. But the Markov model can give us a rough idea of what’s likely to happen next, based on what’s happening right now.
24 Likes
Hello, your explaination of Markov Model is insightful, can you please give an example of using the model to evaluate any quant product.
Also while studying more on quants I have come across terms like VLRT framework (Mutual Funds India - Quant Fund, Quant Investments, Quant AMC), MAGIC framework, coffee can rule (Past, Present and Future of Rule-Based Investing). Can you please share some insights on these frameworks and which of these can drive better returns.
2 Likes
One interesting way to use Markov Model is to use something known as a HMM (Hidden Markov Model).
HMM assumes:
- The system has hidden states that we can’t observe directly (like “bull market” or “bear market”).
- We can only see some observable signals that depend on those hidden states (like daily returns or volatility).
- The hidden states evolve over time using a Markov chain — meaning the next state depends only on the current one, not the full history.
The model works by learning the typical behavior of each hidden state and how likely the market is to move from one state to another (e.g., from bull to bear). It uses past data to estimate the transition probabilities and the average return/volatility for each state. Once trained, the model can look at recent returns and calculate the most likely current regime, along with the probability of switching to another regime soon.
This helps investors adjust their strategies dynamically. For instance, when the model detects a bull regime, one might invest more aggressively; if it signals a bear regime, it may be better to reduce risk, hold cash, or hedge.
These are mostly proprietary models / frameworks used by various funds. Globally, a lot of such acronyms are used more for “marketing” than actually making investment decisions ![]()
4 Likes
In my journey to learn more about investing, I have started reading up and listening to many of the veterans in the business who have made their fortunes in quantitative, systematic, technical trading and also in long-term investing.
Today, I will delve into the learnings from Larry Tentarelli. He is the Chief Technical Strategist and Founder, Blue Chip Daily Trend Report and a technical prop reader himself.

-
Larry Tentarelli’s Background and Trading Evolution:
- Larry started trading in 1998, growing up fascinated by the stock brokerage business due to family involvement.
- Initially focused on fundamental analysis (e.g., Warren Buffett, Peter Lynch) but transitioned to technical analysis, particularly after reading Jack Schwager’s Market Wizards book.
- Struggled for the first 10 years, noting it was a “developmental phase” due to a “conglomeration of different types of styles and time frames”.
- Discovered trend following after reading Jesse Livermore’s “Reminiscences of a Stock Operator,” which taught him to focus on catching “the key move” rather than every single market fluctuation, and Michael Covel’s “Trend Following,” which introduced him to systematic trading without fundamental analysis or prediction.
- Began with a simple 20/120 moving average crossover system in 2007, but found it “lagging on the exit” and later stopped using it.
-
Trading Style and Systems:
- Larry uses reactive technical analysis, waiting for price action rather than predicting.
- His trades are generally longer term, often holding winning positions for a year or two.
- He does not use fundamental analysis or traditional technical analysis (e.g., chart formations, Elliott Wave).
- He employs three distinct trading programs/systems, each managed in a separate account to ensure independence and avoid micromanaging positions:
- Daily Close Over 200-Day Moving Average: A basic entry for longer-term trades, requiring only price above the 200-day MA.
- Breakout to a New 52-Week High: Another simple entry that is easy to scan for.
- Momentum-Based Pullback Strategy: Shorter term (60-90 days for him), involving an oversold pullback into a rising key long-term moving average (50, 100, or 200-day) with a full stochastic momentum filter.
- He filters stocks by market cap (over $2 billion) and average daily volume (over 1 million shares) to focus on more liquid institutional names. He also filters for higher beta industries.
-
The Four Legs of Trading:
- Larry views trading as having four essential components: entries, exits, position sizing, and proper psychology.
- He states that if any one “leg” is removed, the “table still isn’t going to work”.
-
Emphasis on Entries (and what’s more important):
- While entries are important (he assigns them 25% of the overall equation), Larry stresses that traders put “way too much emphasis on only the entries”.
- He learned that the entry signal is maybe 10% of the equation and not the key to riches; experiments (like Tom Basso’s random entry) showed profitability with correct position sizing and money management make more of a difference.
- Instead, success comes from a program conducive to one’s personality, efficient execution, learning to undertrade, proper position sizing, and effective risk controls.
-
Exit Strategies and Management of Winners:
- People struggle most with overtrading and managing their winners properly.
- Larry’s approach is predetermined: entries, exits, position sizing, and risk are all established beforehand to avoid emotional decisions “in the heat of the moment”.
- Exits are primarily based on moving averages, mirroring the entry signal. For instance, if an entry is a daily close over the 200-day MA, the exit signal would be a close below it.
- He uses a two-step exit system (e.g., taking half the profit when a stock breaks below the 50-day moving average), which has helped reduce portfolio volatility.
- He emphasises the importance of getting comfortable with letting winners run, even amidst volatility, by observing how much profit was lost by exiting too early.
- He does not micromanage trades or frequently add to positions, finding that the “first trade is the best trade”.
- For parabolic moves, if the Average True Range (ATR) doubles within a short period (e.g., 30 days), he cuts the position size in half to manage increased risk.
-
Position Sizing and Risk Control:
- Larry is meticulous and conservative with position sizing, risking 25 to 50 basis points (0.25% to 0.50%) per stock position.
- Smaller position sizing helps him remain detached from the outcome of any single trade.
- He uses a 2 ATR stop for his core 200-day moving average program.
- He embraces volatility in stocks, believing traders need it to make money, but manages the associated higher risk through position sizing.
- He does not use margin.
-
Trading Psychology – The Most Important Ingredient:
- Larry believes psychology is the most important aspect of trading.
- He learned from Jesse Livermore that “markets don’t beat traders but traders beat themselves,” and from Alexander Elder that “the weakest link in any trading system is always the trader”.
- A key insight is to “turn their brains off” and stop trying to predict the markets or rely on news, earnings, or fundamental analysis. He states, “nobody can consistently call the markets and can consistently predict the future”.
- The biggest lesson learned is to be introspective and accountable, realising that “it’s all you” and not to blame the market or external factors.Handling Drawdowns:
- During prolonged drawdowns, he naturally trades smaller due to his position sizing being based on equity.
- His two-step exit system also helps reduce volatility during these periods.
-
Recommended Books:
- “Reminiscences of a Stock Operator” by Jesse Livermore.
- “Trend Following” by Michael Covel.
- “Trade Your Way to Financial Freedom” by Van Tharp.
- “The Market Wizards” by Jack Schwager.
24 Likes
For those of you who are interested in listening to the trader of the above post, here is the link.

For some context, this podcast was posted 8 years ago. And market has changed since then. Unlike some investors, who belong to a school or thought, who follow a discipline; traders adapt, not necessarily change how they trade entirely, but make adjustments. Sometimes even look for new ideas to implement.
I heard this podcast before. It is possible that he may have made some changes to his style.
3 Likes
Interesting writeup. Thanks for sharing. At 0.25% to 0.50% per stock position, any idea how many positions he would be holding at any given point in time? What kind of returns he would has made in over his career?
1 Like
Most quantitative or system traders typically hold a large number of stock positions or ETFs for risk management purposes. Because they do not have a fundamental underpinning for holding a position, risk is mitigated by diversification.
On the other hand, discretionary traders usually have fair bit of concentration in their holdings because they need to oversee each position manually themselves.
There is no right or wrong way in this. You have to pick the approach that suits best you best.
8 Likes