Haven’t seen this one yet.
Will definitely look into this one, based on desc it does sound good, seems like it is also 2w dependent like Sandhar and also grows faster than industry.
Thank you!
Haven’t seen this one yet.
Will definitely look into this one, based on desc it does sound good, seems like it is also 2w dependent like Sandhar and also grows faster than industry.
Thank you!
@GrowingAlpha, did you make your criterias for selecting stock based on a book or another source? If yes, which one/ones?
Thanks
Hey valorem, no these aren’t from any book in particular. But I’d recommend every Peter Lynch book for basics.
I do not have a formulaic approach to investing, but I can explain why those 3 are the main ones.
Topline growth is the largest driver of stock price movement. It’s not hard to identify small caps growing 30-40% for atleast 1-2 years out. Now lets say that the price of a stock is a function of its earnings and PE ratio. Topline growth translate to good earnings, so the denominator is set. A growing company gets a high PE multiple from the market but one need not depend on PE expansion as topline growth(assuming flat OPM) will take care of it.
ROCE profile, weeds out low quality in businesses. Now for long term holders(>3Y) ROCE is used differently by them, looking for high ROCE while being able to reinvest their returns back into business to generate a compounding machine, say Asian Paints, Divis etc. But for me the delta of ROCE is more important. I mentioned the PE ratio, now all earnings aren’t the same, some earnings are built off of lesser capital than the others, some are cyclical(which is a no-go for me), so the PE ratio assigned to a business is a function on surface of just its Price/Earnings, but the numerator is volatile, inconsistent and sometimes downright ridiculous. So the price that one pays for a certain amount of EBITDA or earnings depends on 1. Growth & 2. ROCE(quality of earnings) & 3. Runway of growth(returns are low here but are for decades). A business that makes higher profits over the same assets is inherently better and when capital is redeployed a high incremental returns makes it even better. This is where I like to look, the benefits of holding high ROCE for long term is great, but for me I need to buy the change in story(read : better roce, growth and perception), I like to buy a company where ROIIC is > ROCE so that I can benefit in re-rating if any. If you want to use this I reccomend using the DuPont ROCE to have a better understanding of ROCE direction.
Cash conversion. Like businesses which have decent WC management and can convert paper profits into green cash. Not set in stone but I’d say this will weed out frauds, 80% of unclean accounting, unproven stories(Eki energy) etc. Market also prefers to see a high conversion. Also I should mention high ROCE will usually lead to better cash flows.
Bonus points for clean & conservative accounting(matters less in the bull market, just saying), nice management, low float, Share buybacks, Superinvestors(particularly Ashish sir, I had bough Fineotex before Ashish sir and was very happy when I found out), and last but not least momentum on charts.
Thanks for sharing! You are clearly extremely knowledgeable and I hope to connect with you one day.
Have you made a screener that helps you find companies that fit your criterias?
Cheers,
Valorem
Extremely knowledgeable is definitely a stretch but thank you!
Yes the screen is basic because I do not want to exclude any opportunity.
Thats it, you can add more conditions to reduce the sample size but it might be worth it to go through it.
I’d say that less than half my investments are through screening. Krsnaa found when I looked into diag sector, and many great ideas from VP & Twitter.
We should absolutely connect one day!
Weekly update on how I’m looking at the market, more of a mind dump for me to make it easier to organize my thoughts as I only have Sundays to do so. The 2 positions I have sold out of Coffeeday has fallen from 50 to 43 and Gujarat Fluorochem has gone from 2850 to 2680.
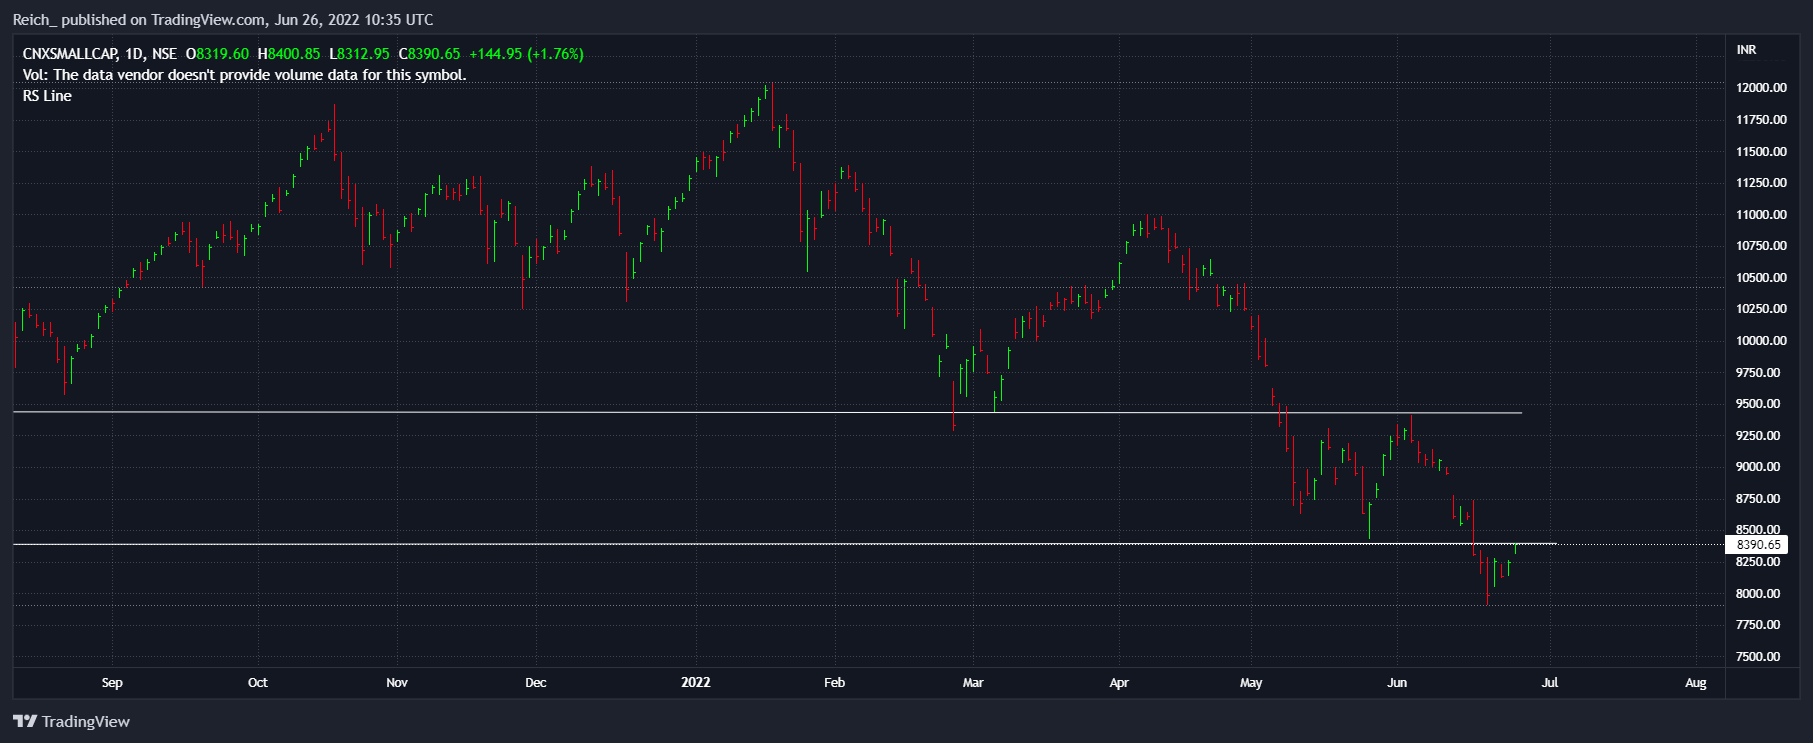
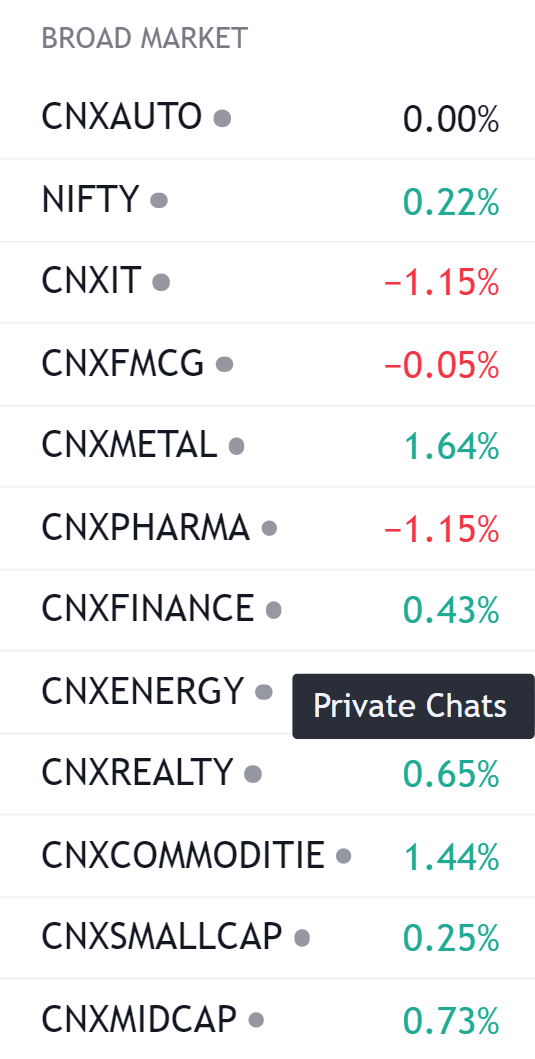
The broad market continues to be in a bear market and last week has seen a bit of a pullback.
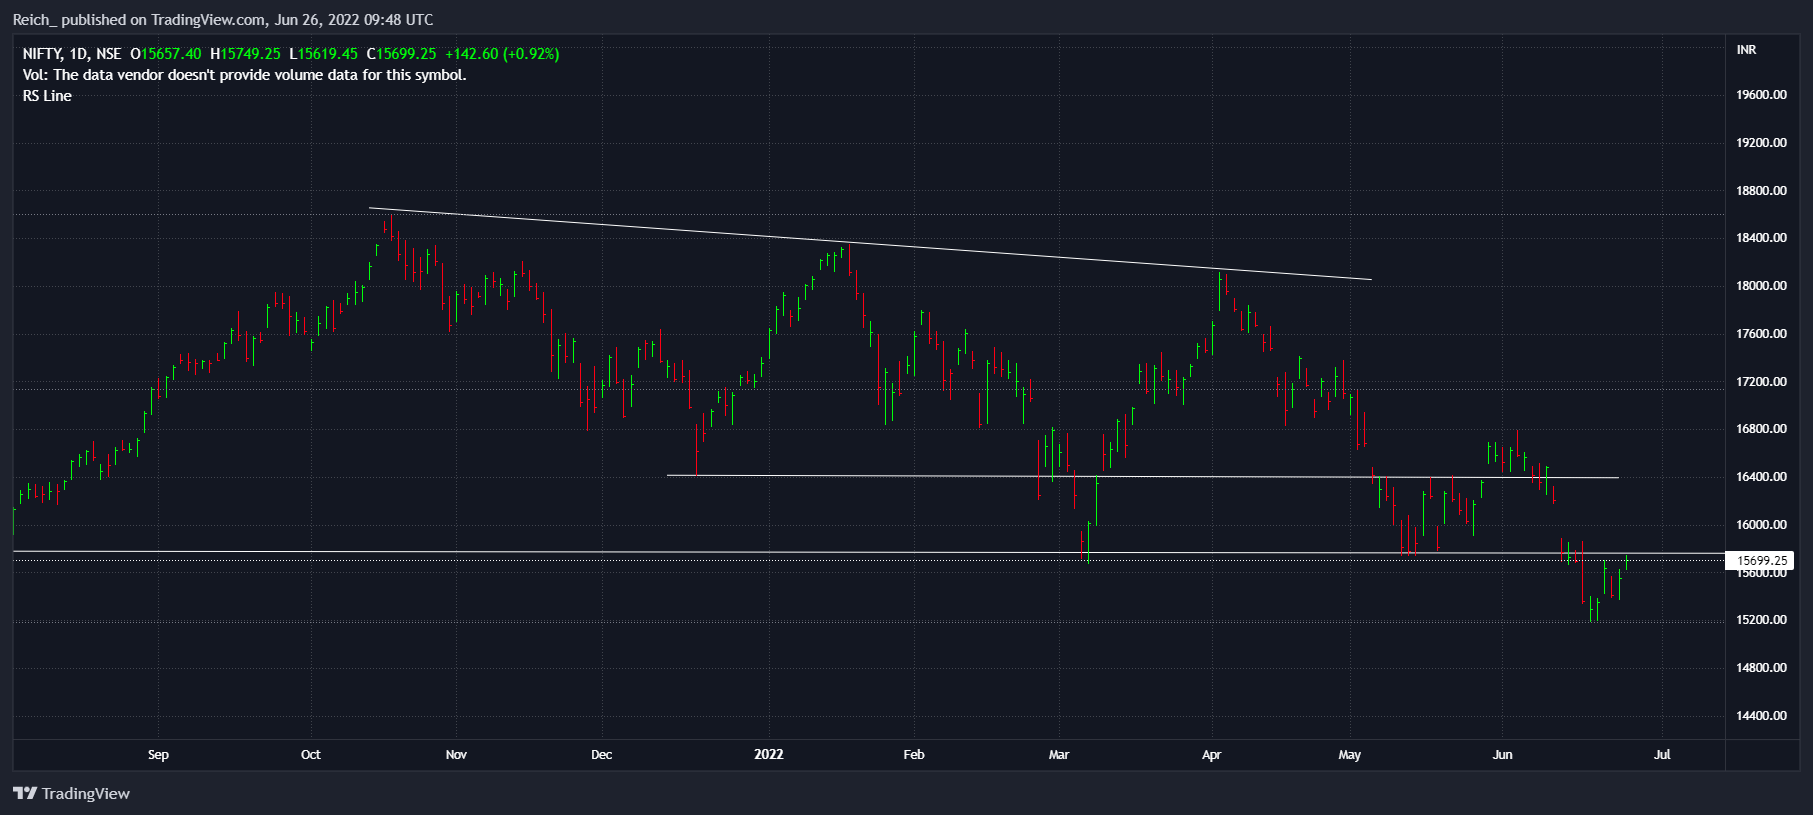
As of right now the broad market continues to signal weakness, this week will be an interesting one as the current levels, as indicated by the charts show that we are at a major resitance(15,800 ish) which if cleared could result in a bear market rally. However globally the charts indicate much bearishness and paint a bleak short term future(best time to buy?).
Not a macros guy, so won’t be able tell you more than news articles and research reports or give you my opinion of it. I’d be lying if I said I understood the probabilities/clear picture of how things might play out or if I understand the implications of fed raising rates other than the basic effects. But one thing is certain, there is uncertainty in the markets(hence a buying opportunity). Mildly phasing out of charts for a minute lets look at valuations.
Currently the Nifty 50 is at a valuation of 20x P/E or a 5% pseudo yield on earnings(I used pseudo cause unlike bonds & money market funds the coupon rate seems to constitute both appreciation in value on anticipation of growth in corp earnings and what is now a much smaller dividend yield, please correct me if I’m wrong). Historically a earning yield of 6-7% has resulted in outsize returns. But the Nifty further correcting 30% seems very unlikely(who knows and who am I to say that anyway). Eitherways, corporate earnings are likely to grow at 11-12% for the long term, which indicates that market is in fair value territory. Either the market crashes and massive buying opportunity appears or a the markets stay subdued for while and earnings catch up.
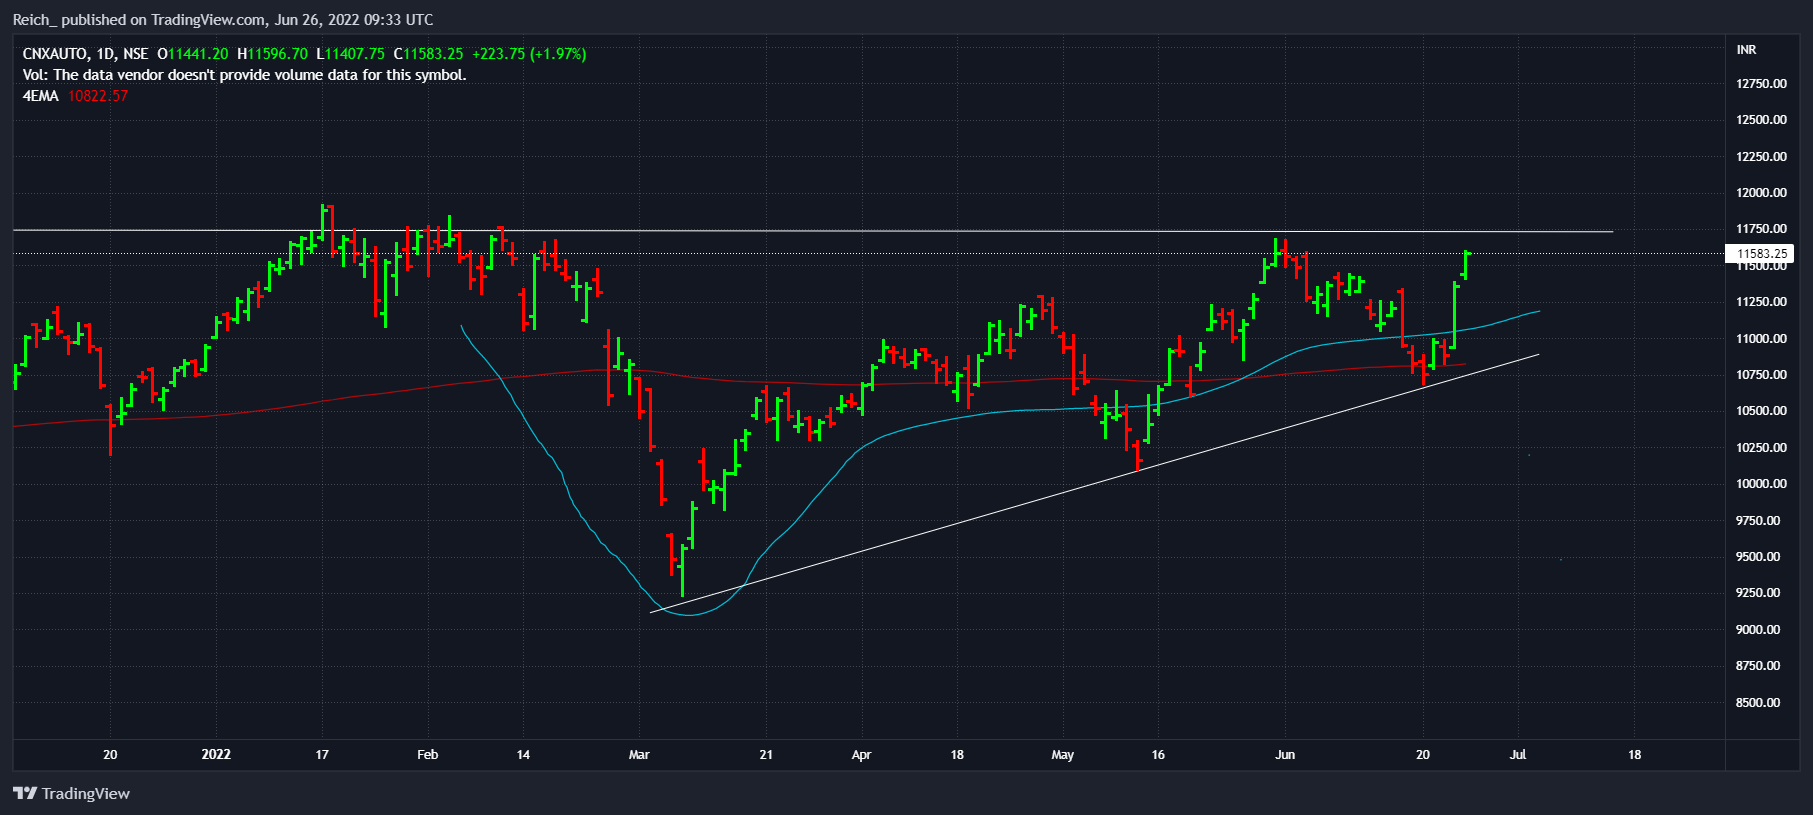
Now while the broad market is still bearish with cues of bullishness that need to be tracked, thematically autos have continued to do well as I have been saying from the beginning of the thread.
Broad auto index is indicating a clear tightening towards the right, almost perfectly. It would make for a cleaner breakout if the index consolidated a while at current levels and then made a clean cut breakout of key levels at 11750.
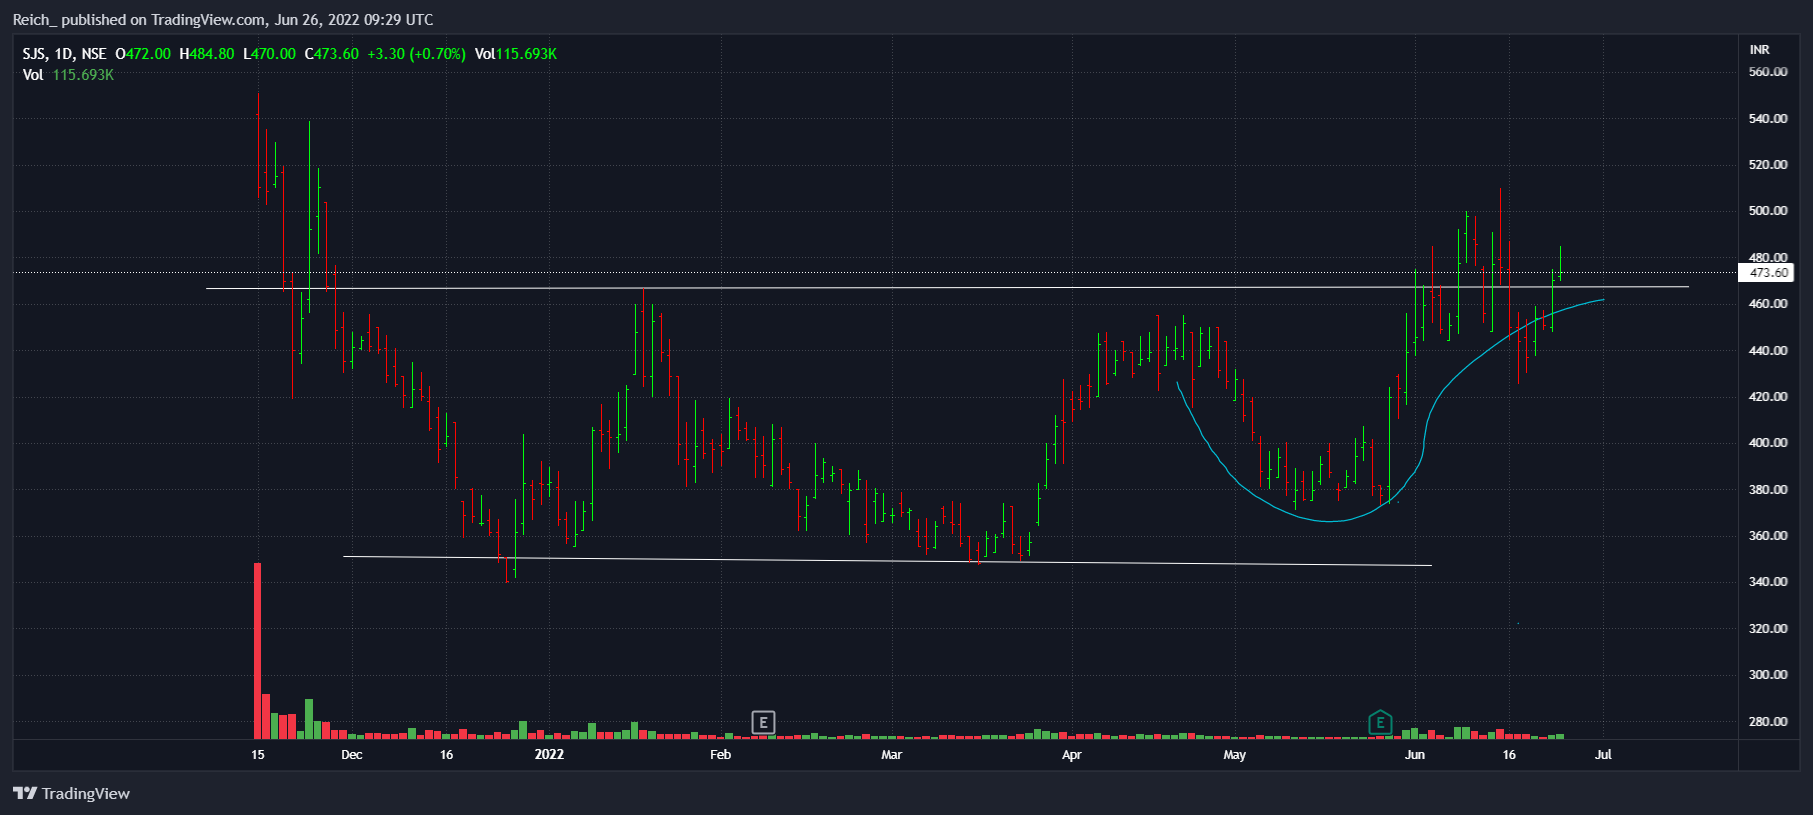
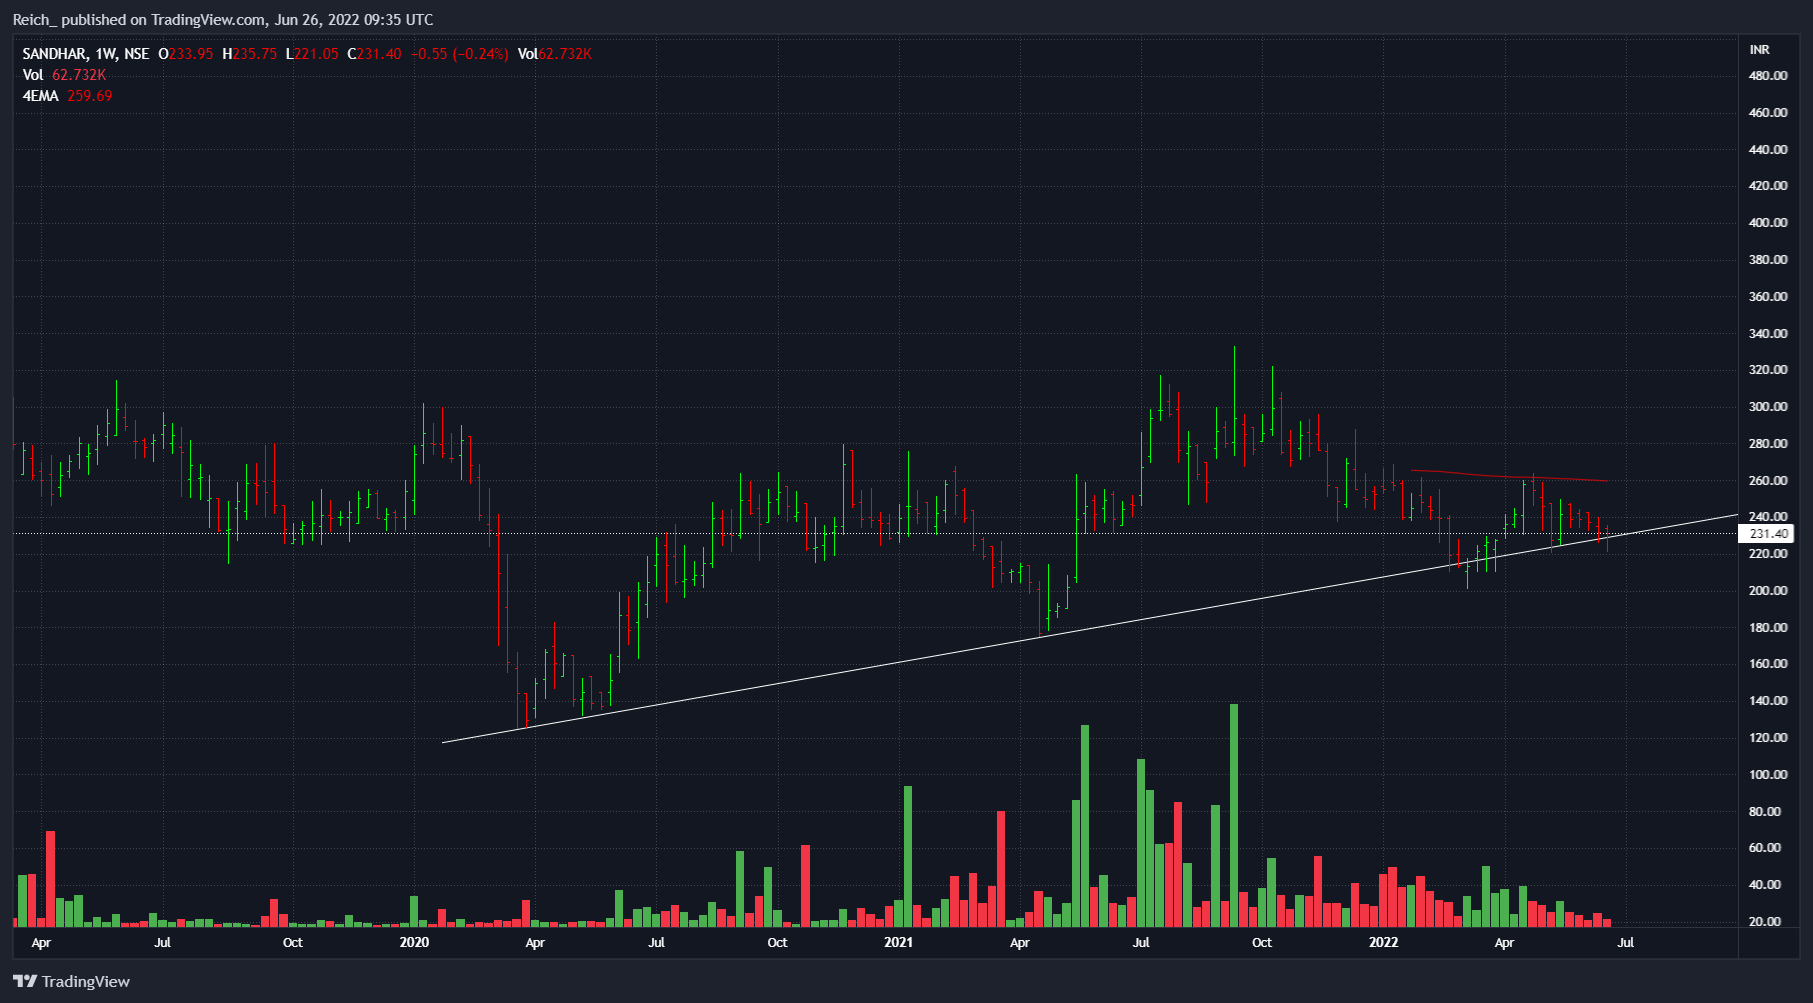
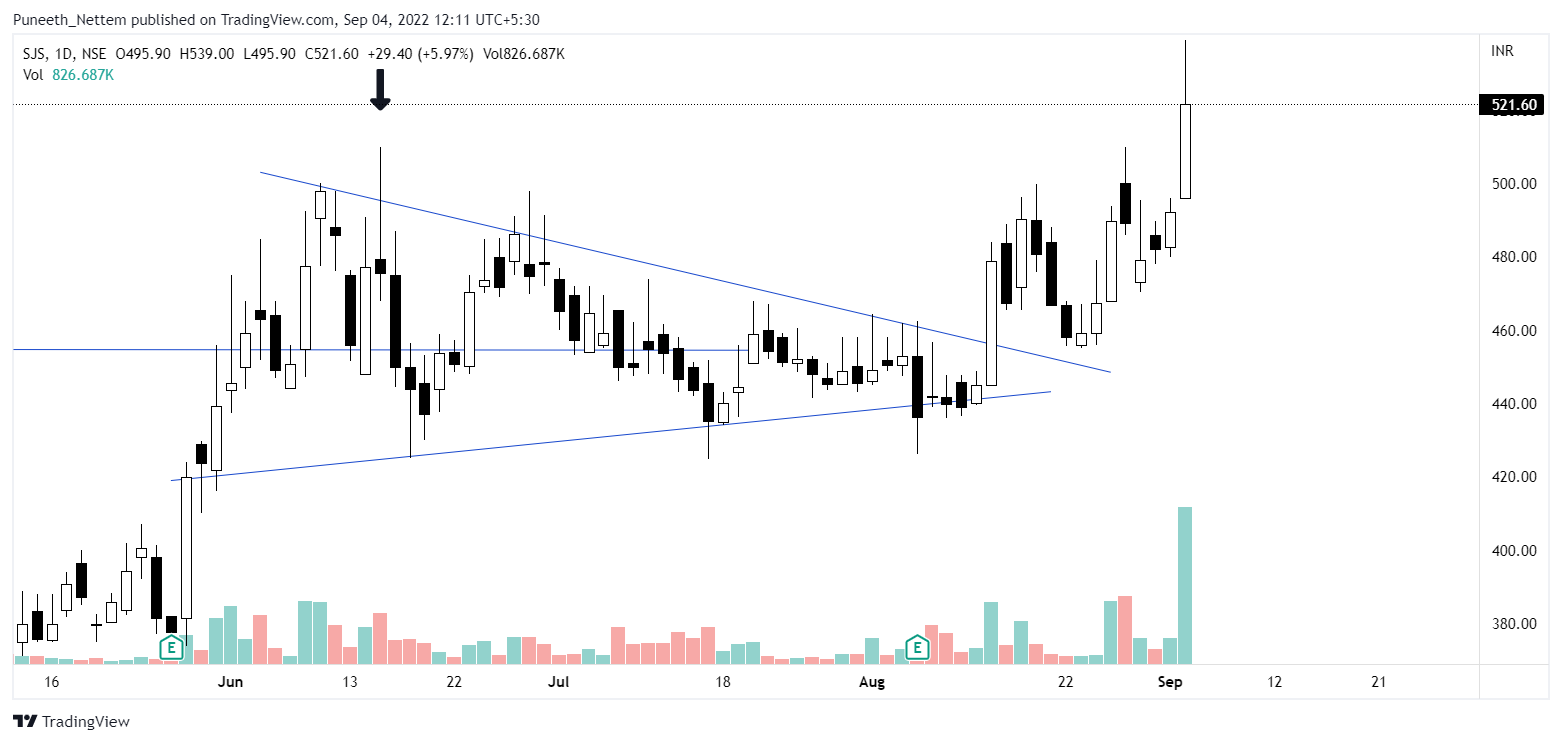
Within the sector 2 companies I’m tracking/planning to take a position are SJS & Sandhar
On the other hand, we have a bad chart/no momentum but cheaper prices and a lot more growth in earnings and ROCE.
Sandhar, based on charts would be a good time to pick it up as it is on the lower end of the trendline(risk of breaking down can happen too though). Full thesis on Sandhar here(written a couple of weeks back) -
BSE: 541163 | NSE : SANDHAR | SANDHAR: IN
Sector - Auto Ancillaries | Industry - Auto Ancillaries
Cyclical, Growth, ROCE expansion.
Elevator Pitch: Depressed ROCE, OPM caused due to short term RM costs elevation(passed with 1 quarter lag) likely to turn up disproportionately on the back of higher OPM and sales growing quicker than capital employed.
Sandhar Tech is a diversified OEM supplier to mostly Indian Auto companies. Sandhar is the sole supplier/single-source supplier of lock sets and mirror assemblies to Hero MotoCorp Limited, TVS Motors Limited for motorcycles and Honda Cars India Limited. Moreover, it is a single-source supplier of wheel assemblies to TVS Motors Limited and Eicher Motors Limited (Royal Enfield), and operator cabins for excavators to JCB India Limited. Management has over 3 decades of experience in OEMs.
Highly diversified in product offerings, with locking systems and aluminum die casting (ADC) each contributed to ~21% of FY21 sales, with cabins (16%), sheet metal components (19%), vision systems i.e. mirrors (8%) and others (13%) following suit.
Concentrated client base especially in the 2 wheeler segment, with 50% of revenues coming from TVS motors and Hero Moto Corp. They do, however, have decadal relationship with many of their clients.
Segment-Wise revenue - 1. 2 wheeler - 54%, 2. 4 wheelers - 24%, 3. OHV & Tractors - 16%.
Geography Split - 86% from India, 14% from Spain(by subsidiary).
As the company services the Auto industry(particularly 2 wheeler and 4 wheelers) it is dependent on the cyclicality of the auto industry. I would classify it a shallow cyclical(although it does usually outperform the industry and its client’s performance). As far as the thesis goes, increasing wallet share and product launches will be considered the main growth levers rather than the auto cycle uptick.
Company had guided for 30% growth in topline this year, which has not been achieved on account of general de-growth throughout the auto industry. They grew about 24% as against 25% for the industry. Such growth can now be expected for FY23 and FY24.
Company also faced major RM cost headwinds with OPM dropping to an average of ~8% for FY22. Once RM prices(Zinc, copper, nickel) cool off margins are likely to flow into low double digits.
ROCE also remains highly depressed. Stretched WC with NWC in FY21 being 212 crores which has now grown to 300 crores(note NWC = Trade receivable + Inventory - Payables). ROCE has also fallen from 9-10% to 8%.
High leverage for the short term(D/E has doubled to now) so capital employed is stressed for the short term.
Low float available in the markets. 70% with promoters, 16.5% in Institutional hands, only 14% in public. Also promoter, Jayant Dawar has constantly bought shares from open market, buying at average prices of 250 in the last year(1 crore in 2021, even more in previous years)
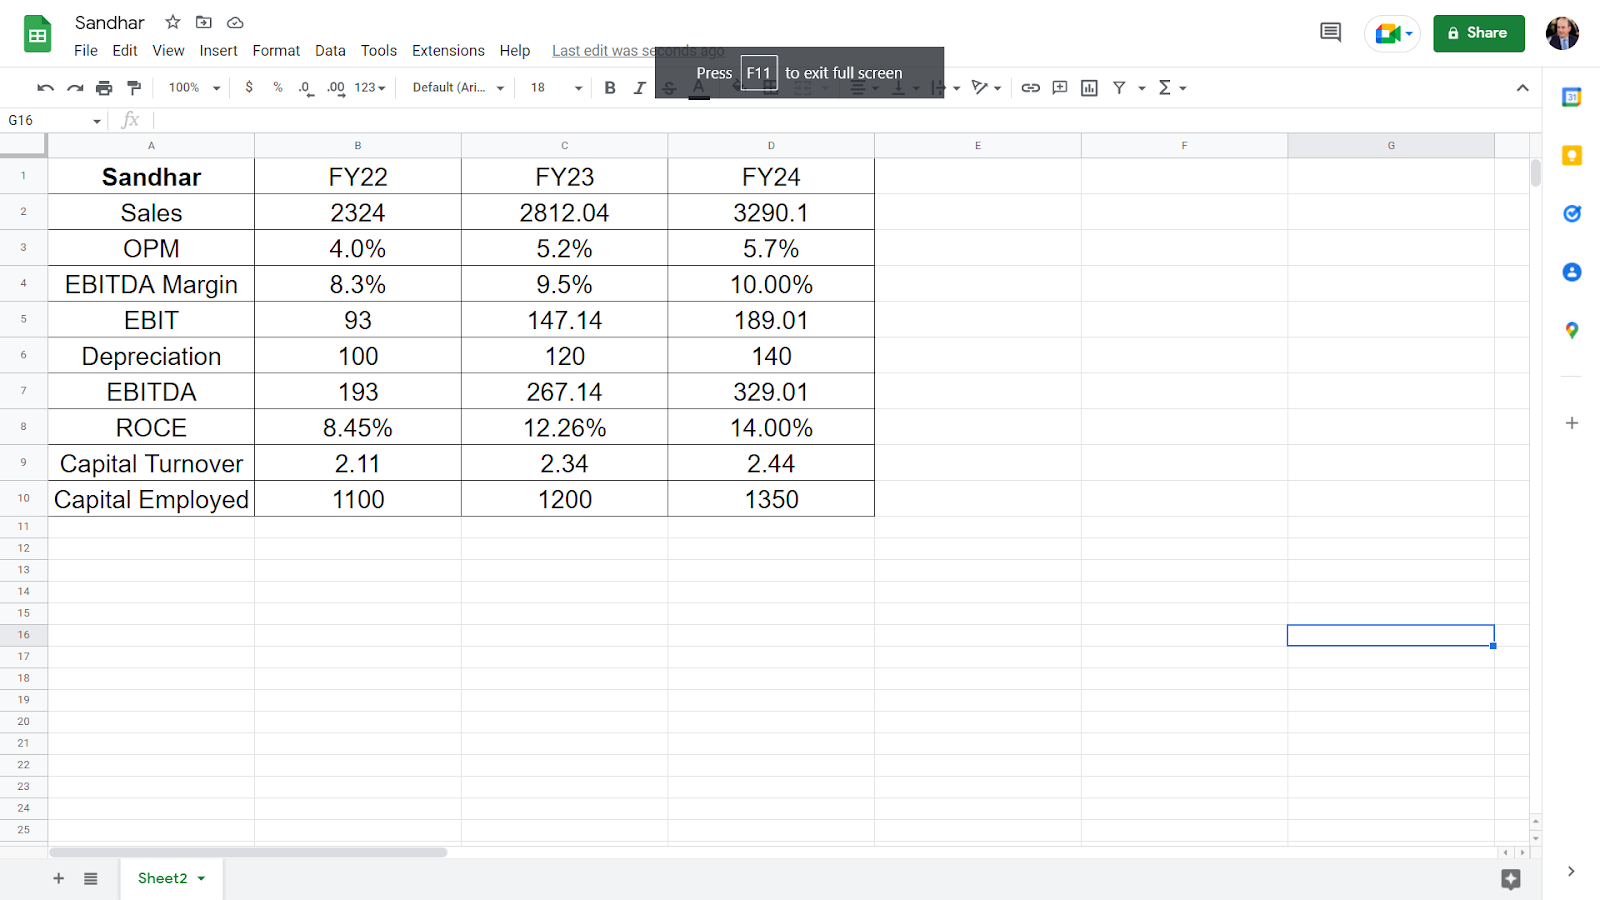
Currently the company trades at a market cap of 1500 crores. TTM EBITDA of 193 crores, EBIT of 93 crores. Trades roughly 15x EBIT.
Inputs - 21% growth in revenue for FY 23, 17% for FY24. Assuming EBITDA margin to rise to 10% by FY24 on the eventual cool off in RM prices, and prudent capital allocation by management to only produce high margin products. Capital Employed(NWC+NFA) is dependent on the CWIP which might go higher than I estimate and reduce ROCE.
ROCE(calculated as its dupont form - OPM*Capital Turnover ratio) calculated are very rough estimates to understand the trend, which should be taken with diabetes-inducing grains of salt. Capital turnover ratio(Sales/Capital Turnover) are shown to be trending upwards as I do believe that utilization rates will turn up and sales will grow quicker than the capital employed, i.e ROIIC will be high.
Both sides of ROCE(OPM & Capital Turnover) will work together, and cause a disproportionate increase in ROCE, and lead to a rich CFO generation.
Assuming the company is valued at 15x FY24 EBIT(Margin of safety baked in price as ROCE’s are likely to turn up so I’d say conservative enough), 2835 crores could be a fair value for the business. This again is built on a conservative take on management’s guidance, but still this is an imprecise art and therefore please do your own DD to evaluate whether or not the business can achieve it.
This begs the question why the company is away from fair value.
Another business that I track and should probably mention is Anup, where my main concern was capex delays. A thesis I wrote a while back are here(and subsequently cringe at but that’s growth ig) -
Haven’t put it on the thread as it might get too long.
ANUP .pdf (72.9 KB)
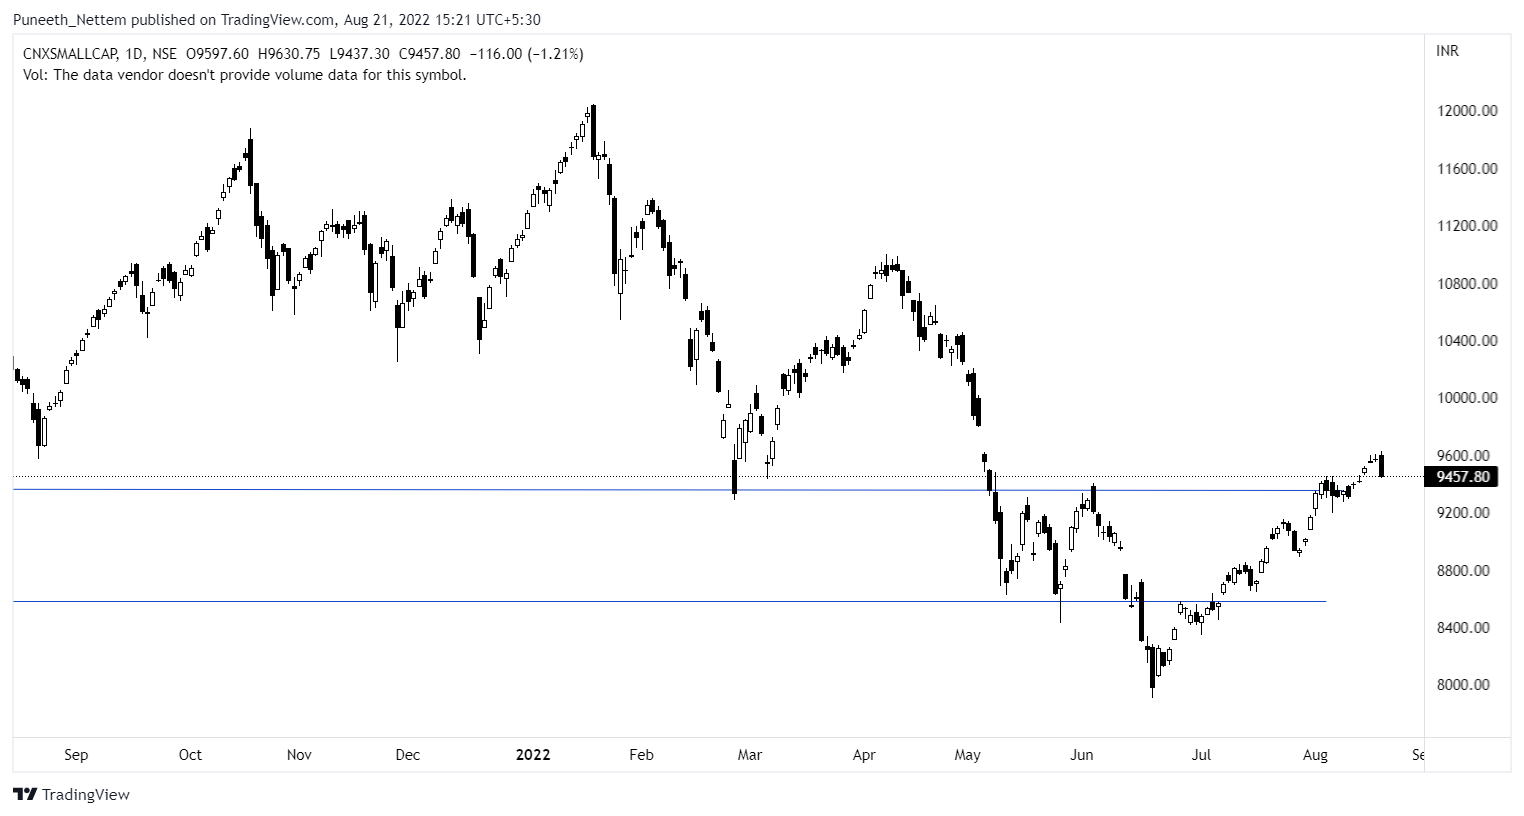
As of right now, its tempting to swoop in and buy some SJS + Sandhar(and keep SJS with a trailing SL) but let’s see how the broad markets, both auto and nifty and cnxsmallcap clear out upcoming resistance.
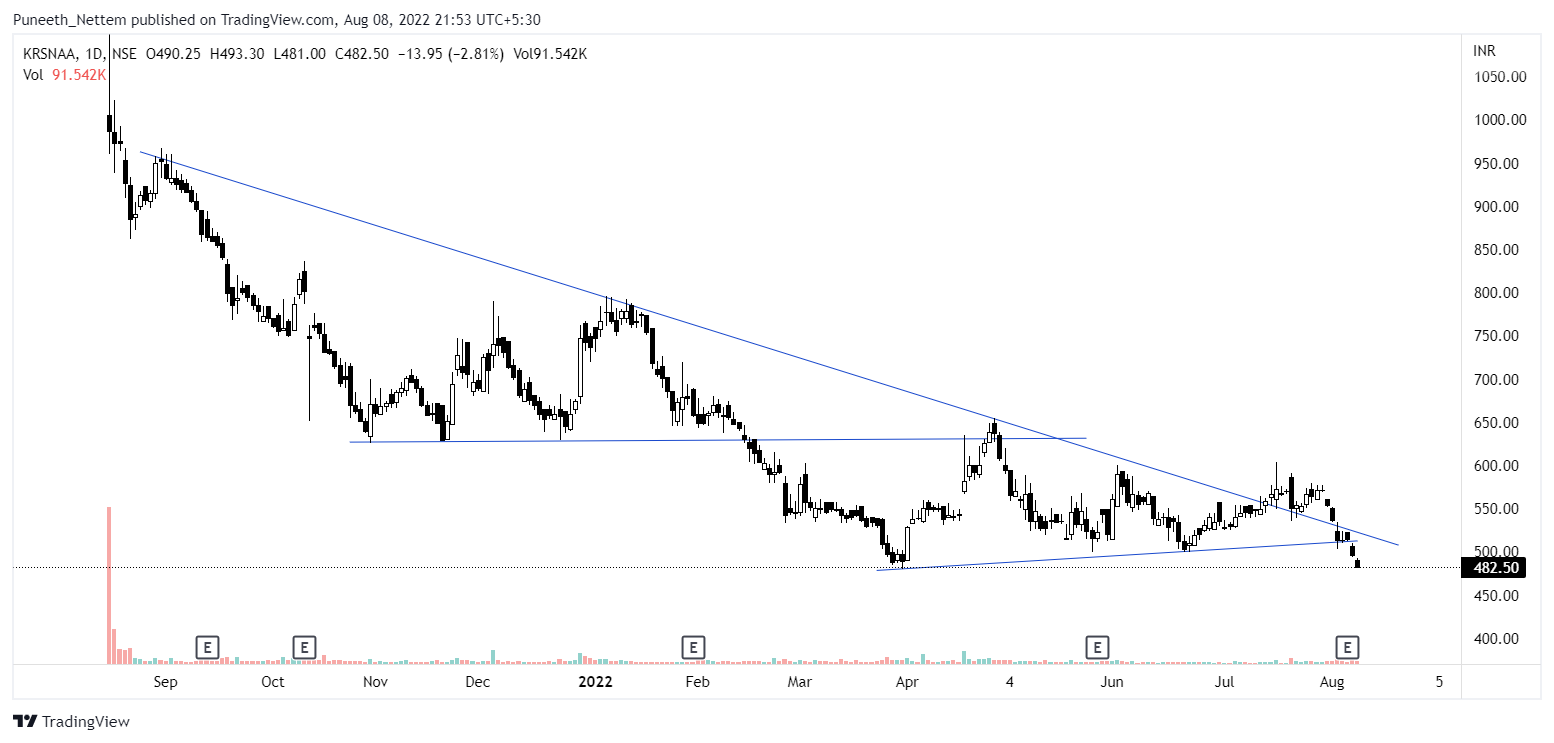
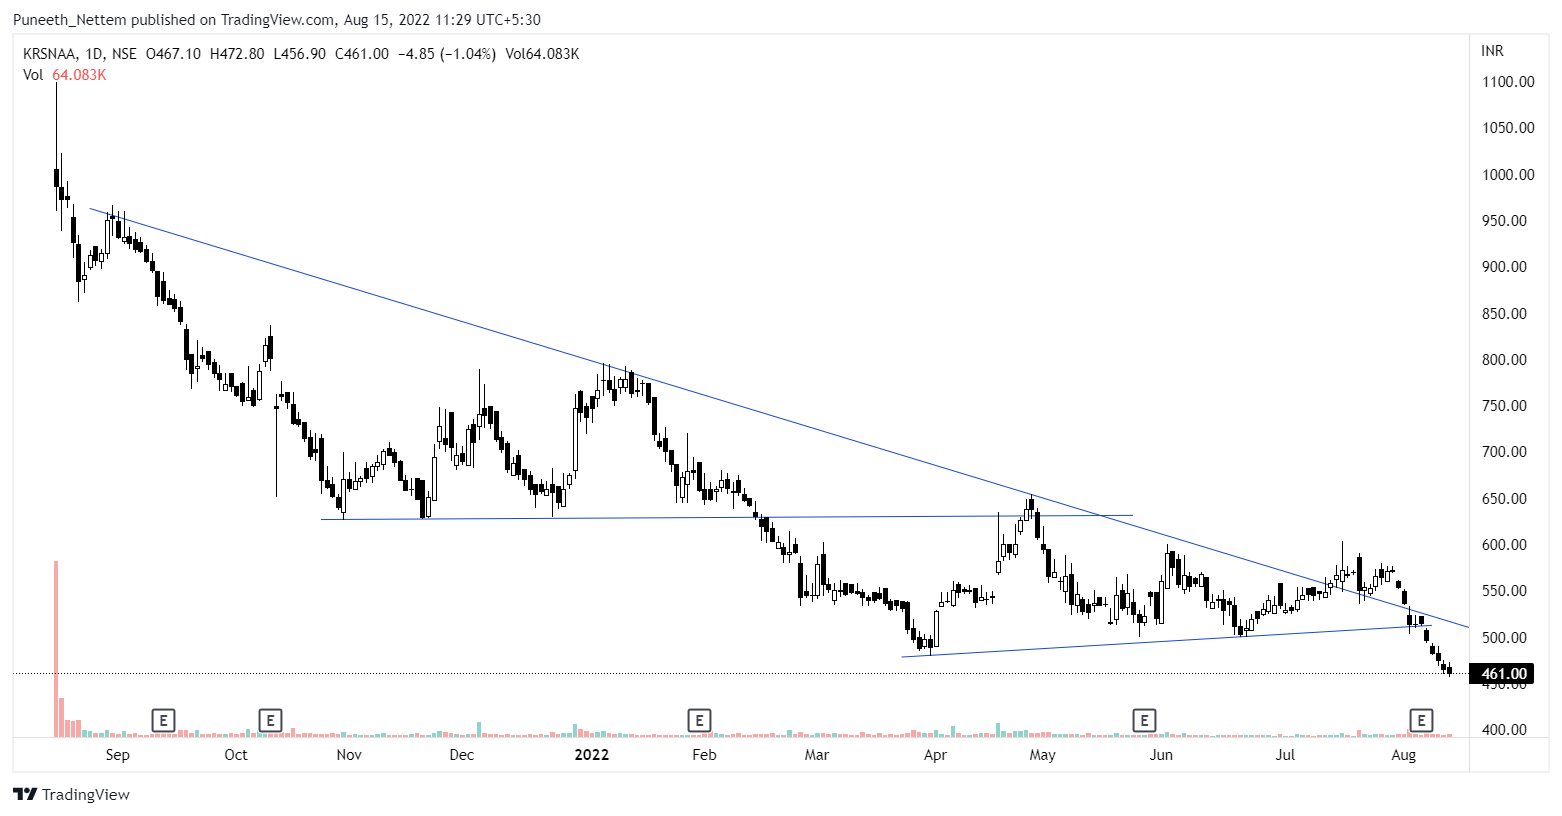
The only position I hold is Krsnaa, which is doing well in relation to smallcap index but has been encountering tons of overhead supply, but fundas have been spectacular(punjab centres opened up).
Current PF is as follows. Positions add up to >100% cause realized profits are not counted as capital employed(will add it on a yearly basis)
| Companies | Weightage | Cost |
|---|---|---|
| Krsnaa | 34% | 605.3 |
| Cash | 93.75% | N/A |
Performance from starting(Oct 20th 2021)
| My PF | CNXSMCALLCAP | NIFTY50 |
|---|---|---|
| 20% | -28% | -14.2% |
Overall looking back, I’m happy that since I began investing market has been continuously on the decline with the subset of the market I operate in(small companies) doing especially worse. Seeing what kind of businesses fail or flourish in different environments and understand the timing of market, cash & position sizing learnings have been accelerated due to the bear markets. So, thankful for the crash!
This week I bought some Sandhar Technologies, on account of auto index continuing to show strength and decent numbers from 2W industry(too early to say, but I think an auto cycle is likely).
Currently portfolio is as such -
| Companies | Weightage | Cost |
|---|---|---|
| Krsnaa | 34% | 605.3 |
| Cash | 70% | N/A |
| Sandhar | 22.75% | 262 |
The numbers look weird because I’m looking at it as a yearly basis and therefore each position is calculated as against my starting capital. So the realised gains made is not considered as part of the capital employed.
Performance is as follows
| My PF | CNXSMCALLCAP | NIFTY50 |
|---|---|---|
| 19% | -24% | -12% |
Will likely buy some more Sandhar.
Hi @GrowingAlpha, I too like Krsnaa. At first I thought of it as a Re-Rating candidate. But I realised that B2G business has very less chances of getting a Re-Rating. Do share your thoughts.
Hey valorem,
Yes I don’t think Krsnaa will get ridiculous re-rating, as the market might not put faith into B2G. But eitherways, I believe a large amount of price decline is on account of fund outflow in diag space for 2 key reasons, i) Covid revs cooling off, ii) competition in diag space. On both accounts, i) Krsnaa’s covid revenues are very minimal at this point and market will finally see that Krsnaa is growing at 30%, ii) Krsnaa will fare better due to the b2g space it operates in(+ its prices are already lower). However you are right, Krsnaa will not get premium due to its b2g space.
Even if we keep multiple expansion aside, revs grow at 25%, capacities are underutilized(decent amt of operating leverage will kick in once expansion slows a little bit), will likely have roce’s of 25%(ballparking, havent exceled it yet) in 3-4 years, makes a decent amt of cash, sectoral tailwinds(PPP in particular + tailwinds), tender win ratio is healthy. Only major -ve is very stressed charts and tonnes of overhead supply, better to wait for stock to cut a few resistances before buying/averaging. A large price decline like this one might have a long basing period.
Definitely not a cheap stock with very wide margin of safety as such, it is decently valued already at 25x multiples. Not cheap by most means IMO.
Hello everyone,
Just wanted to make an update on my pf.
| Companies | Weightage | Cost | Loss% |
|---|---|---|---|
| Krsnaa | 34% | 605.3 | 20% |
| Cash | 70% | N/A | |
| Sandhar | 22.75% | 262 | 8% |
| My PF | CNXSMCALLCAP | NIFTY50 |
|---|---|---|
| 14.5% | -19% | -5.3% |
Regarding Krsnaa position.
Learnings
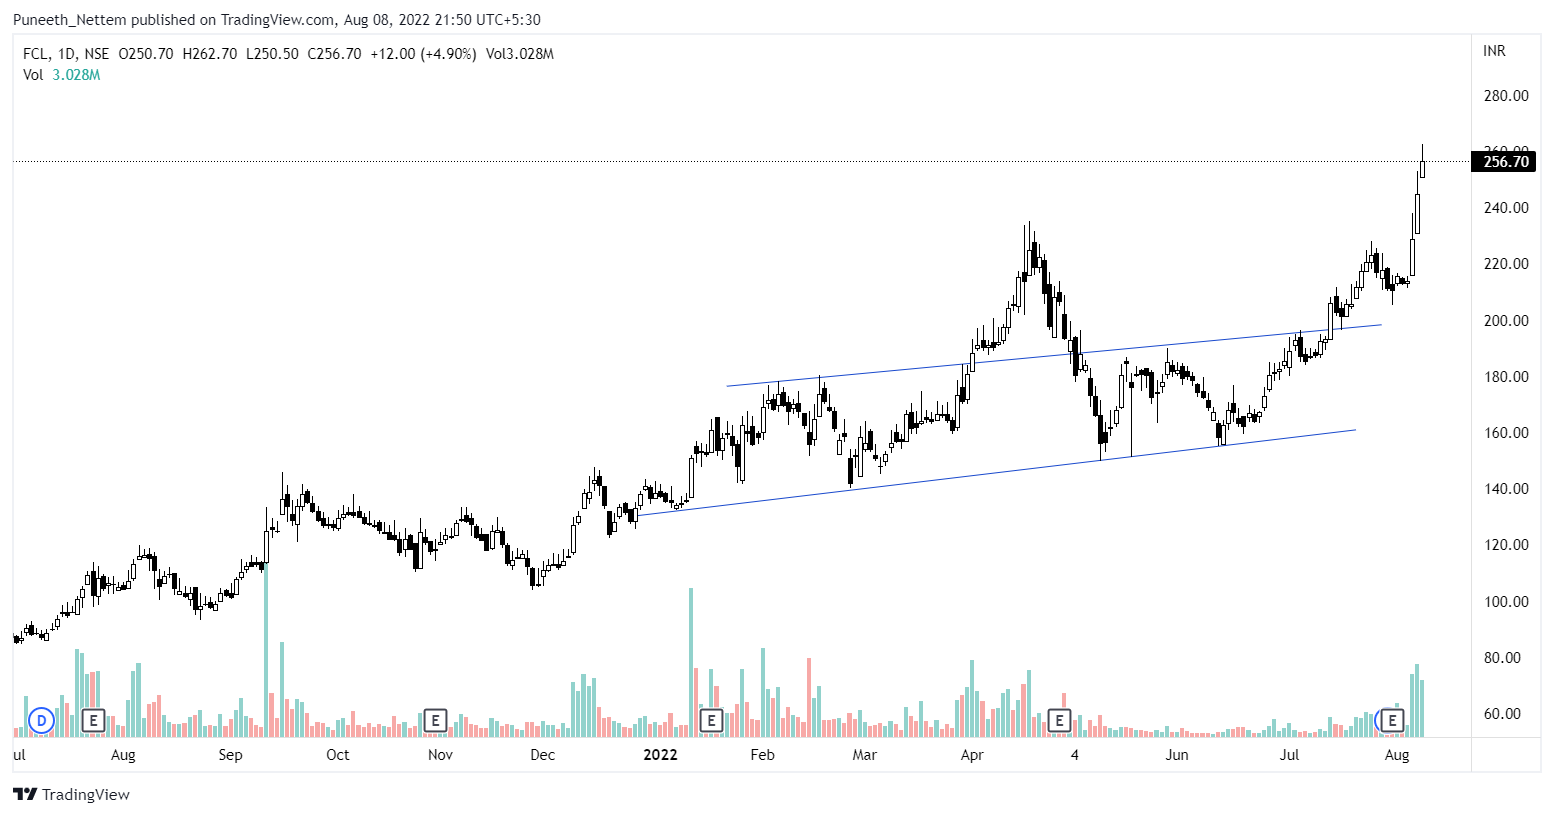
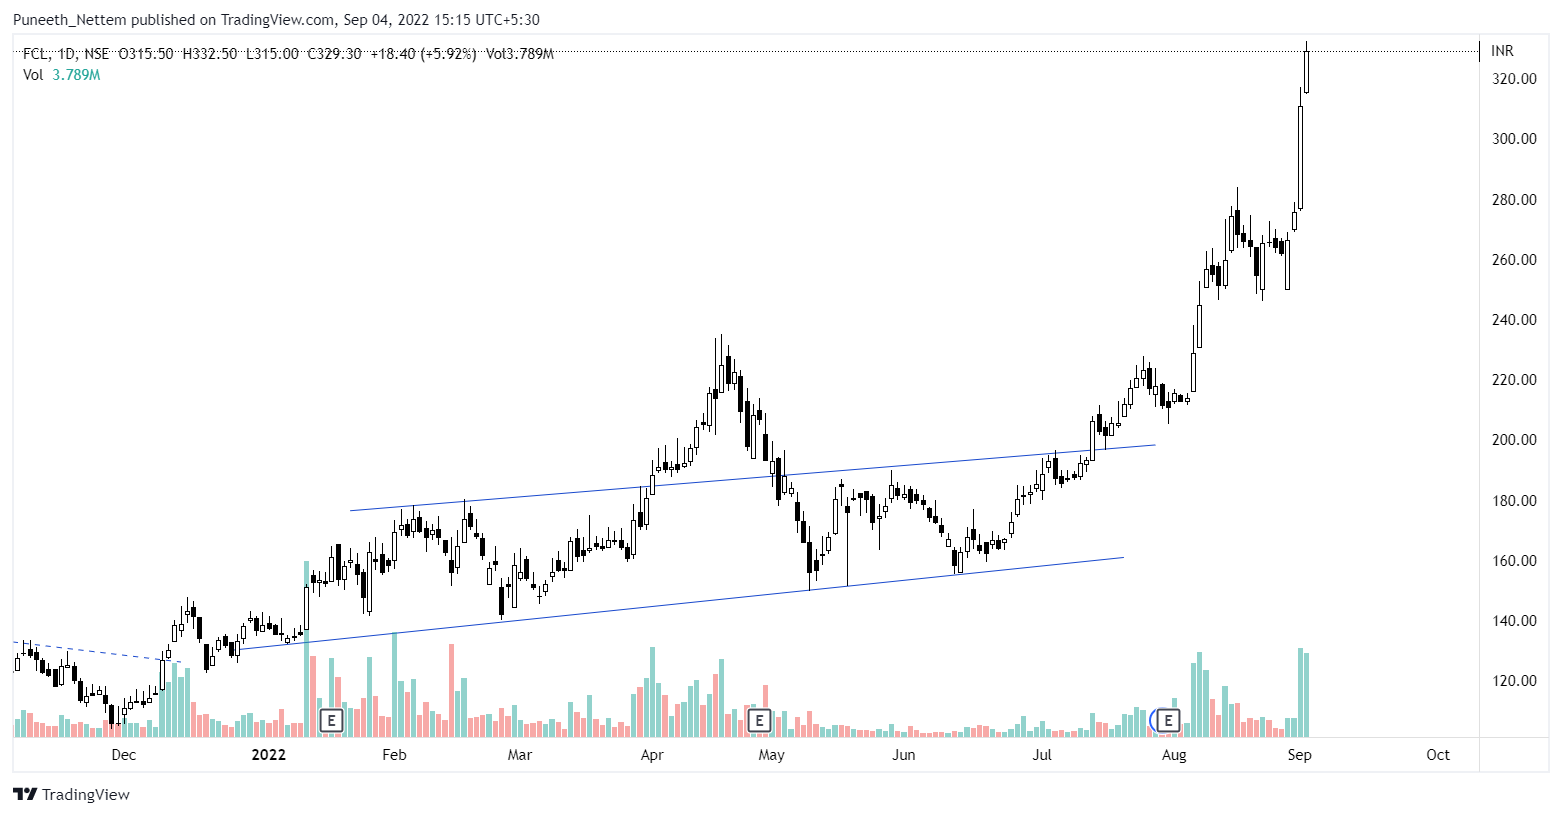
In both of the above cases, the strong momentum continued well after I sold due to uncomfortable valuations. I do feel like I made blunder on both FCL and Fluorochem, and should have re-entered when they continued to respect MA’s.
Now coming to a blunder that has cost me money.
The stock was in a constant downtrend and never broke out. I bought at 605. I felt like due to high growth the stock would eventually clear overhead supply. But unbeknownst to me, the major thesis pointers would get hammered. Buying a stock in a downtrend is like literally fighting a wave.
Point noted - Prefer buying stocks with some confirmation on charts, until more experience in funda side is gained.
Way forward
Looking ahead, Pf will have some changes.
Slowly, I will be allocating a certain part of capital into momentum and CANSLIM. Not yet confident enough of allocating cash into it. But have been doing a weekly exercise of looking into momentum stocks and slowly I will be speculating into momentum with the help of charts. I’m not sure about the guidelines regarding posting charts on TA and will refrain from doing so, and keep it to giving names of stocks for a while.
Will be avoiding downtrends in stocks, while I could make money, chances are I won’t. The hard part about being a “contrarian”, is that eventually the contrarian opinion would have to cease being a contra opinion to make money. I have realised that I am not there yet and more work needs to be done. I need to build a more well defined framework(with special attention on what needs to be avoided, eg B2G) for my funda bets and as time goes on I should improve in those regards.
On a more personal front, my mother gifted me 2 books that I have been wanting for a while(on account of doing well in ICSE). The 2 books are -
Have finished the 1st and will be reading it multiple times over. May share some things I learned later. ![]()
Thank you!
Hi puneeth, silly question for you. I don’t think you are allowed to open demat account in your own name untill you are 18 yrs.
Do you use your family members account to trade ?
Yes, I opened a brokerage account in a low cost brokers, with the same demat account as my mothers.
I don’t have one myself. ![]()
Happy Independence Day everyone!
RIP to India’s best investor/trader. Our favorite investors’ favorite investor, Rakesh Jhunjhunwala.
As promised, I am doing a dive into Technical Analysis and charts.
Firstly, I should mention some major FAQs -
A - Technical Analysis may/may not work in terms of what we define as technical analysis. Identifying random and obscure chart patterns and drawing lines is not technical analysis IMO(an opinion shared by many TAs). TA is a tool to gauge supply and demand and finding points in the market to enter and exit.
A - A good exercise for the curious would be too look into the charts of superwinners from pre 1900s. Then the charts from 1900s, all the way to the 2000s and the present times. Breakouts & VCPs(Volatility contraction patterns) are timeless. They work continously and will do so(why explained next), from the times when charts did not exist, all the way to times when people paid attention to charts.
A - Fear and demand in humans(en masse, not individual thinking) hasnt changed in 100s of years. We just aren’t built to be purely rational hence inefficiencies exist in the market.
A - I’m learning too, let’s find out.
What is the technical analysis that I’m talking about
It is important to set our scope of conversation, TA is multi-faceted and varied but what I’m researching will be CANSLIM-esque, momentum, trend following, breakouts and VCP, no intraday as it doesnt benefit me.
Charts: The value proposition
Fundamentally, I couldve done better, done more research but 1 trick that would help is putting weight to the charts. The stock never made a higher low, and never once came out of a downtrend. The chances of making money were low. Unbeknownst to me, there is tons of overhead supply which makes it harder and harder for the stock to come back.
Even legends like Joel Greenblatt(40% for 20 years), Michael Burry(50% in initial years), Jack Dreyfus(of Dreyfys Funds), Stephen Druckenmiller(30% CAGR for 30 Years), George Soros(Macros but still pays attention to charts) have employed charts for investing and trading purposes.
System
Well made system to cancel out excessive risk taking.
1. What I’m looking for
I’m limiting my universe, exclusively to breakouts, VCPs, trend following. Let me show you some examples.
Breakouts
VCPs(structures found pre-breakout)
Tighter and tighter moves to the center. range keeps decreasing. Higher chance of breakout. Happens on consolidation of an uptrend. When volume falls a lot during the consolidation of an uptrend. The volume reduces the company to under 50DMA . The companies tighter range, has generally pullback lesser and lesser.
Needs some days at under pivot point so that supply is absorbed, requires very tight preferably under 10% final contraction. Wide and loose is never good.
Supply & Demand
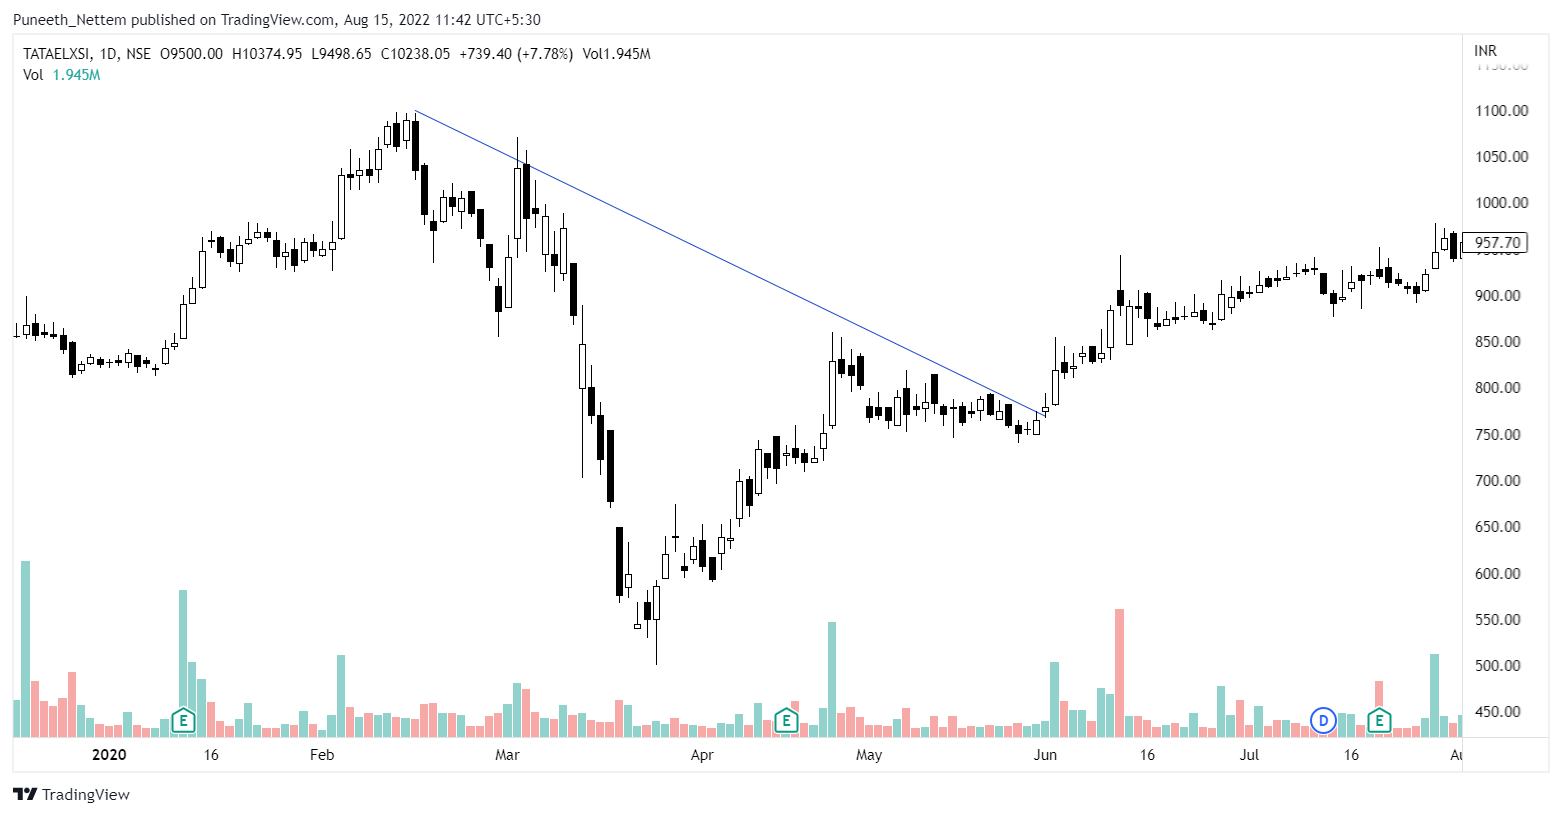
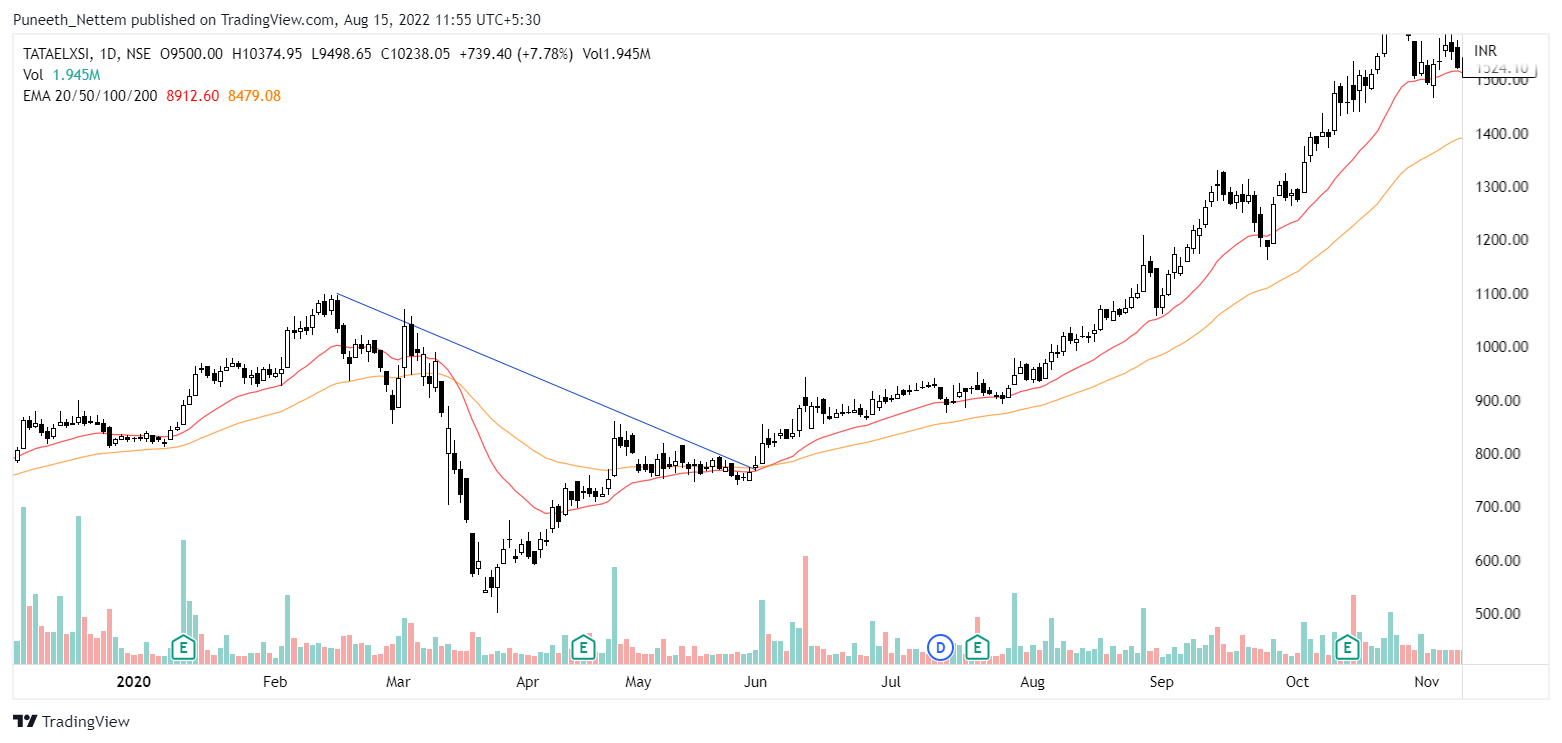
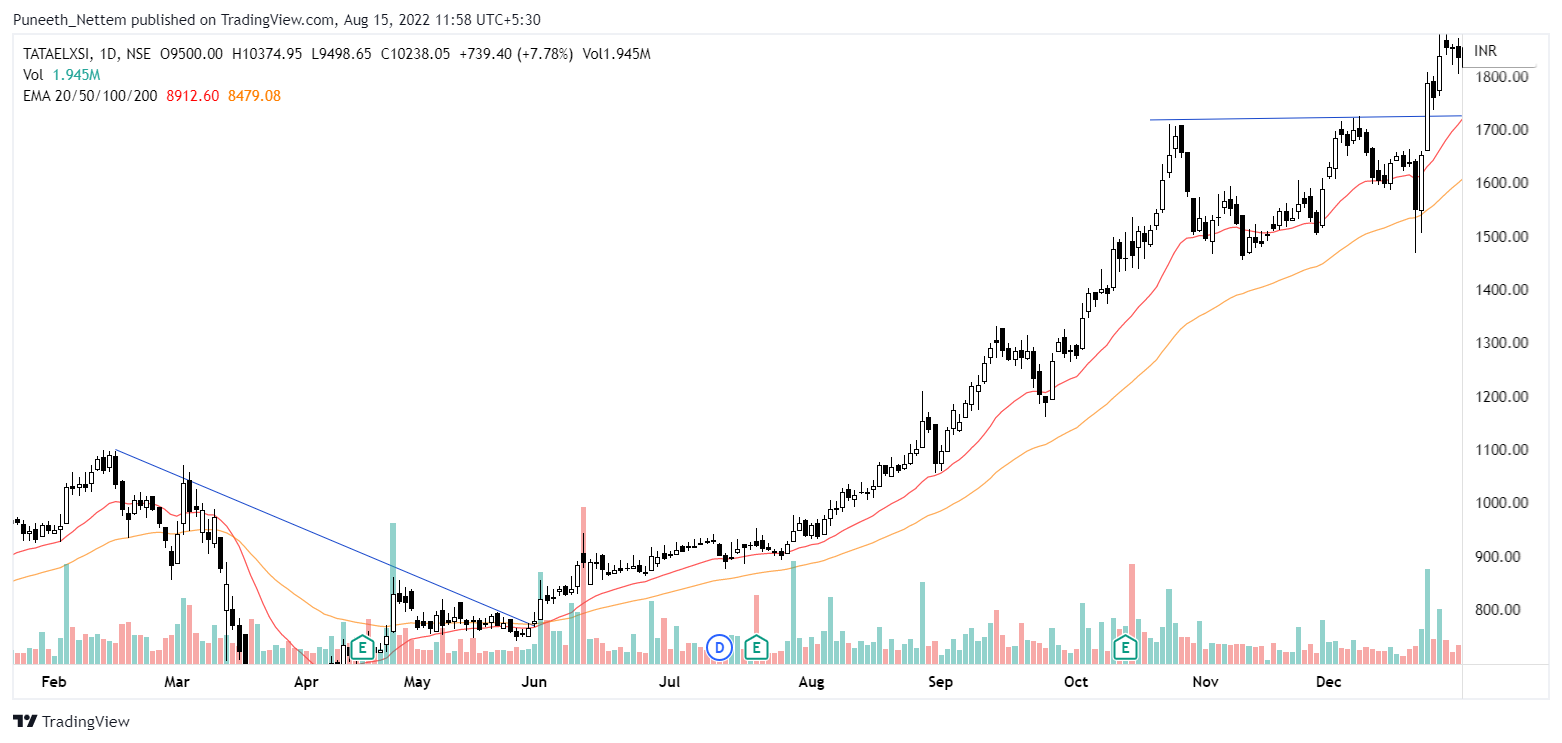
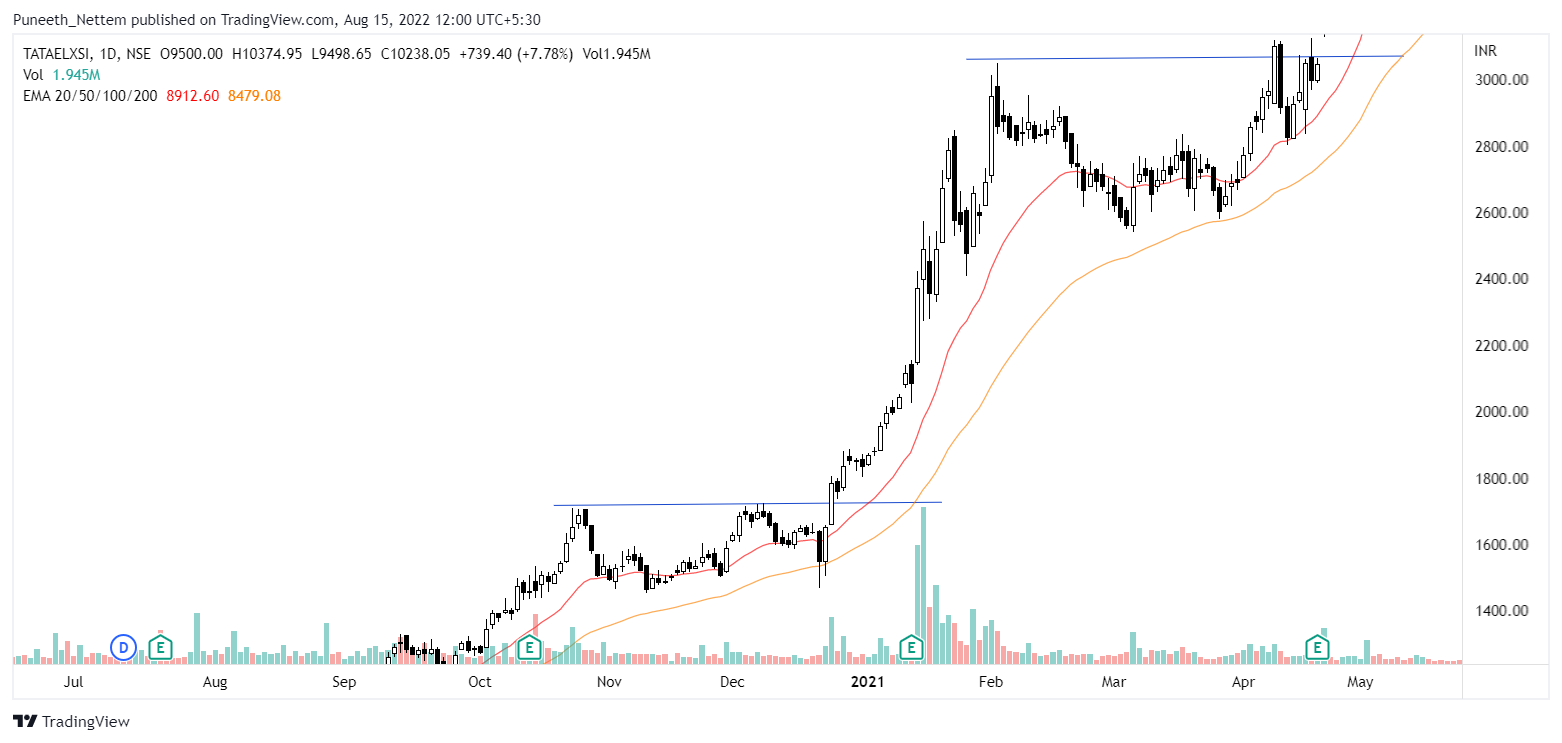
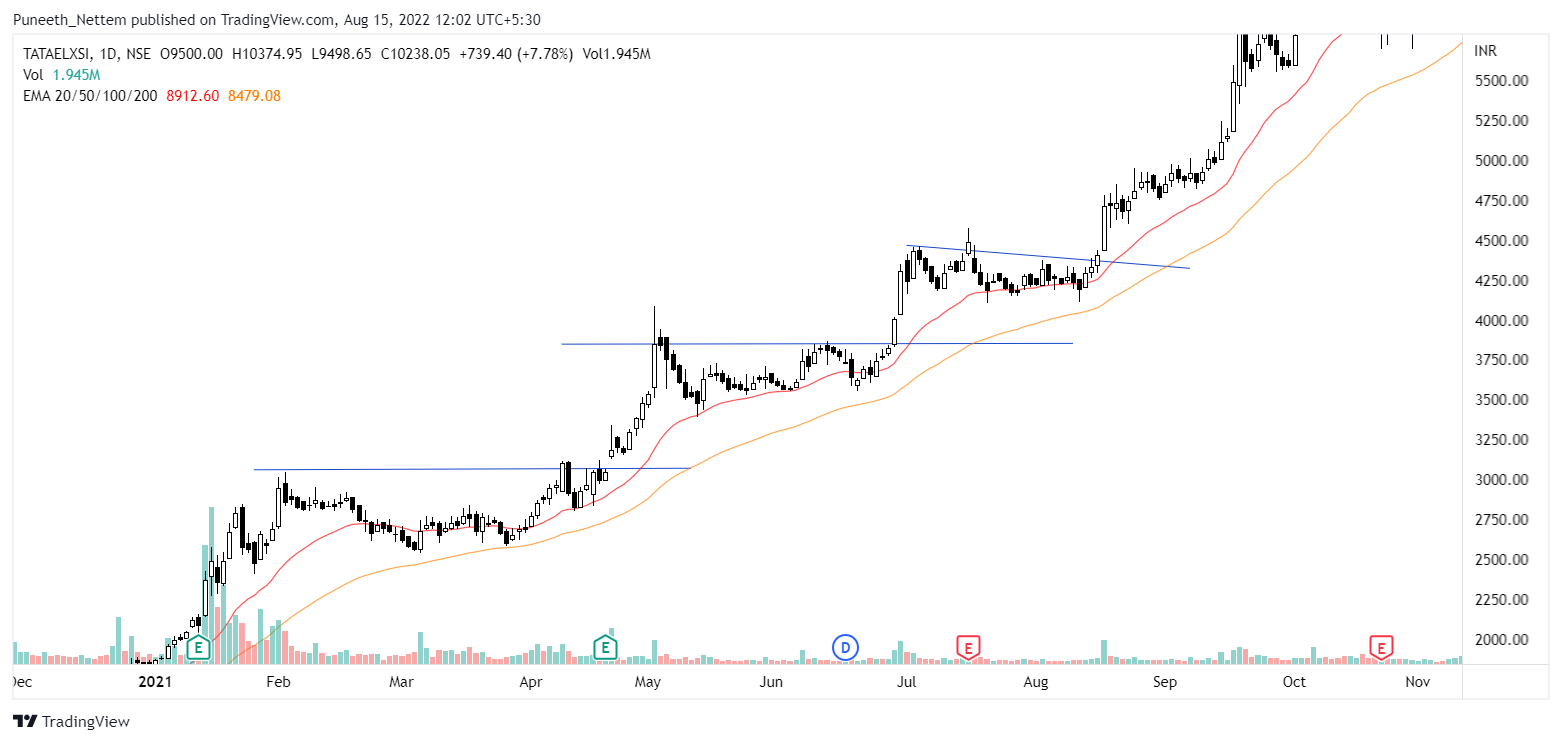
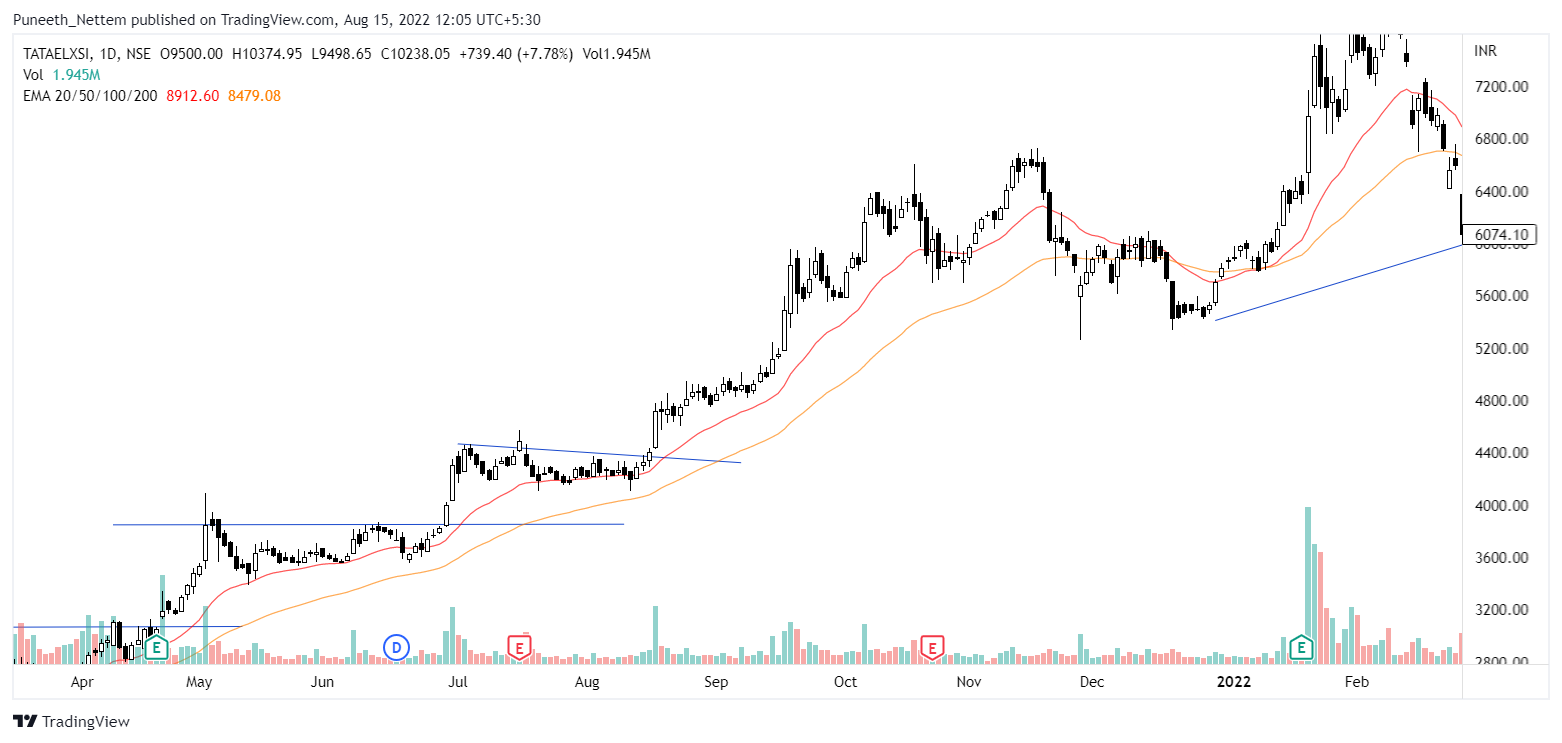
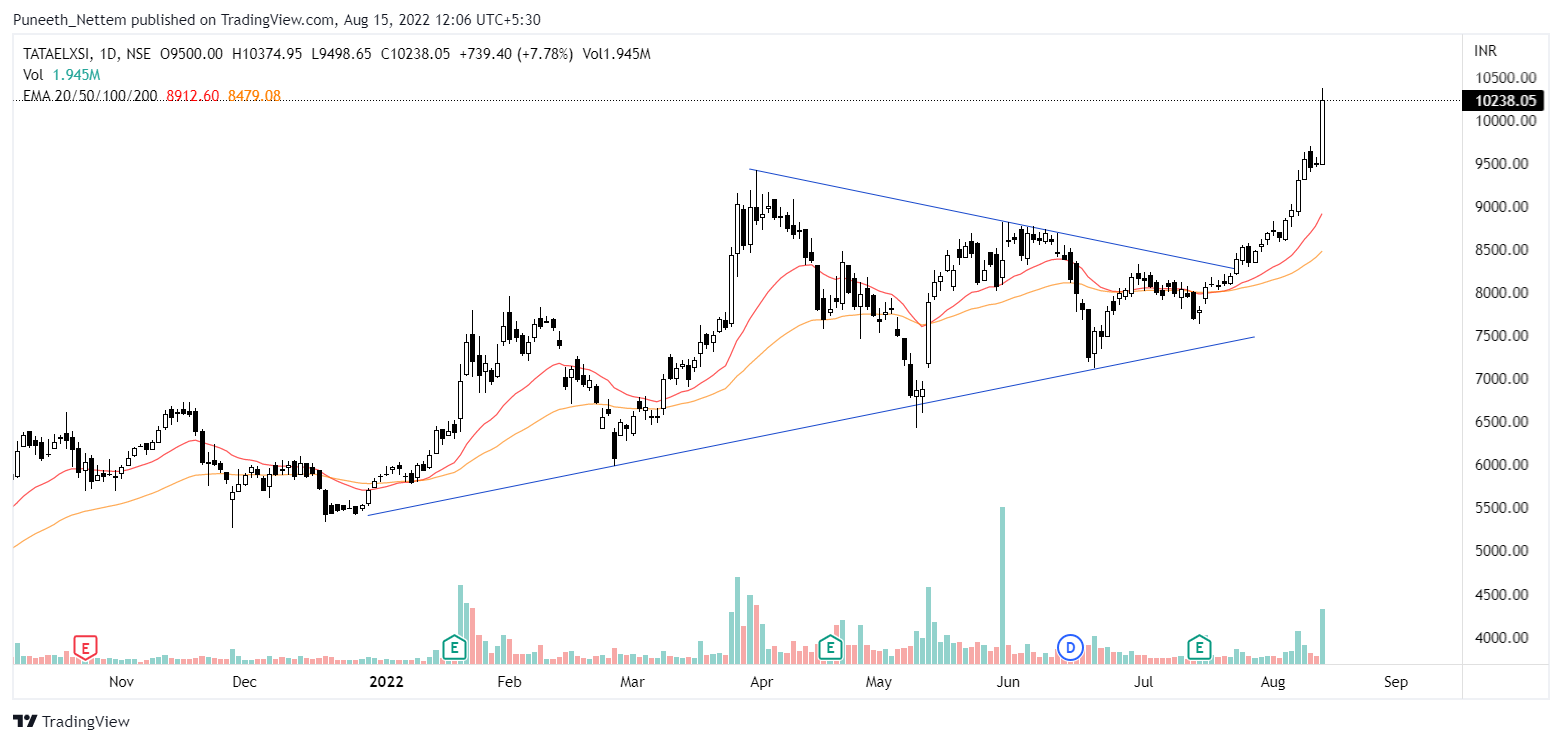
Let me explain this beautiful little concept(within the confines of charts in equity markets) with the help of this years big winner, Tata Elxsi.
Don’t stop at Tata elxsi, examine every winner you know, Saregama, Navin, Pitti, RACL, Elecon etc. Dont stop for covid bull markets, go back decades, go past countries, the patterns are countless and the experience priceless. Examine 1000s of winner stocks, and the same things repeat again & again.
A list of characteristics that I’ve compiled on breakouts after examining Indian winners.(The following took a long time to put together)
2. How I track them
I screen through Marketsmith India, Industry groups which look interesting(found autos, paper, and cinemas, capital goods interesting), and follow thematic indices on Tradingview. I keep watchlists where I add interesting stocks and track them as the come close to breakout.
3. How I buy and make SLs
Currently a work in progress as far as execution goes. I’m looking into keeping risk under 5% for most trades. Once I have a system set in stone, I will share.
Current Watchlist - (Will edit and add some more with charts in a day or two)
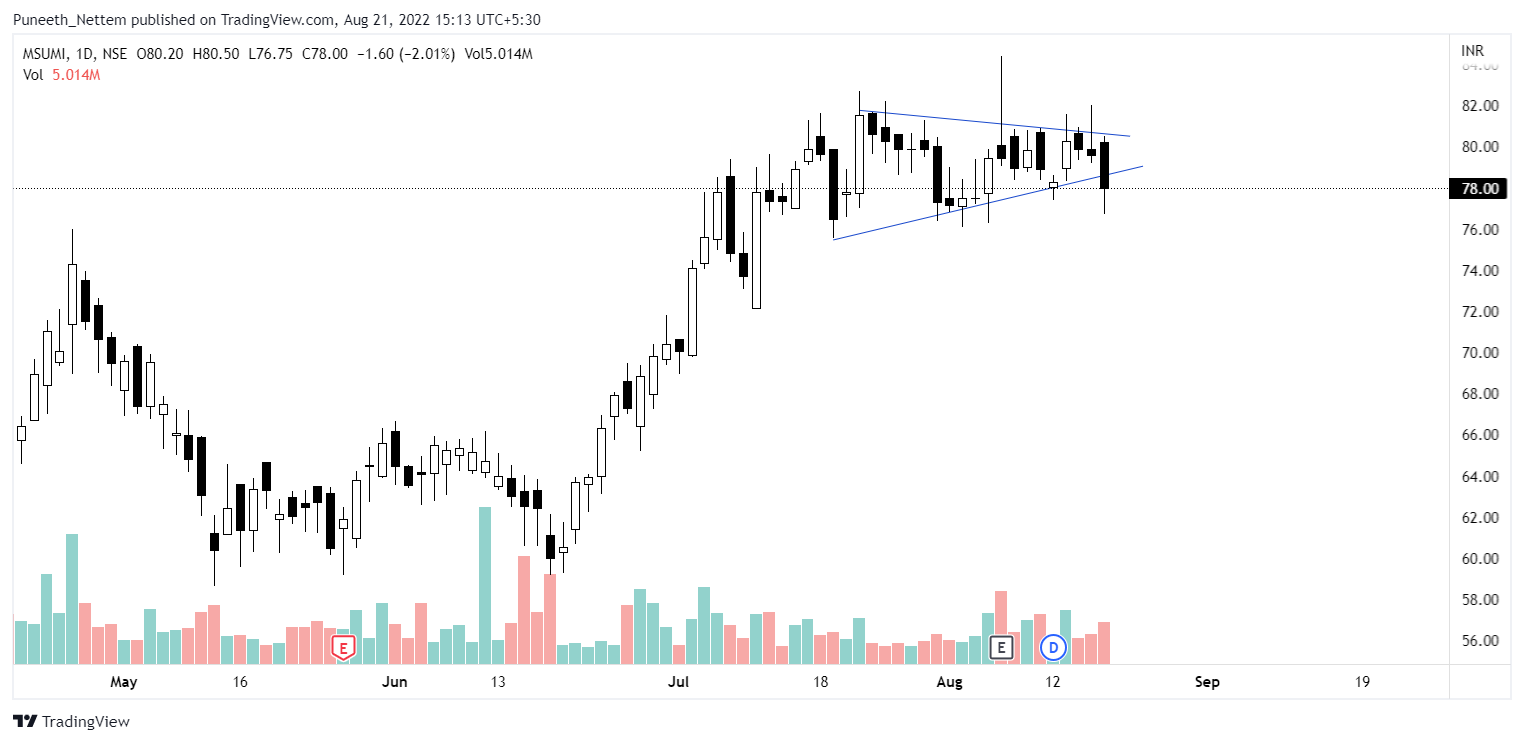
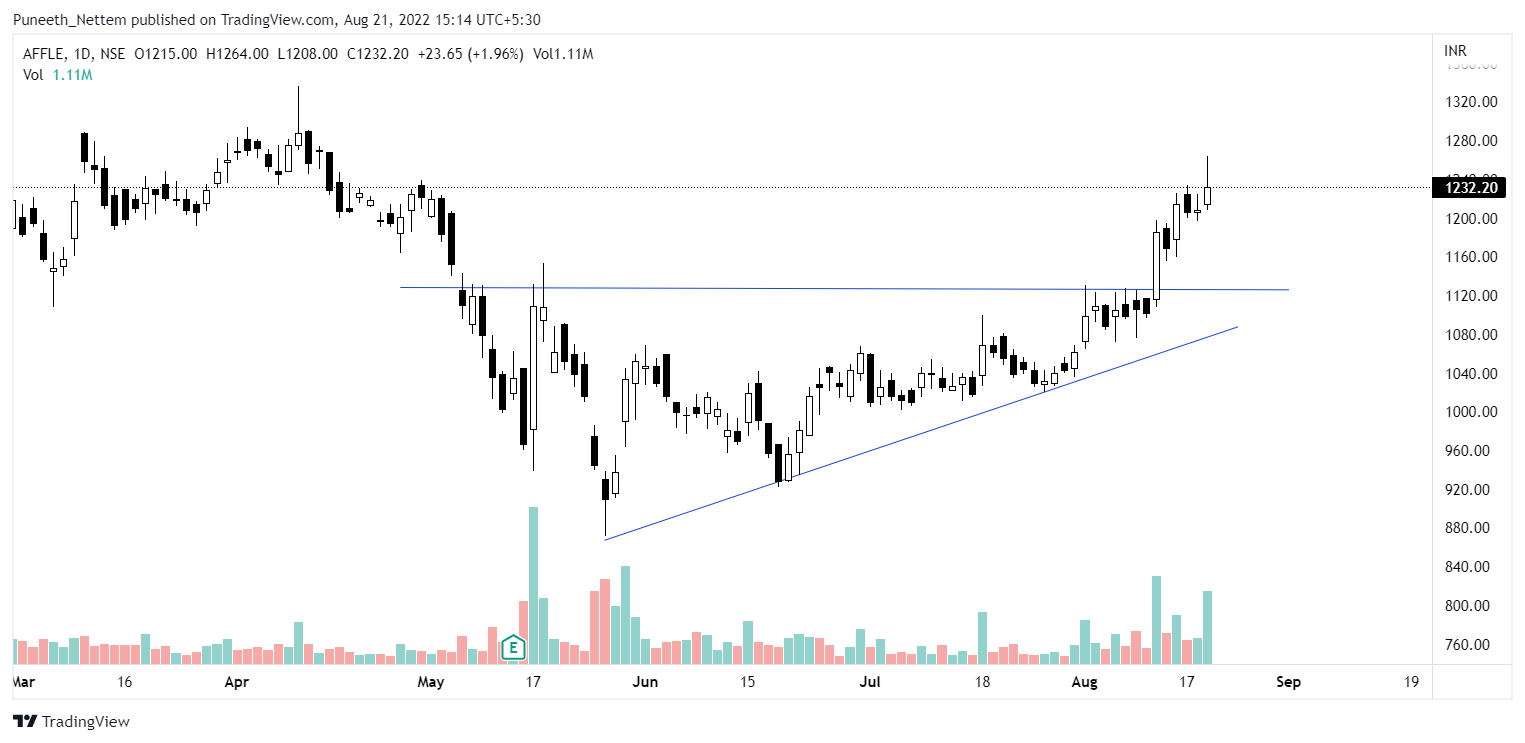
Final edit(19-08-22) - Will update on Sunday with a detailed post. Bought Msumi, added to Affle, Sandhar, and BDL. 3 of them are a part of testing for swing trades and quantities are small(this is to gain experience on using charts profitably)
Good day people,
Not much to go into dive today, as promised heres the update.
| Companies | Weightage | Cost | Gain% |
|---|---|---|---|
| Krsnaa | 34% | 605.3 | -20% |
| Cash | 40.3% | N/A | |
| Sandhar | 31.6% | 252 | -8% |
| Msumi | 3.9% | 81 | -3% |
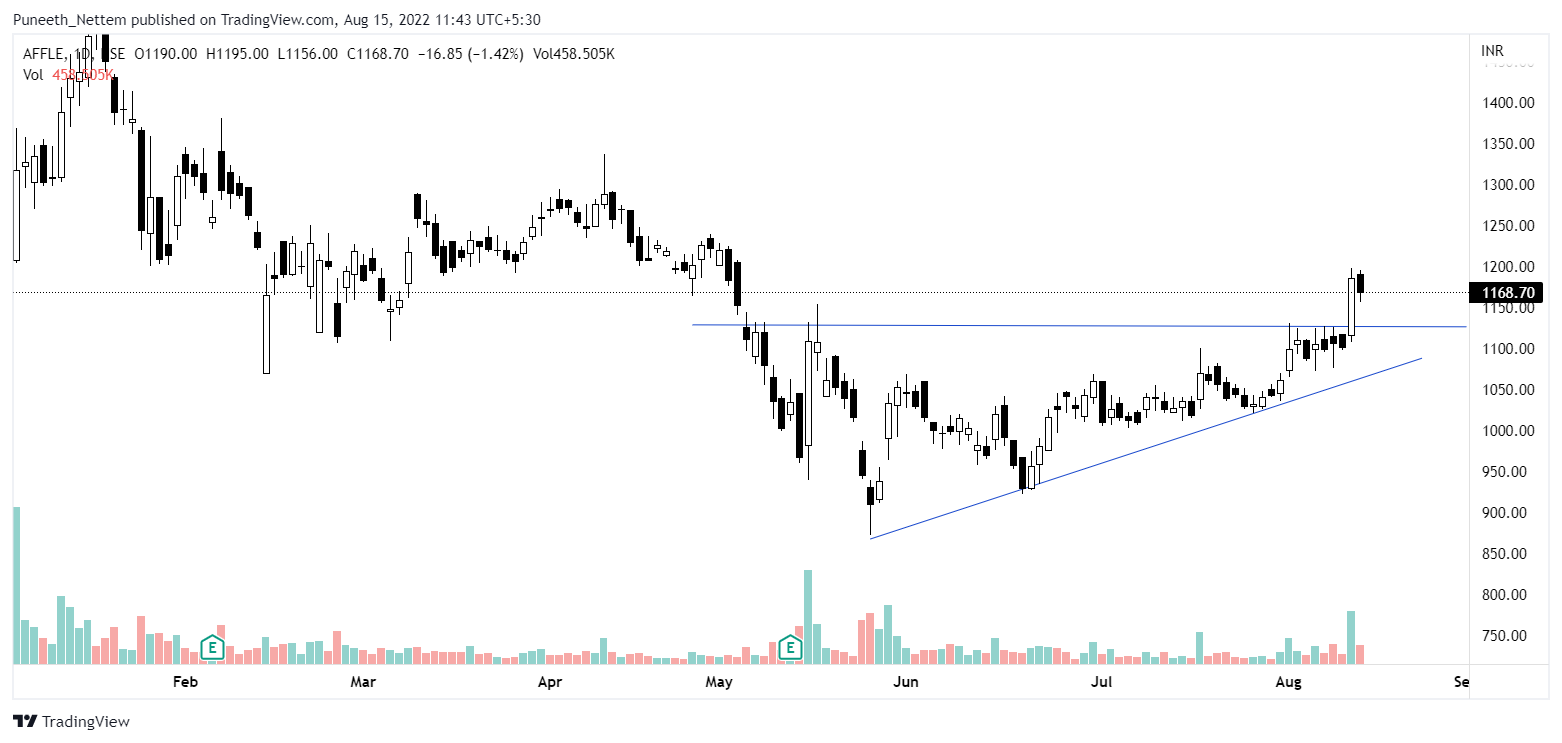
| Affle | 11.7% | 1170.71 | 5% |
| BDL | 5.3% | 856.6 | -1.33% |
(Overall adds up to >100% because of realised gains not being considered as Capital)
| My PF | CNXSMCALLCAP | NIFTY50 |
|---|---|---|
| 15.5% | -19.51% | -4.49% |
(From oct 20th 2021)
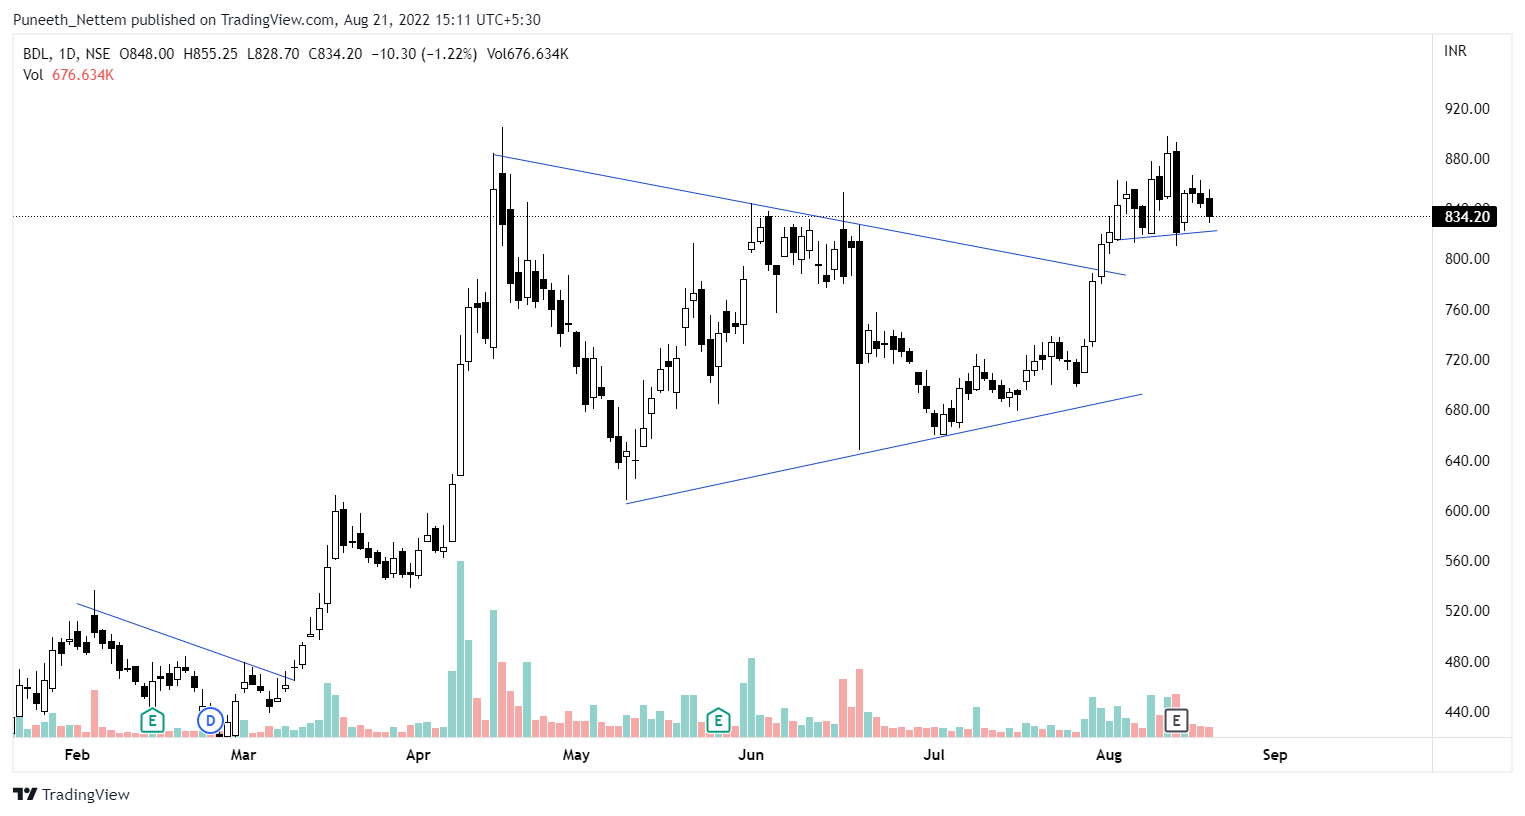
First off, the new major changes are the wing trades that I have entered namely, BDL, Msumi and Affle.
Technical rationale.(None are buy/sell recos much less from an amateur like me)
BDL
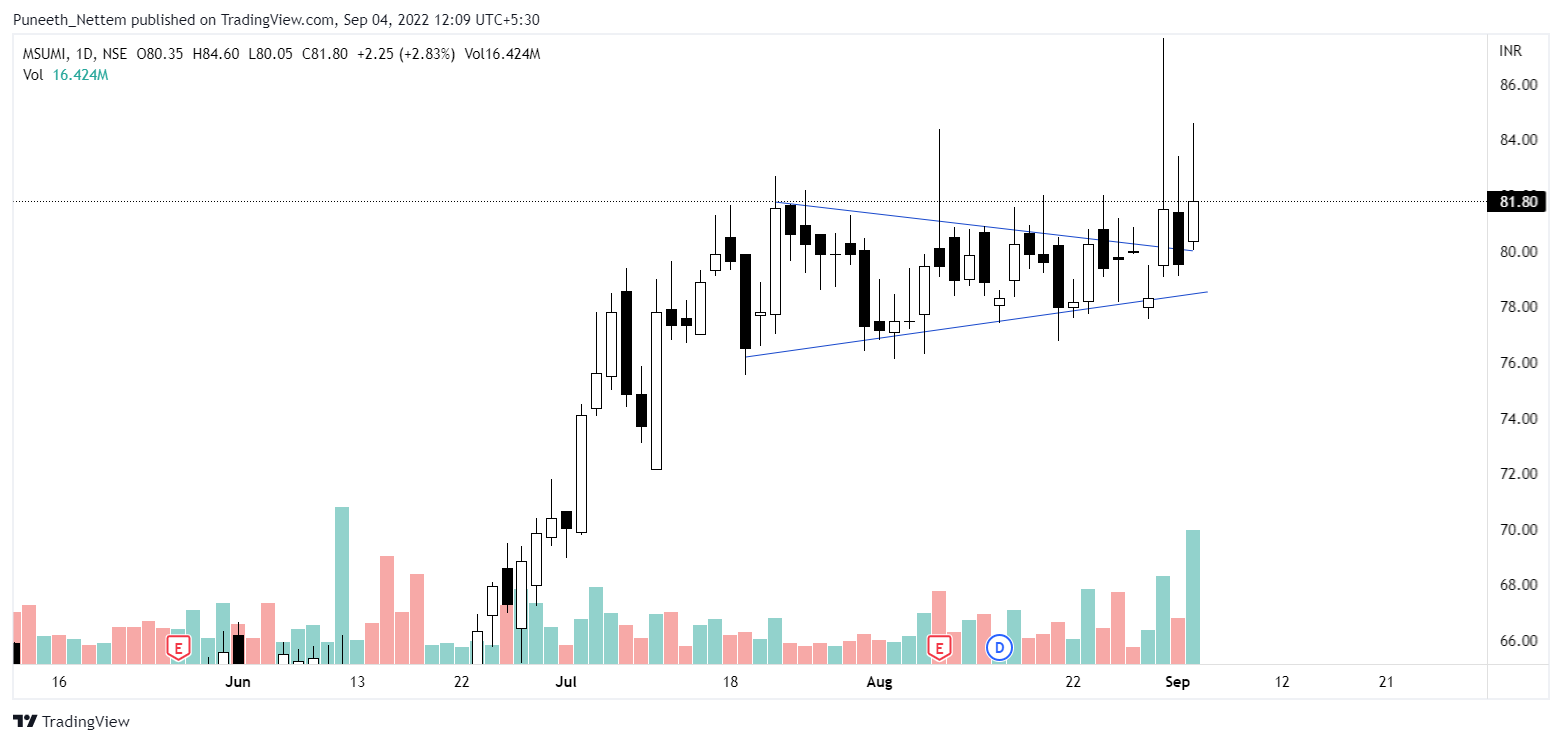
Msumi
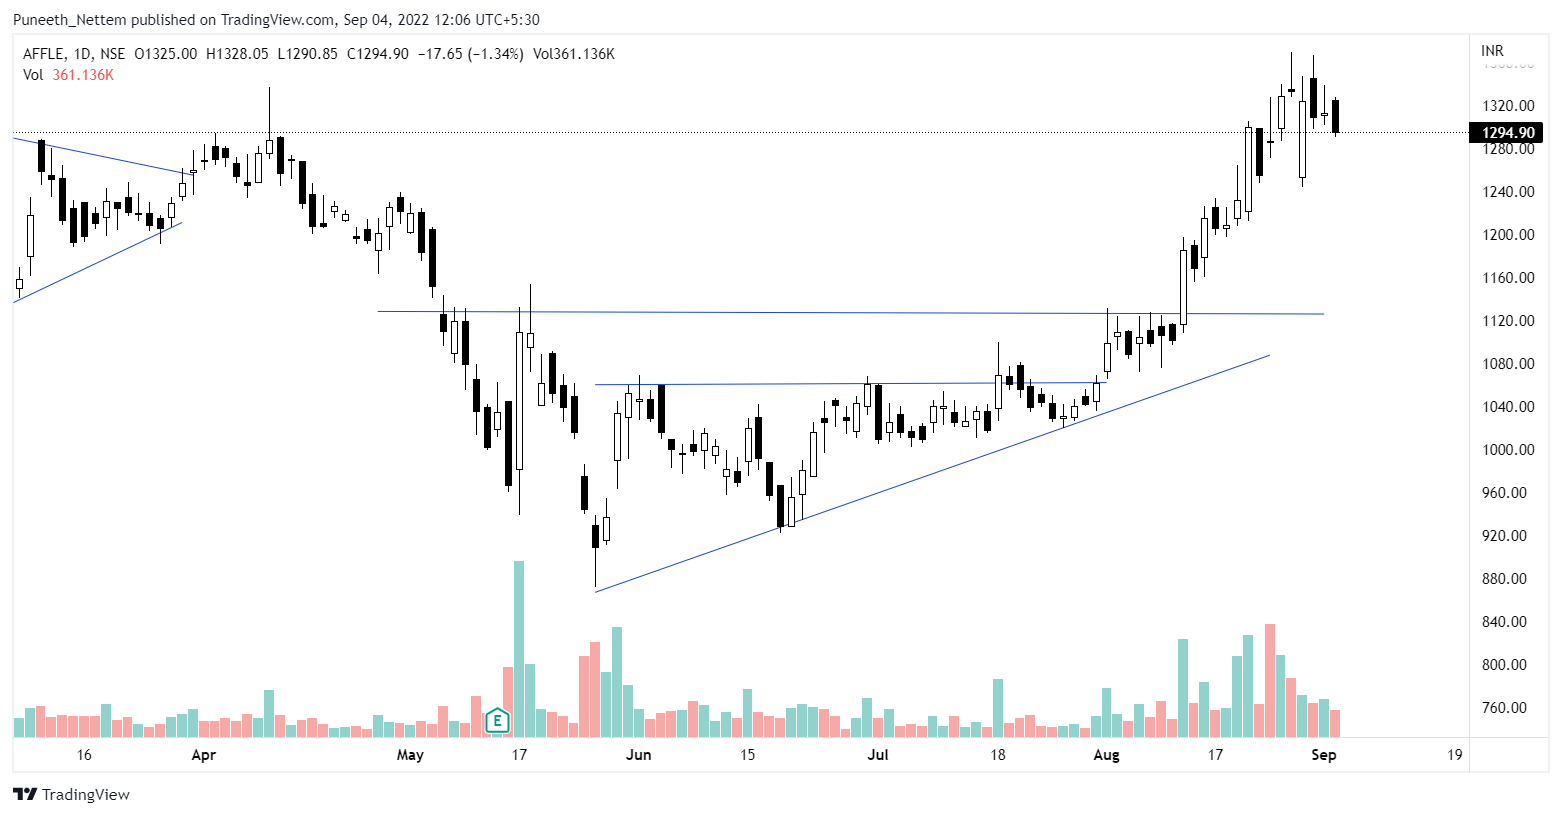
Affle
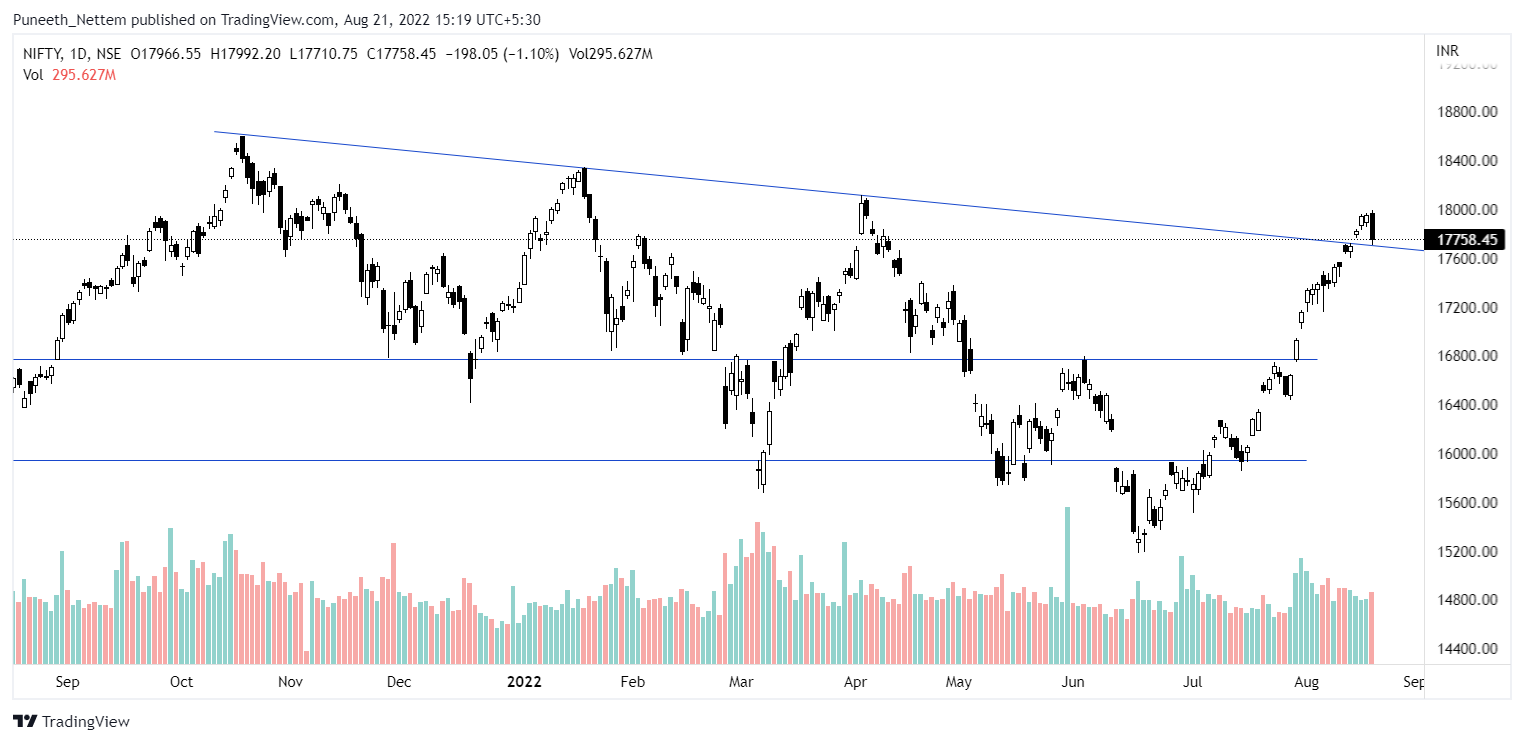
General Market
But aside from individual stocks, I remain a bit bearish on the broad market and in the medium term bullish on smallcaps. Please take this with a grain of salt, I dont base any of my trades purely on nifty but I do check it to see where we are. The following is my amateur interpretation.
Nifty broke out of a series of Lower Highs in what IMO is an unsustainable rally. I do think a minor correction might begin.
This broad market recovery was mostly large cap recovery, small caps and mid caps continue to languish a bit more. My own PF declined throughout the recovery(largely because Krsnaa)
If we nifty does breakdown over the Lower high I would have to be cautious with my swings.
@GrowingAlpha Thanks for the insights. This will surely help a lot of people.
Thank you for your kind words.
But I again bring to light that the following are my amateur opinions which may/may not work out. Hence please take broad market interpretations with a grain of salt and independent research.
Wanted to make a quick update(just shows how quickly things change), 85% of Sandhar shares got sold of on breakdown and hitting SL. BDL has been sold of due to charts too. Tiny position got added to Msumi. Again I won’t usually update for every tiny thing.
| Companies | Weightage | Cost | Gain% |
|---|---|---|---|
| Krsnaa | 34% | 605.3 | -20% |
| Cash | 58.3% | N/A | |
| Sandhar | 4.2% | 232 | -2% |
| Msumi | 8% | 80.7 | -0.5% |
| Affle | 11.7% | 1170.71 | 13% |
| SJS | 5.9% | 479 | 1.8% |
(Overall adds up to >100% because of realised gains not being considered as Capital)
| My PF | CNXSMCALLCAP | NIFTY50 |
|---|---|---|
| 14.93% | -19.1% | -4.93% |
Major changes
Good day everyone!
Today we will be going through a lot of things, where I made money this week and updates. Will do a comprehensive analysis of my mistakes and misses of the week, + Learnings from doing momentum and how I wll go forward.
Warning - this will be a chart heavy post. Also if you want a better understanding of what I’m doing please go through the thread, where I gave a concise explanation of what I’m doing(VCPs, BOs). Nothing is a reco, especially not from an amateur like me.
All suggestiong and critiques are very welcome!
Before we begin, pf performance from OCT 20th 2021 is as follows -
| My PF | CNXSMCALLCAP | NIFTY50 |
|---|---|---|
| 16.6% | -18.9% | -5.69% |
Pf alloc of today stands like so.
| Companies | Weightage | Cost | Gain% |
|---|---|---|---|
| Krsnaa | 34% | 605.3 | -20% |
| Cash | 17.2% | N/A | |
| Sandhar | 4.2% | 232 | -3.4% |
| Msumi | 10.5% | 80.9 | 1.04% |
| SJS | 11.8% | 494 | 6% |
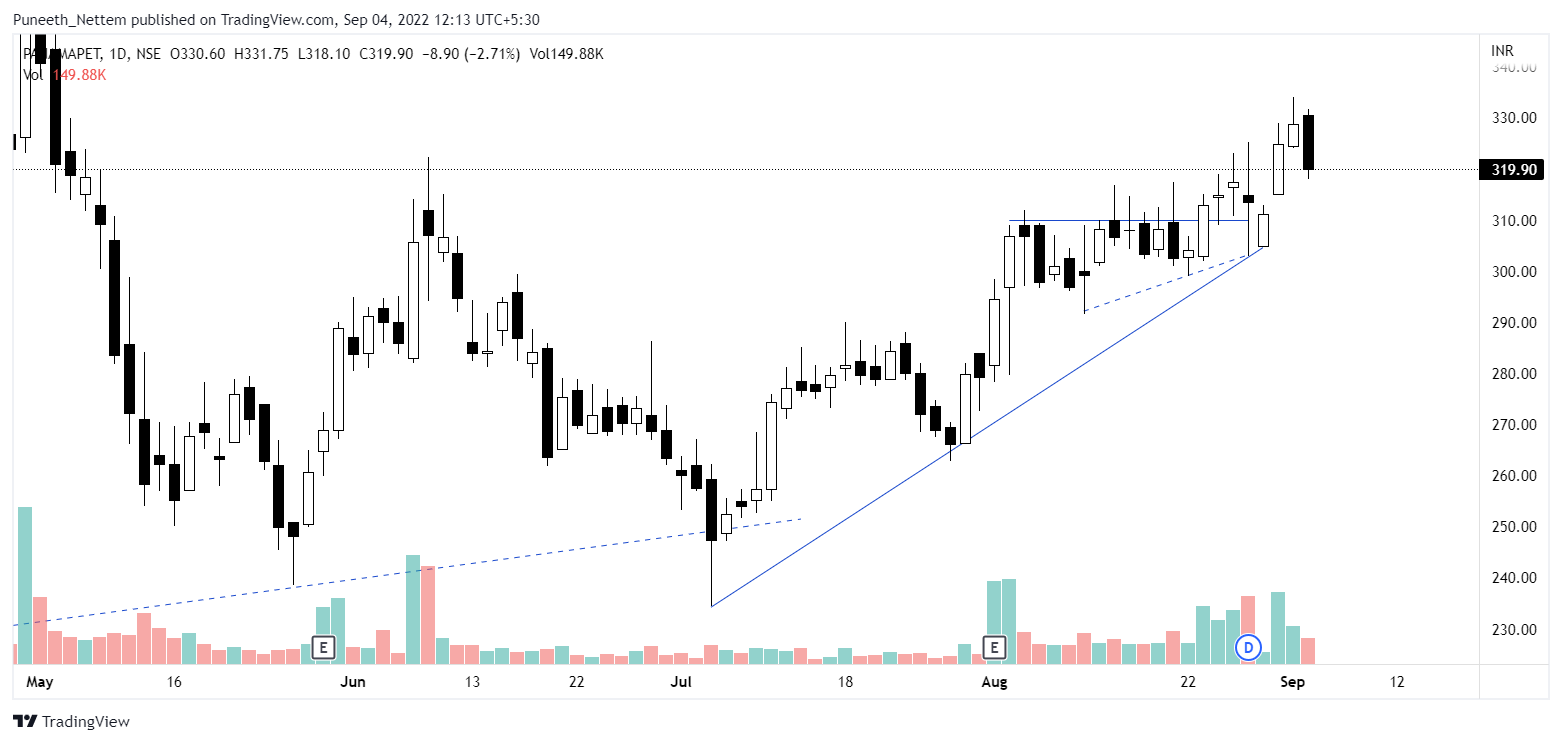
| Panama | 15% | 322 | -0.6% |
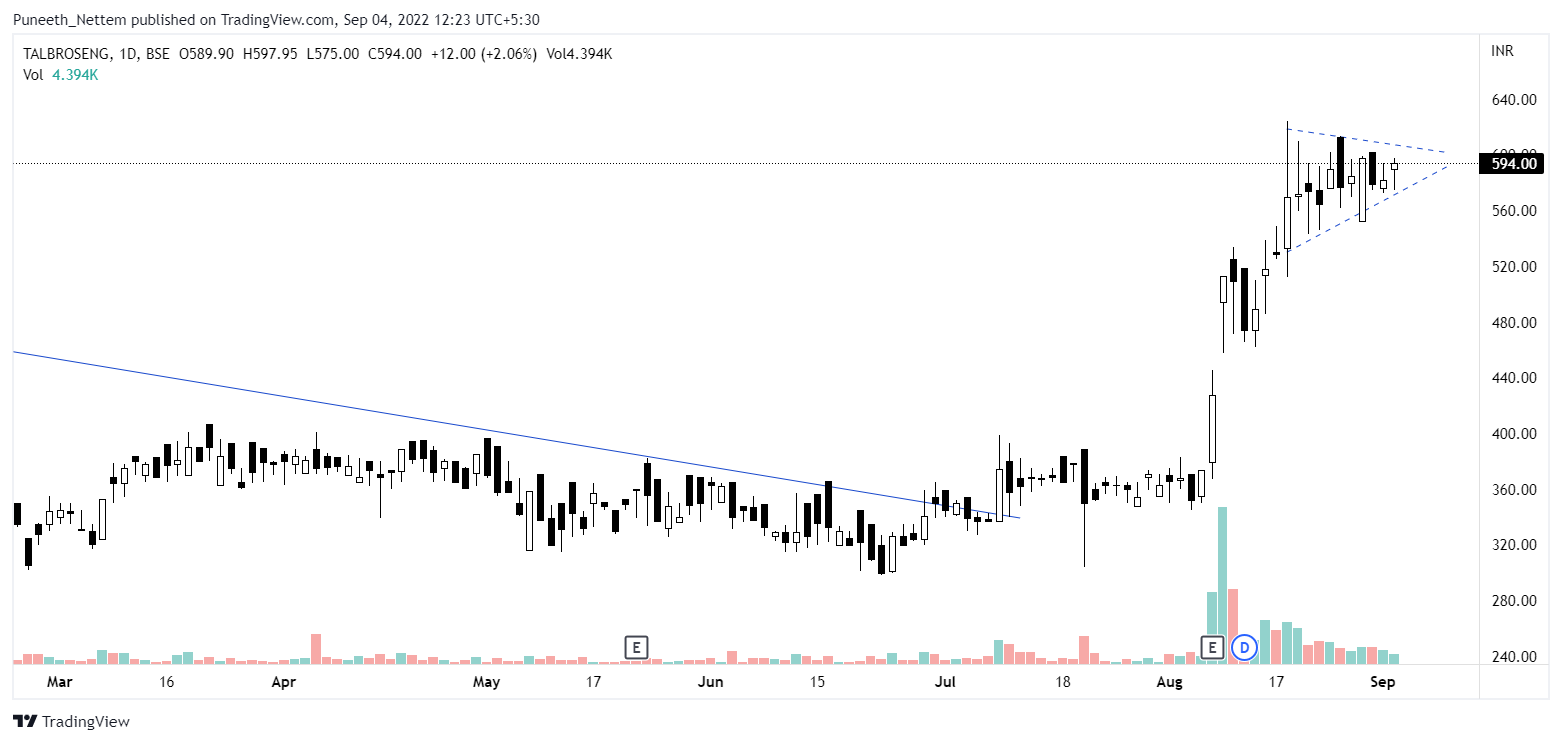
| Talbroseng | 9.6% | 589 | 0.7% |
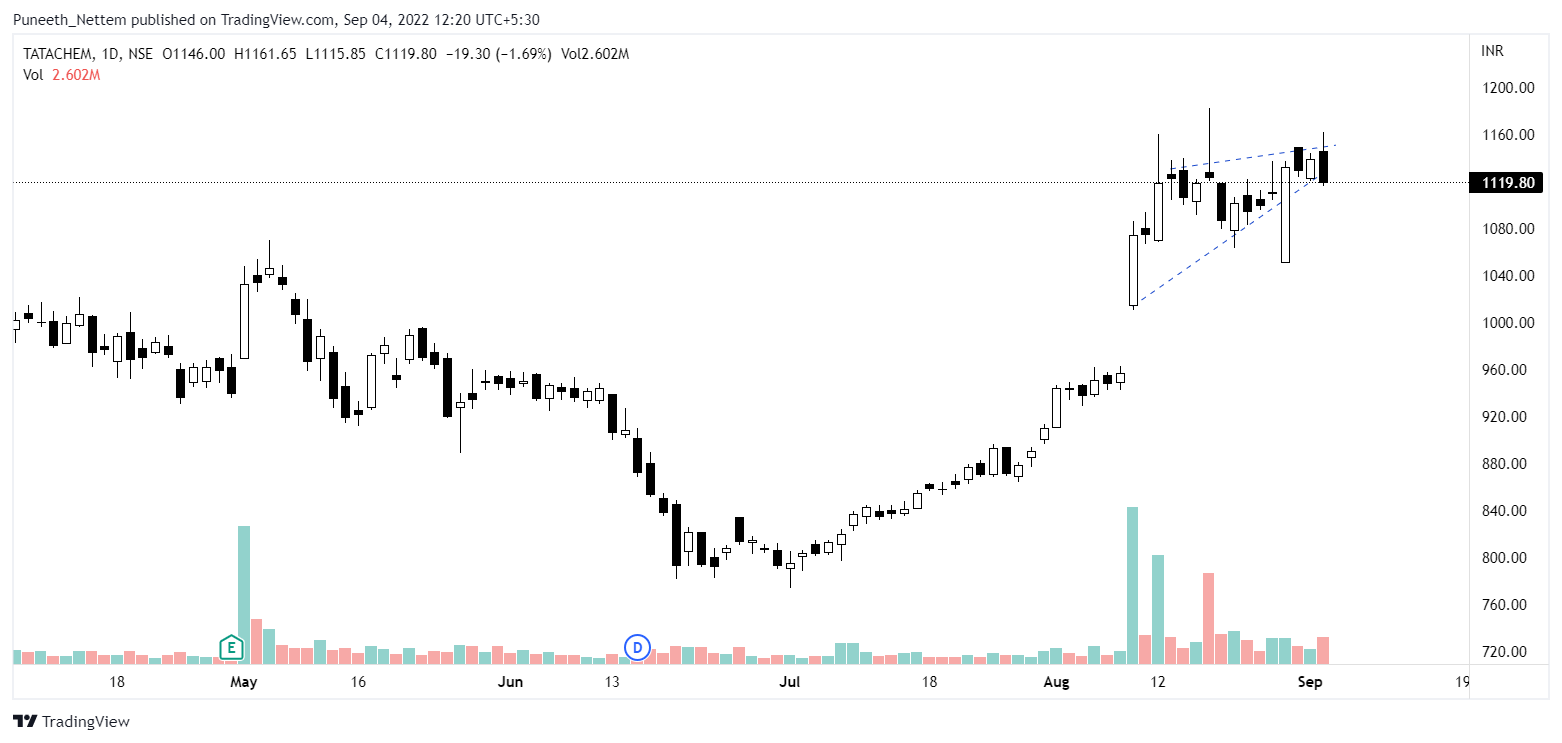
| Tatachem | 7% | 1143 | -1.69% |
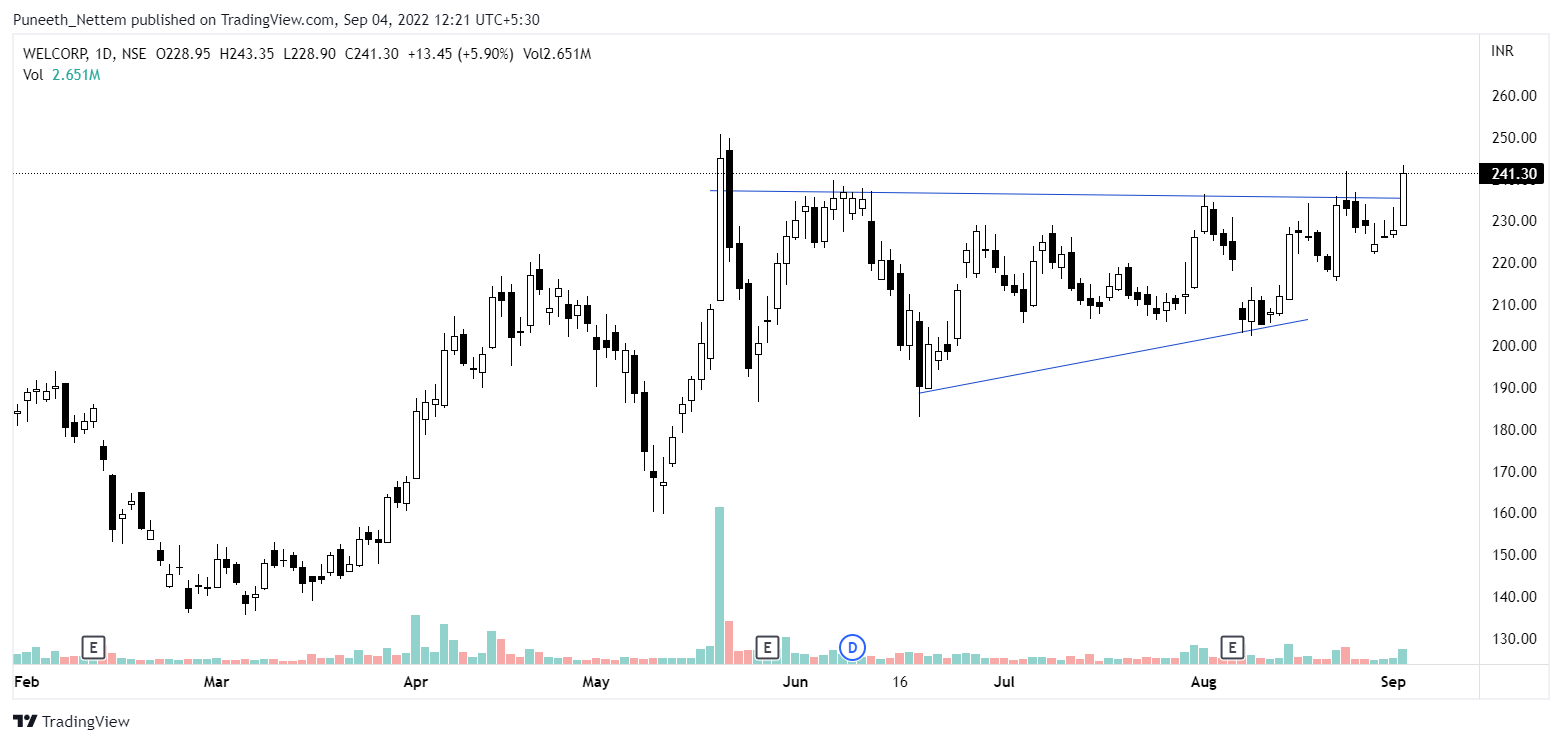
| Welcorp | 9% | 241.3 | 0.1% |
Numbers will add up to >100% as booked profits of the year is not considered as capital employed.
For those that havent seen my previous thread.(although I’d recommend checking them out)
What I look for -
Misses of the week(That I promise I won’t beat myself for ![]() )
)
FCL(miss of the year tbh)
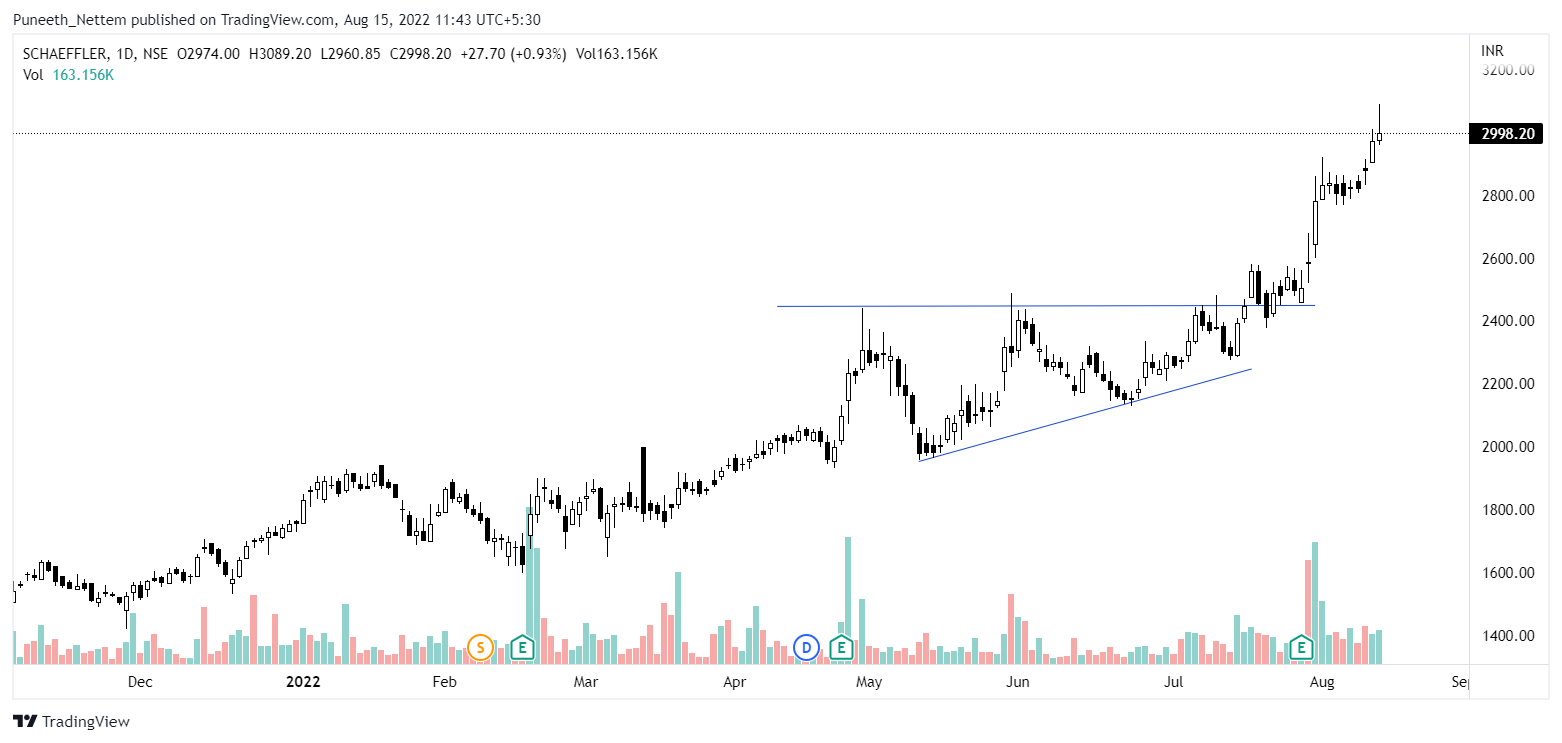
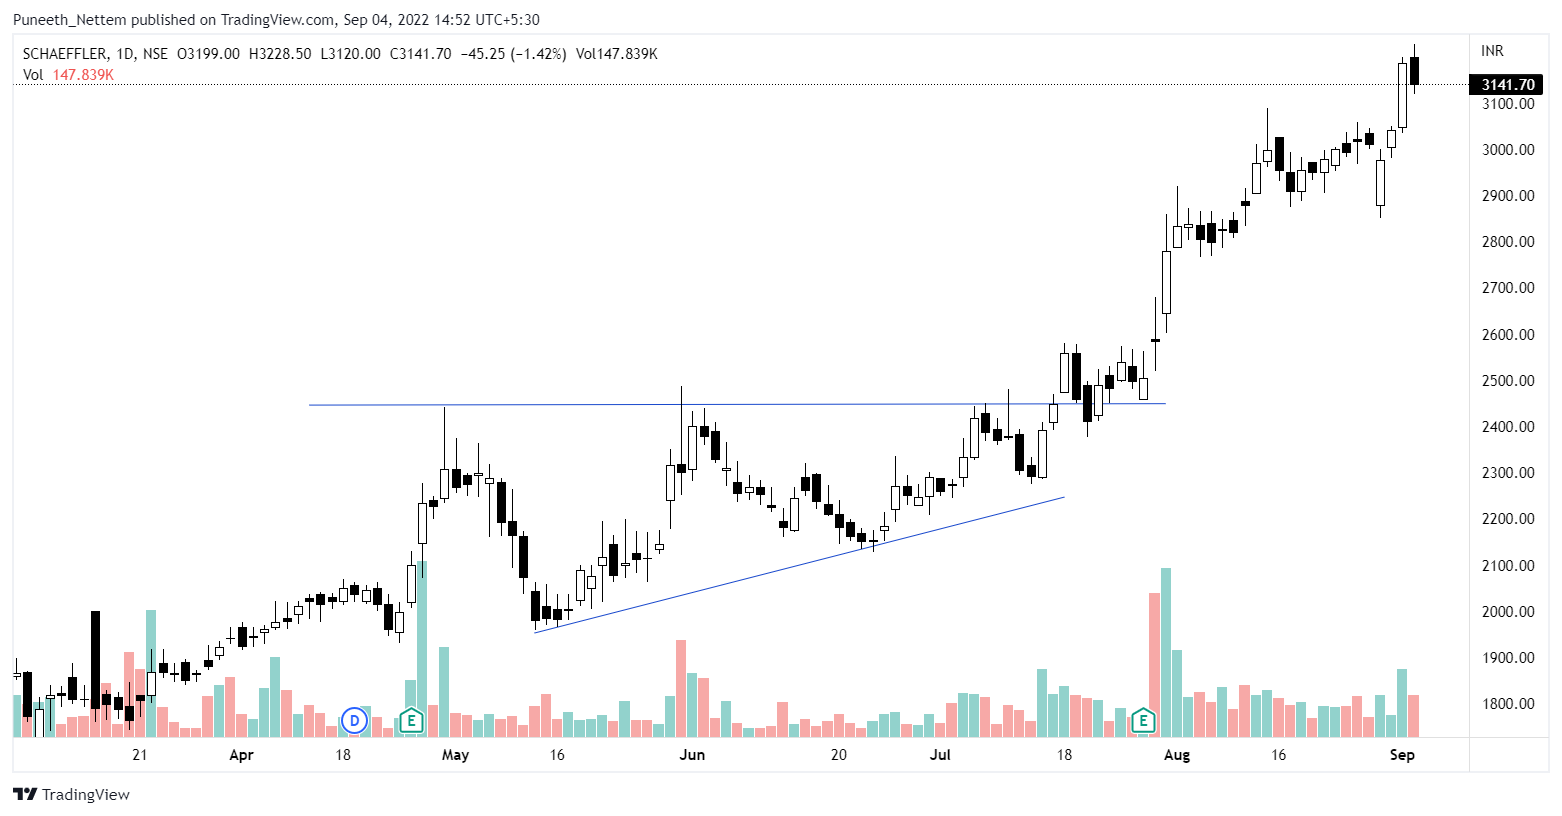
Schaeffler
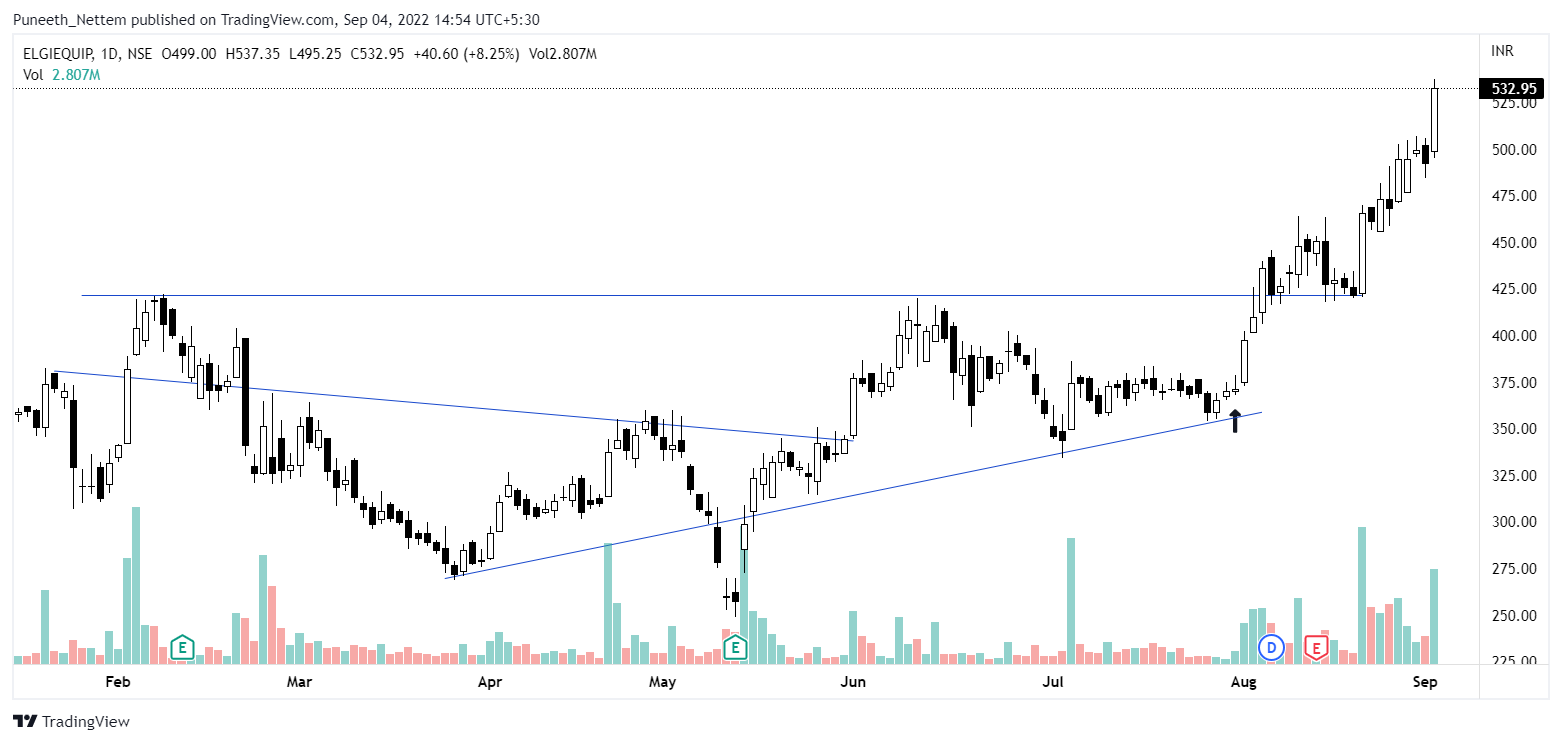
ElgiEquip
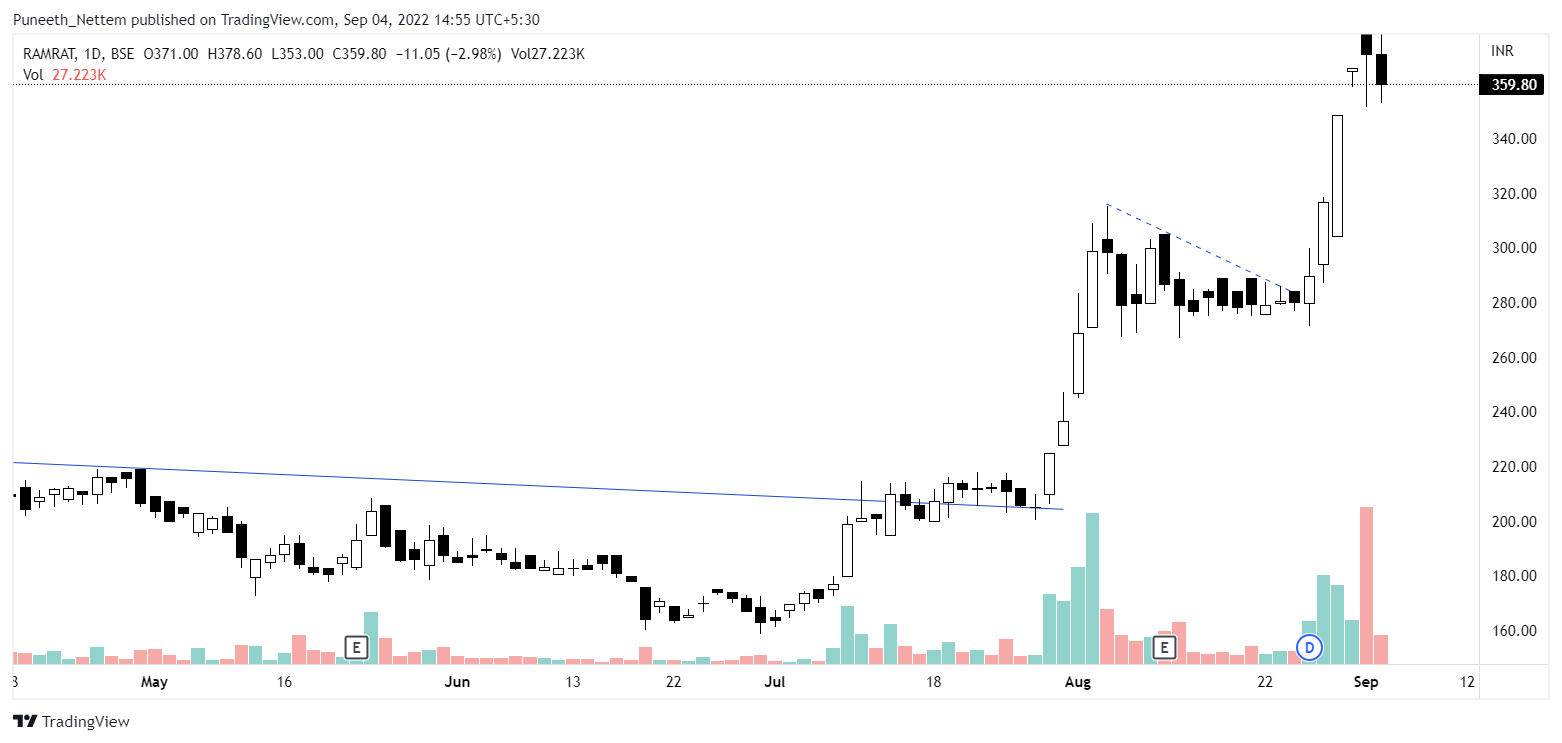
Ramratan Wires
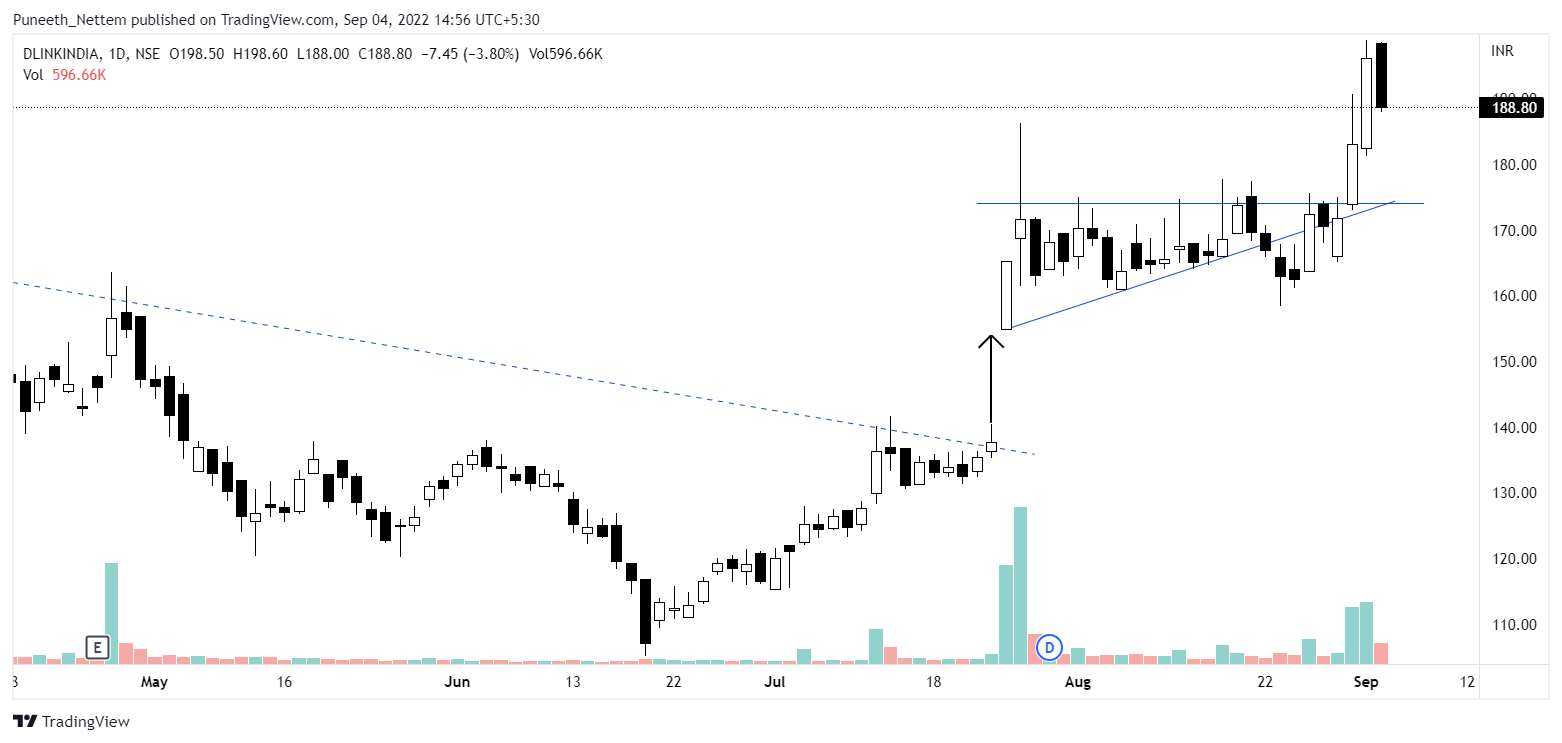
Dlink India
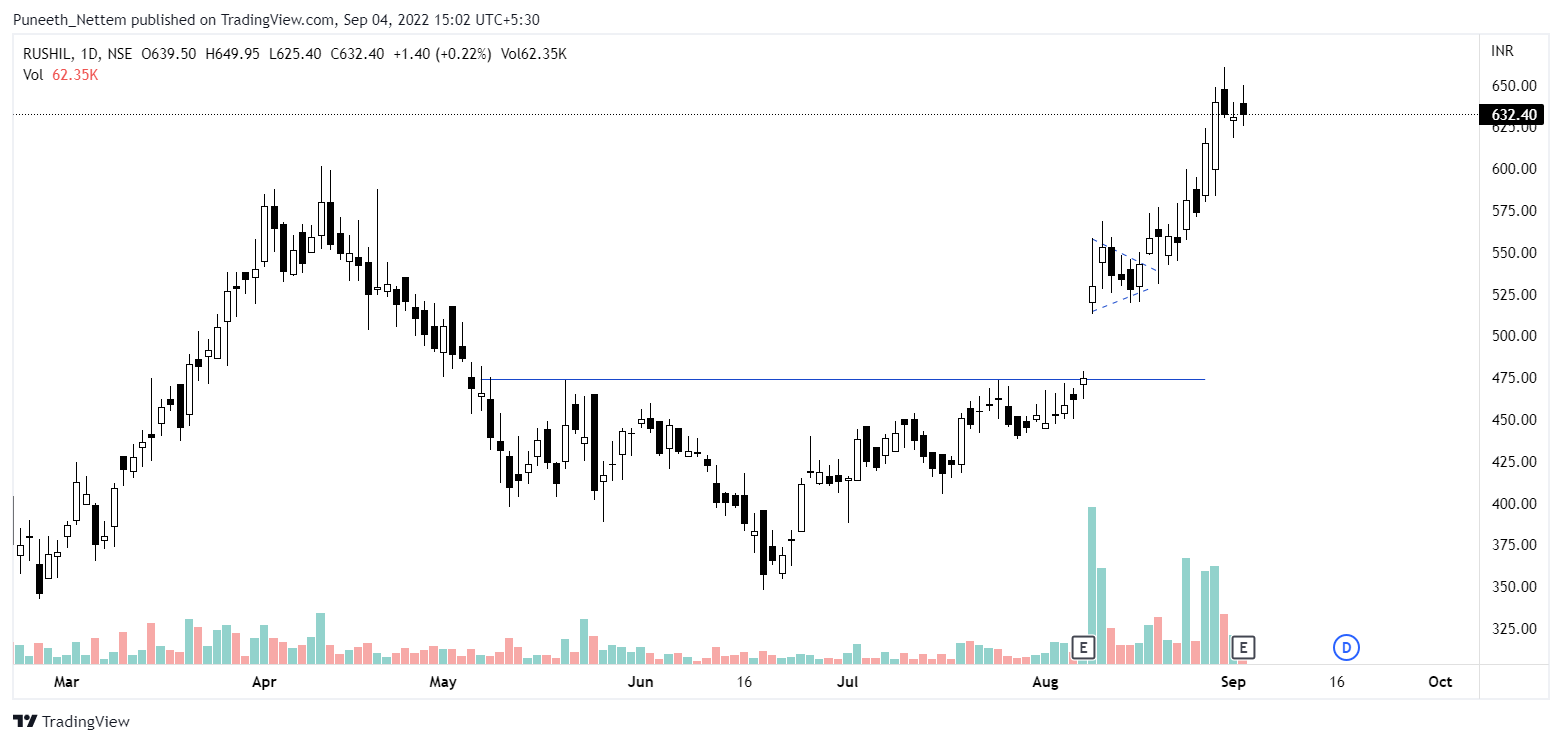
Rushil Decor
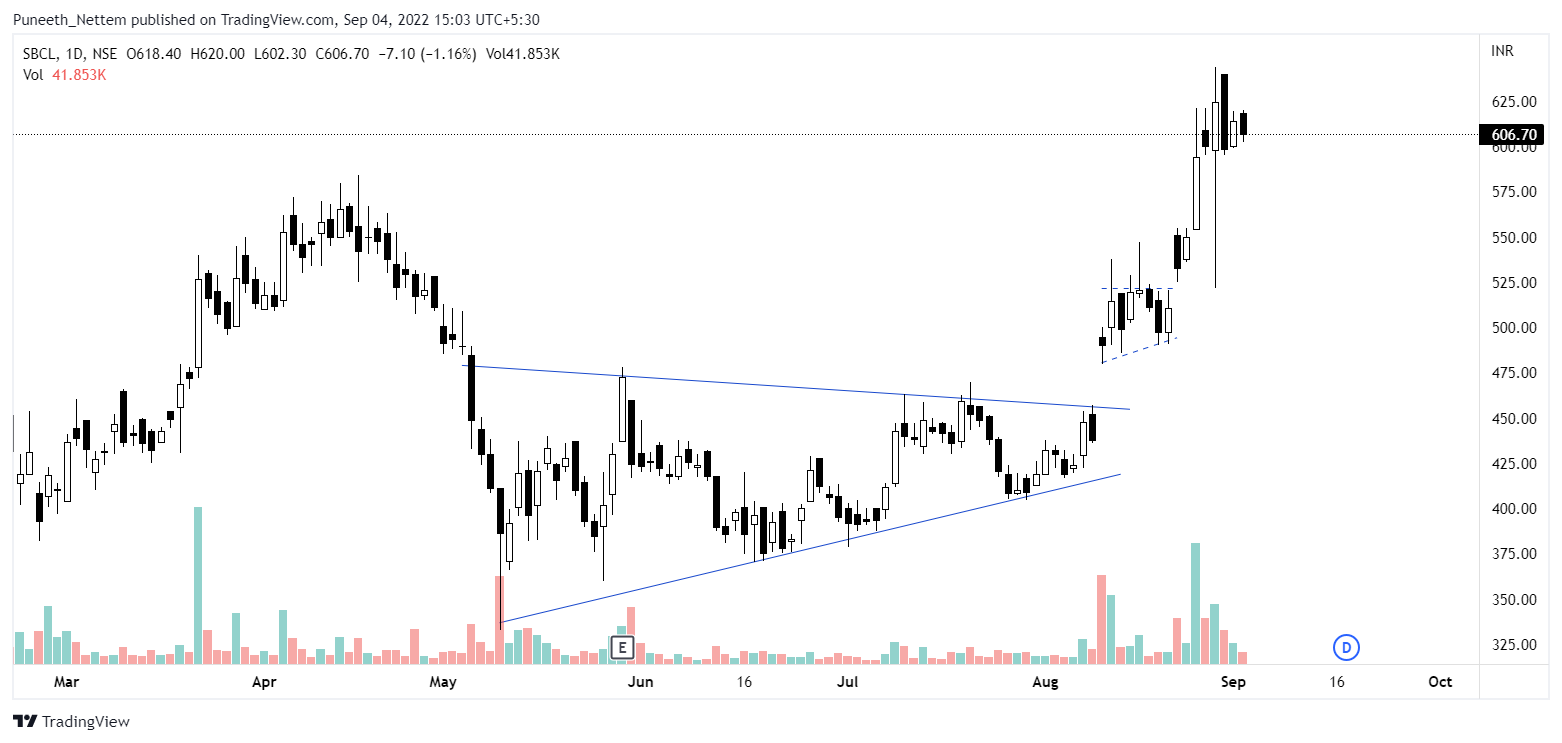
SBCL
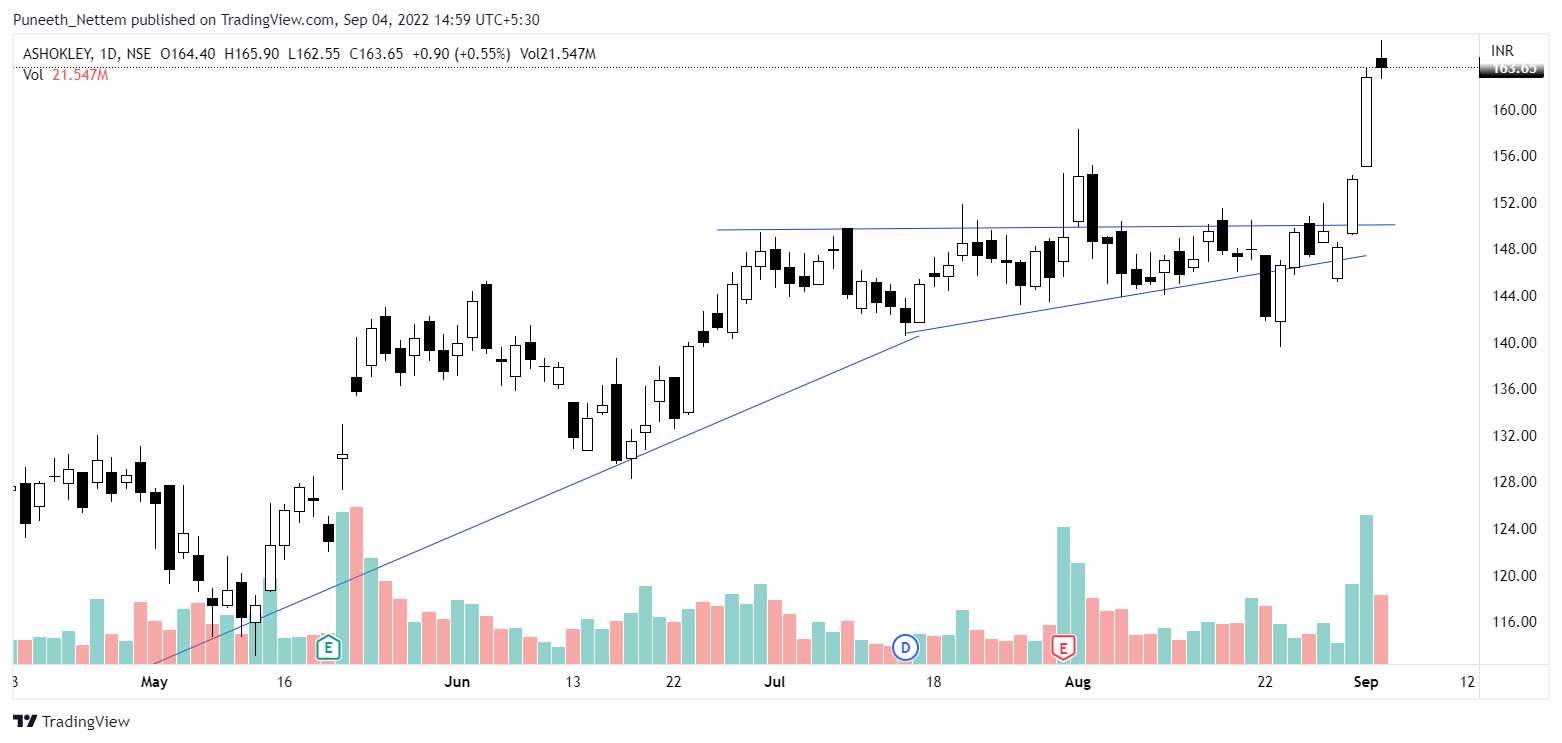
Ashok Leyland
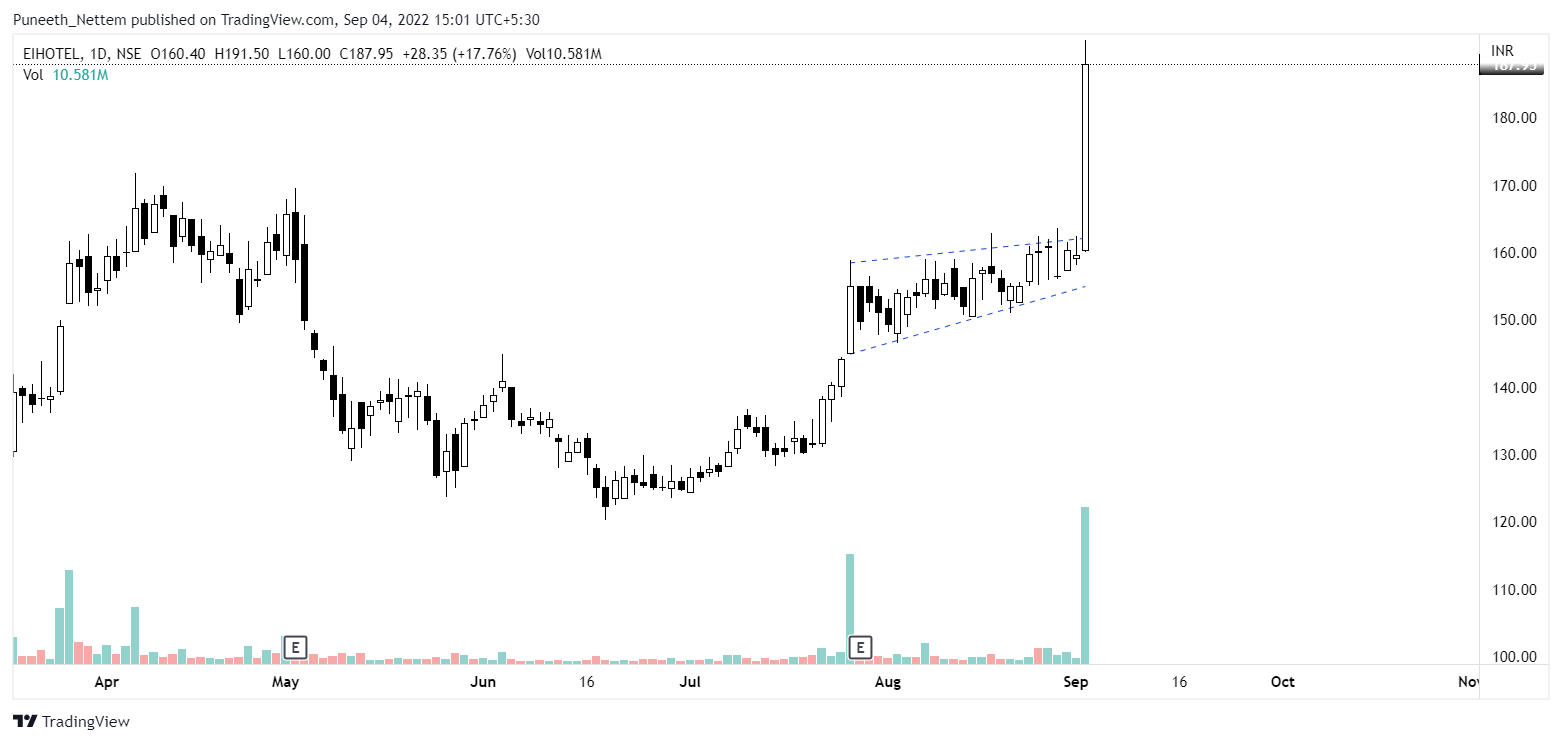
EIH
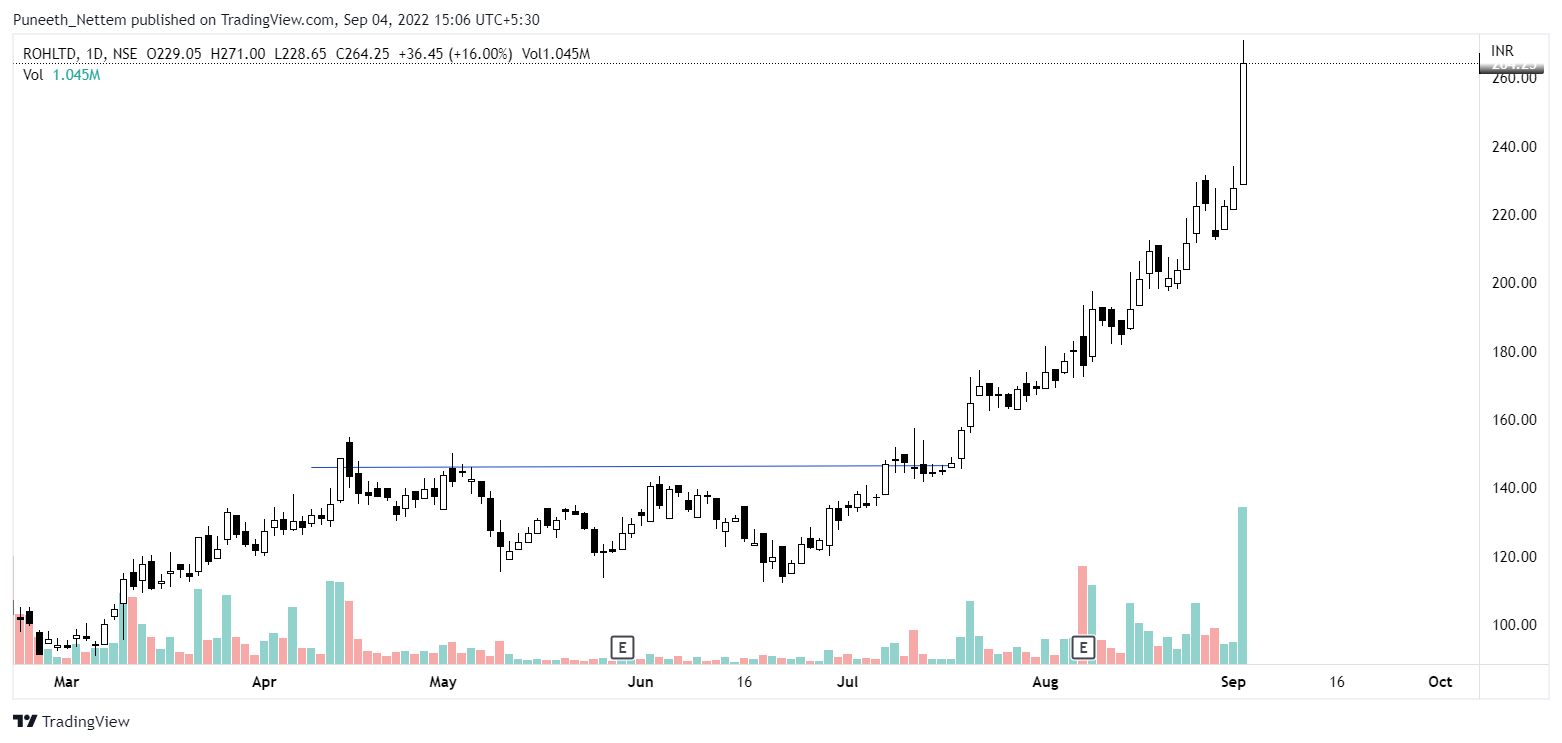
Rohl
Currently in PF + Hits of the week.
Affle
Msumi
SJS
Panamapet
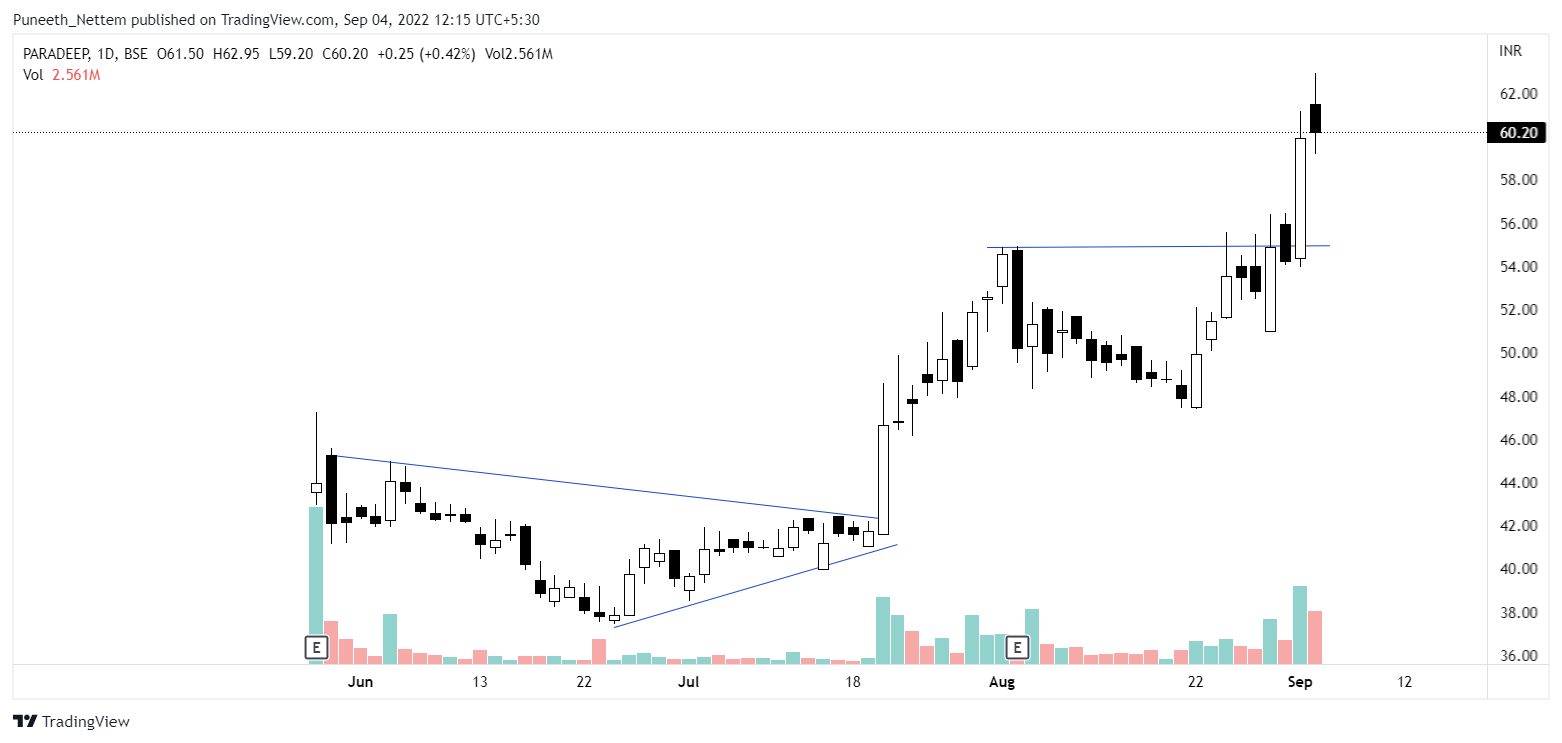
Paradeep Phosphates
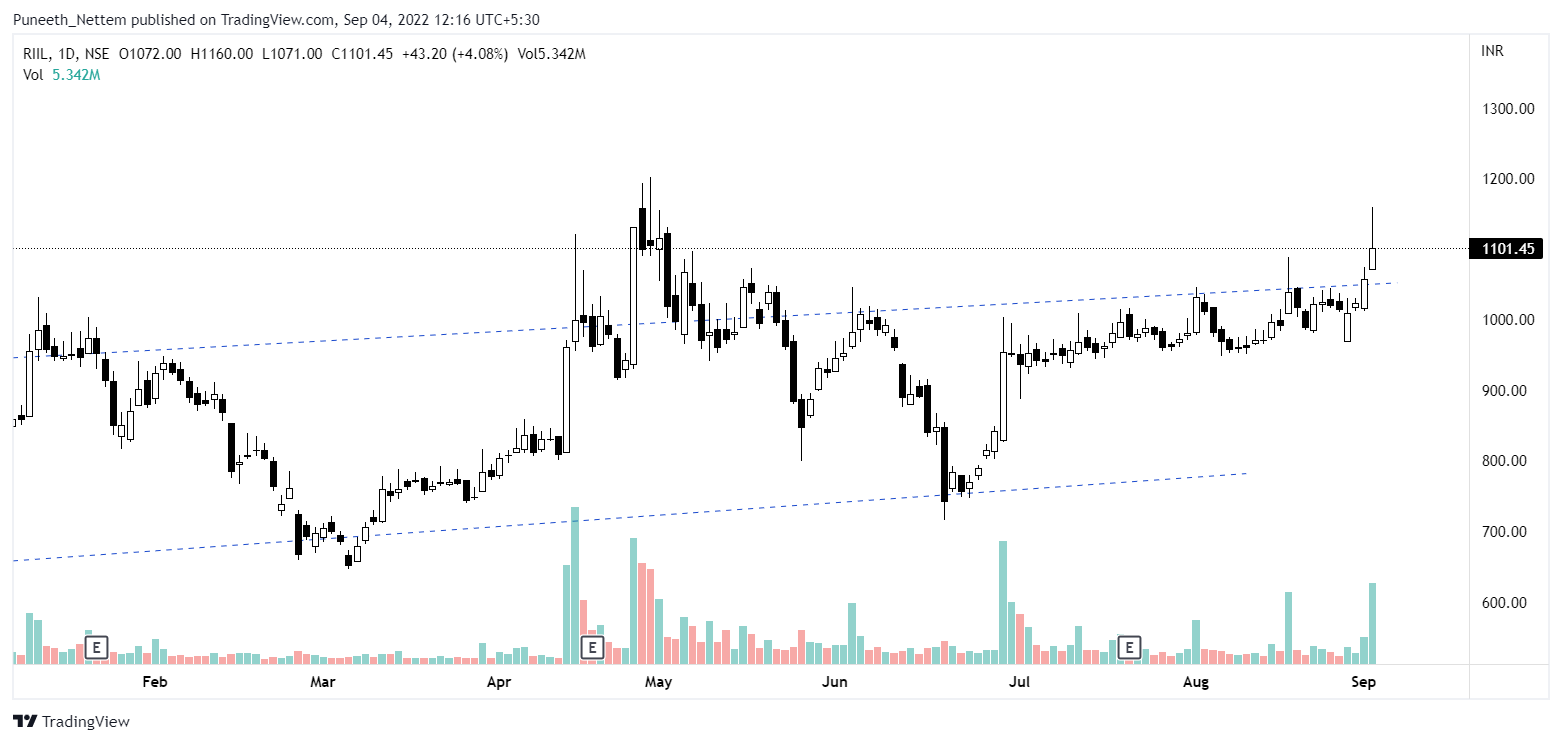
RIIL
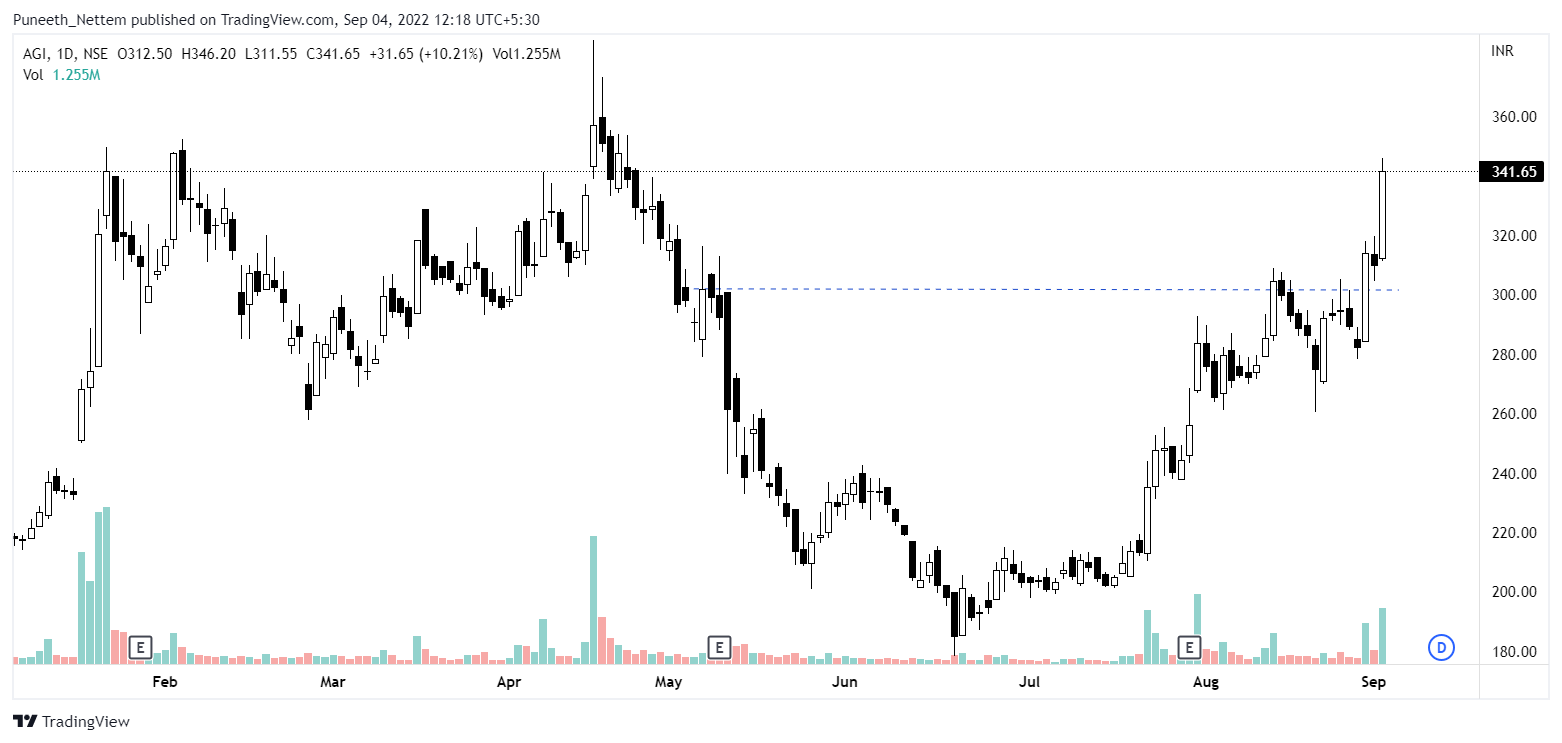
AGI
Tata chem
Welcorp
Talbros engineering.
Hopefully, it was a productive and helpful read!
Happy ![]() day
day
So you buy some and looking at the charts, you are increasing your position? Or is it technofunda? Or investing purely on charts?
Such many charts.
I should have bifurcated it.
Sandhar & Krsnaa are pure fundas.
Rest are pure charts