
Today I am going to discuss about slightly different perspective which we as an investor usually don’t practice or shy away with.
This is on - Price Volume action and how it helps us to make better decisions around screening and as early warning indicator for our investing decisions - whether buy, add or sell.
First of all, the question arises in the mind of investor is that - if there is so much of fundamental information available out there in terms of books, research reports, conference calls, industry reports etc., then why do we need to do hard work to understand all this??
The answer to this will unfold slowly as we delve into this subject.
The Context
Now, let’s put our thinking hats ON and think that what happens on a normal day in the stock market? Of course - we all know that >> buying and selling of securities.
Further digging deeper, each transaction leaves it’s footprints and there are decisions from investor/trader/speculator that has caused that transaction. And for every transaction there are two things - quantity and price at which the transaction has happened.
This tells us that PRICE and VOLUME are two fundamental building blocks of all the transactions that happen on the stock market. And most importantly they leave footprint of transactions of all market participants and indirectly their behavior and decision points.
Interesting point is all the technical indicators are second order derivative of these to basic building blocks with certain mathematical formula applied around it, you name any of it - RSI, Moving Averages, ADX etc.
So, it gives tremendous advantage logically, if we are able to capture price-volume action first hand and are able to infer actions of market participants to an extent. It can work like very early warning indicator. Hence, we should never ignore price-volume action.
Application and Uses:
Obviously, the question comes to our mind is that how to capture these footprints, how to apply these and how to make best use of it.
Well, it depends upon our own creativity and depth of fundamental implications of various actions and we can back-calculate such parameters from price-volume action to our advantage.
Let me give few simple examples:
(a) We know that there are price-volume breakouts when there is some fundamental news about the company comes out and excites the market participants - say capex announcement, above expected results, any sort of approvals, new product announcement, tax sops for sector etc. Infact most of the times these things happen even before news is out
Simple way you can capture these mathematically is by putting screens like - Today price increase >4% price increase of avg last few days/weeks; Similarly for volume
(b) Say there are sector news which moves all the sector participants due to positive happenings in the sector.
You can capture these by building screens mapped by sector to see such price fluctuations.
What I have Done?
To share my journey, I have been blending technical analysis (including price volume action) and fundamental analysis for investing purpose - what I call TechnoFunda Investing
These are steps which I use, and you can feel free to modify as it suites your style of investing.
- First level early warning indicator using price-volume action
- Second level technical analysis indicator based filter
- Third level fundamental screening to filter further
- Fundamental study and research
- Position sizing based on risk management
- Finally exit signals based partly on early warning indicator
- And final exit based on technical indicators and fundamental news
How I have built my screen?
I have built my own screen to capture price action and below are some pointers on process flow. Again, rather than using any tool, I wanted my own fundamental thesis to be back calculated using mathematical formula on price-volume.
Steps:
- Have time series data of price, volume, no. of trades using bhav copy (available on BSE, NSE) for FREE
- Averaging price-volume data based on time periods I want to compare (say weekly/monthly averages)
- Mapping sectors/sub-sectors and 52 week high data
- Applying customized screens for final screening
I have different screens to calculate what I want to finally see on charts (just converted into math):
- Breakouts from big consolidation range
- Breakouts with new highs
- Volume shakeouts
- Sectoral trends etc.
I then track it based on time series to see patterns and thereby it also helps to find long term trends.
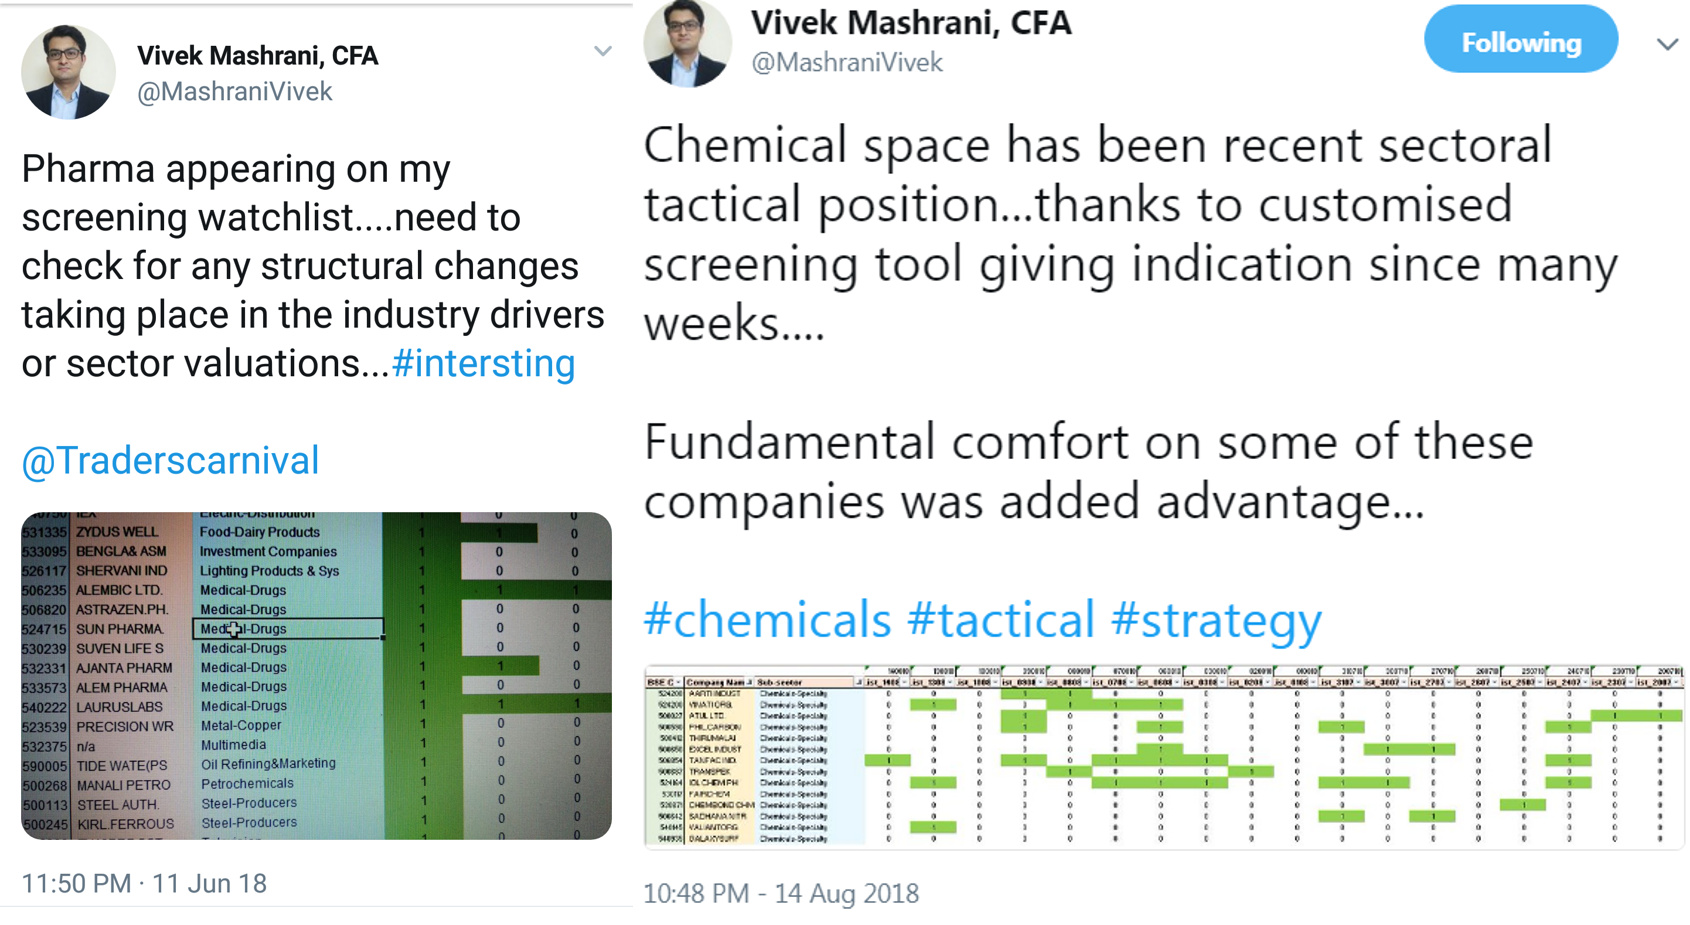
Below is a small example of sector level final confirmation screen which I posted few years back on my twitter (again to show how powerful these are):
Happy to answer if you have any questions.
Disclaimer:
All the examples shared above are for knowledge sharing purpose only. Please consult your advisor before taking any investment decisions on examples or these strategies. These require hard work and indepth understanding of the approach.
