I tried calculating dividend per share from cash flow of SPVs published in their report. Next 10 year yield without dipping into reserves is on average 5.62% (SPV giving 90% CF) - 7.02% (SPV giving 100% CF).
Where as 10 year bond yield is around 7.2%, but we can expect some acquisition to happen in next 10 years.
Let me know if I am making any mistake.
Thank you for sharing with us.
Your analysis is superb wrt to the dividend. However , considering the long span of 10 years and the recent concall , Following are my few points to ponder:
I believe the management has spoken during the concall , that they are not looking for further acquisitions apart from the current , wherein they will acquire till 100% of all current assets.
Mangement has clarified that dividend per share per year will gradually fall.
IMO , with no futuristic growth plan and lower divided per share , manegement need to express clearly their growth plan for next 5 years.
Do correct me if i have a wrong understanding of the company.
I think , holding just for dividend is a waste of capital .
Disc : Sold , due to lack of growth vision. Although earned good dividend from listing.
Hi. Thanks for sharing this detailed analysis. I see that you have used H1FY22 valuation report for this, I think the FY22-23 one would provide a better estimate as the NAV declined according to this report as a result of the increase in WACC.
Hi all, I’ve just done an updated valuation on Powergrid, and it seems to be a compelling long term investment at current prices.
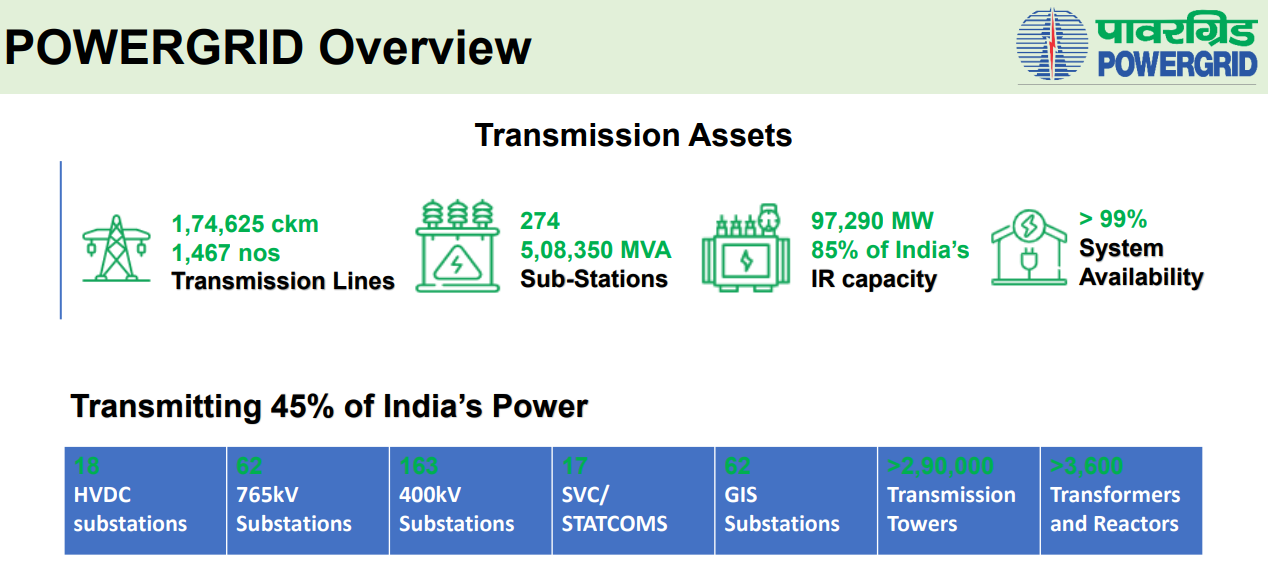
Powergrid (NSE: POWERGRID) owns and operates 45% of India’s electricity transmission network. It meets all the criteria for a good long term investment:
Moat : the dominant player in transmission. Has 20~30 year contracts with assured ROEs. Is the government’s preferred vendor for large scale or complex transmission projects
Long growth runway : increasing Indian power consumption and massive investments in new renewable power generation capacity
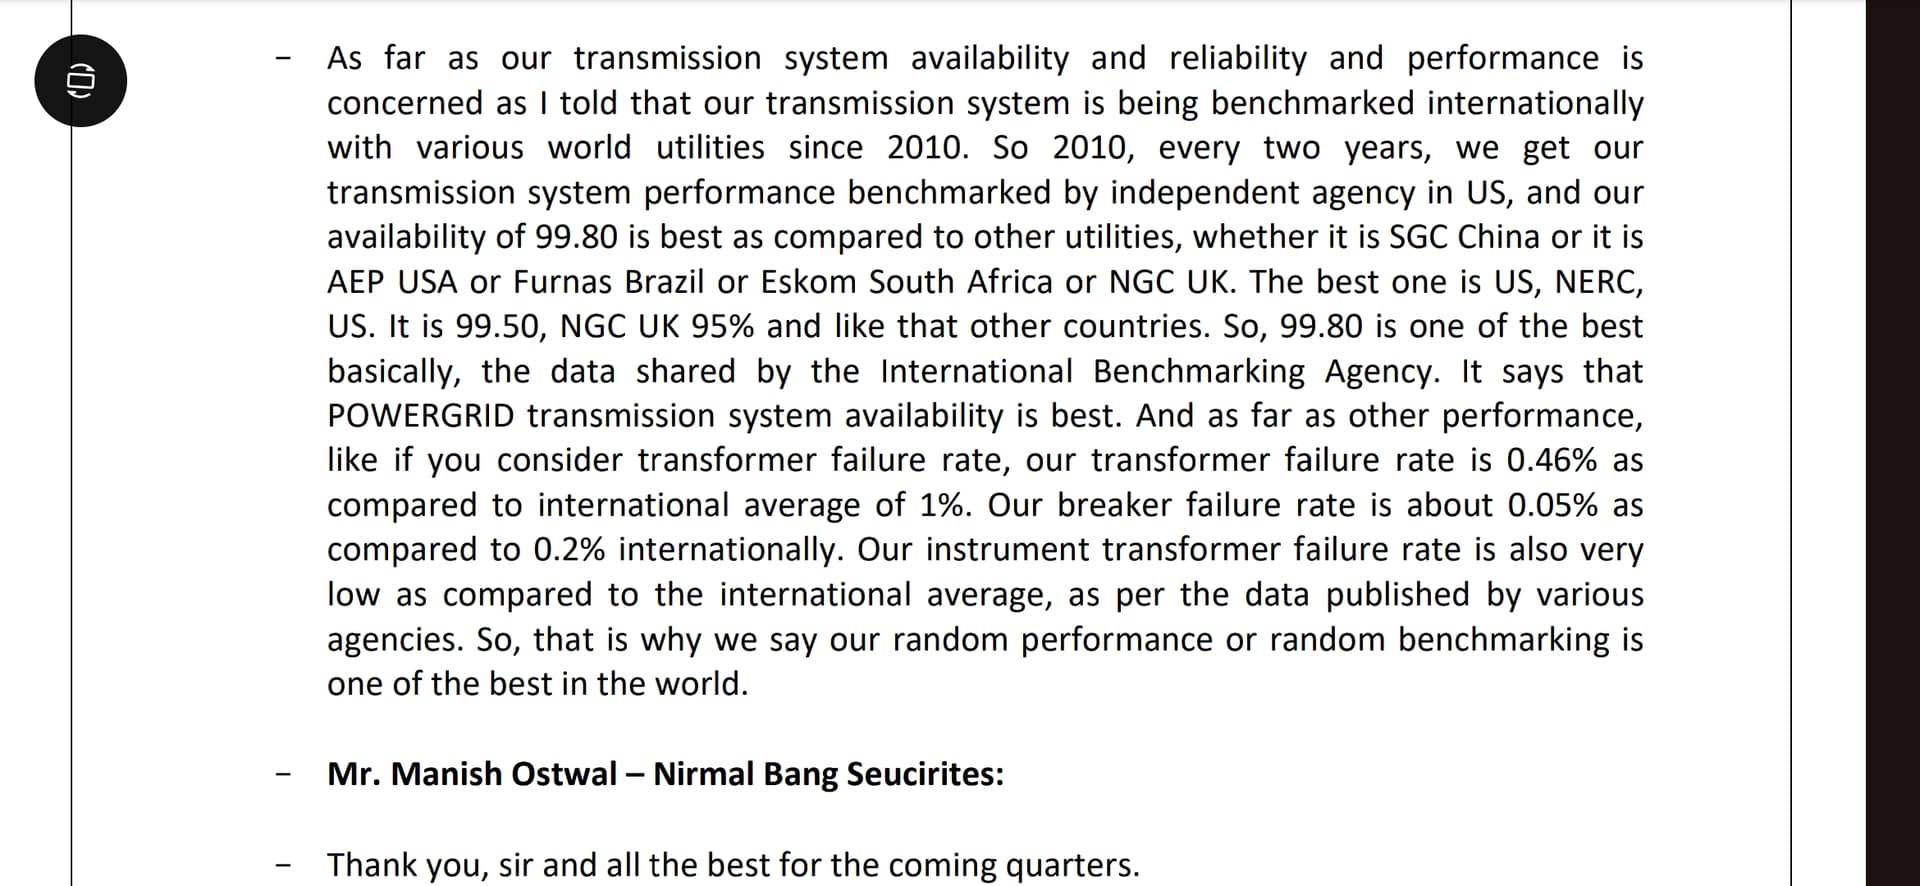
Management execution : consistently exceeded regulatory benchmarks with 99%+ transmission system availability and demonstrated ability to execute large scale projects over the last decade
Attractive valuation : limited downside possibility at current prices, with attractive returns on the upside. Risks to the growth trajectory: regulatory regime and tariff changes, competition by private players and fraud / corruption.
Even though its doing 45% of the total power transmission in India, and with 85% of inter-regional capacity - why is the “Tariff based competitive bidding” still less than 10% of its revenue?
I understand profitability might be lower in this revenue model but would it not also indicate that its able to beat competition and gain market share. Correct me if wrong, but this is the only way i see it can break from the dependance on the CERC tariff regulations every 5 years…
Hi Mayank, thanks for the feedback! The main reason that RTM is a large part of revenue is that TBCB was introduced only in 2011, while many of the current transmission projects run by Powergrid were commissioned earlier. Also , even now, the government uses RTM route for many large or sensitive projects and also when they was to speed up the commissioning.
From the annual report, they state 7k ckm of transmission lines and 30k MVA transformers are the aggregate TBCB assets. Overall transmission lines are 174k ckm and transformers are 500k MVA. So, 94%~96% of assets are under RTM at the moment.
The TBCB route would have reduced dependency on CERC tariffs, but faces different kinds of risks, such as very high maintenance or cost inflation. In the RTM model, it is “cost-plus”, so this risk is not material. Powergrid is pursuing both types of projects. The company’s MD mentioned during the last concall that Powergrid is targeting to win 50% or more of all TBCB projects until 2032. However, he also mentioned stiff private competition, with 5~8 other bidders competing for the contracts.
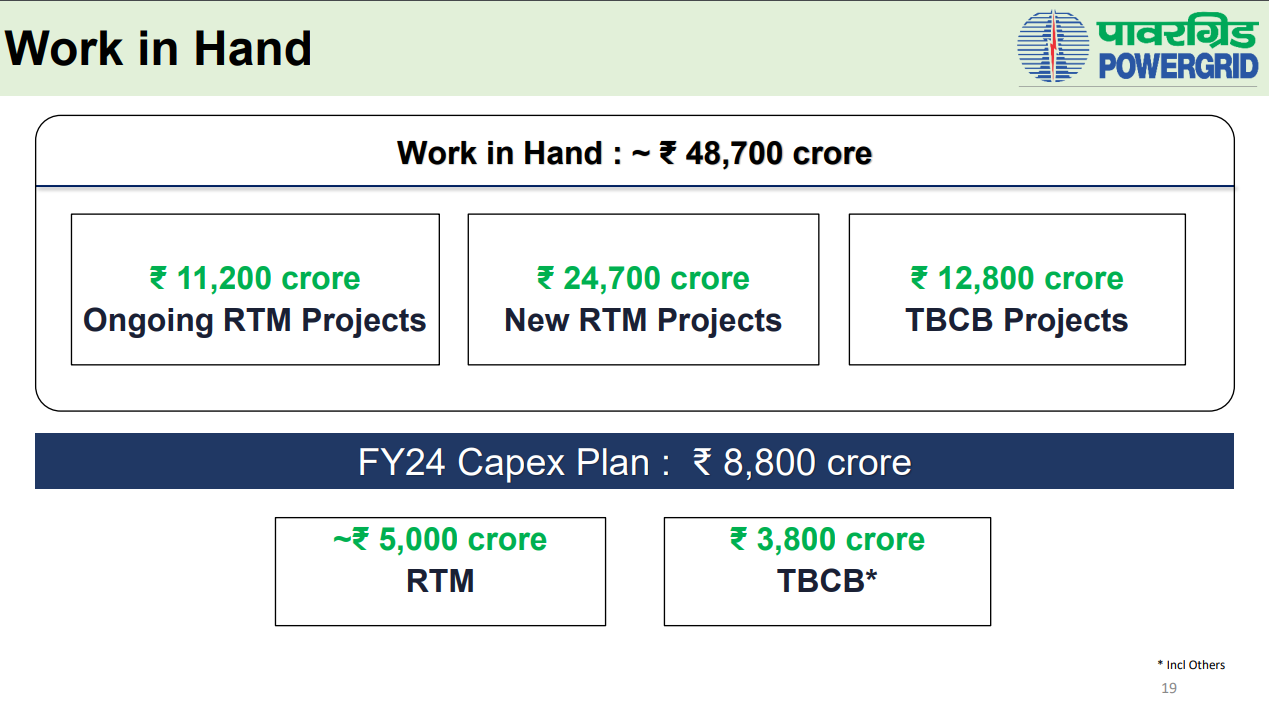
Going forward, TBCB share would probably increase, but not sure by how much. In the current “work-in-hand” projects, 74% of them are RTM and 26% are TBCB.
Power Grid has secured a significant contract to build and operate an inter-state transmission line to evacuate power from the Bhadla III Solar Park in Rajasthan. This project is part of the larger Rajasthan Renewable Energy Zone Phase III initiative.
Power grid is trading at 20 PE for 6% revenue growth and 8% PAT growth for past 5 yrs. The15 year median PE is 15. so 12% return (EPS growth of 9% + Dividend yield of 3%) going forward is best case scenario for the next 5 yr since PE cannot expand further. On the other hand, if PE can contract to 15, returns can be as low as 8%.
PGInvit has got the issue of “No action”. In spite of this issue, the past 1yr price correction leads to high probability of getting 10% return for next 5 yrs and if rate reduces by 2% in next 2-3 yrs, then price appreciation of 20% is possible which means a return of 14% in best case.
(I dont consider asset addition since it looks like a jackpot right now.)
So my opinion is that at this point in time, it appears PGInvit may be better than Power grid for next 5 yr.
My views about power grid investments - this provides a great cashflow as dividends to investors pocket and appreciation in price in long term. I’m not accumulating now at this valuation, my buy avg was around 150.
Flat Profit Growth: Earnings stagnated with PAT at Rs37.9 billion in 2QFY25, reflecting weak core performance despite support from higher other income and telecom revenues.
Core Revenue Underperformance: Core transmission revenue grew by only 3% YoY, hindered by weak asset capitalization over the last year.
JV Losses and Weak Incentives: Increased JV losses (Rs1 billion, largely from EESL) and declining incentive income (-50% YoY) indicate structural profitability challenges.
Capitalization Weakness Despite Encouraging Capex
Underwhelming Capitalization: 2QFY25 capitalization was weak at Rs16.8 billion (-29% YoY), lagging significantly behind the FY2025 guidance of Rs180 billion.
Mismatch Between Capex and Capitalization: Although capex spending was strong (Rs54 billion in 2QFY25, Rs100 billion in 1HFY25), it is not translating effectively into earnings growth or asset utilization.
Overdependence on Future Project Wins
Aggressive Capex Guidance Raises Concerns: Management’s elevated capex guidance of Rs250-300 billion in FY2026E and Rs350-400 billion in FY2027E could strain financials if execution and capitalization remain weak.
Reliance on TBCB Projects: Significant dependence on tariff-based competitive bidding (TBCB) projects (Rs36.7 billion contribution in 2QFY25) makes earnings more uncertain due to competitive pressures and regulatory risks.
Rich Valuations for Limited Growth Prospects
High Valuations: Current valuation metrics of 18.6X P/E (as on 20.11.2024) and 3.18X P/B appear stretched, especially given the modest 8.7% earnings CAGR projected over the next three years.
Low Dividend Yield Relative to Risk: A dividend yield of 3.8% in FY2025E does not adequately compensate for the single-digit growth and execution risks.
Persistent Operational Challenges
Foreign Exchange Exposure: Higher other expenses, likely from currency fluctuations, add volatility to earnings.
Lackluster Return Metrics: A modest growth in the gross block (2% YoY) combined with underwhelming capitalization reduces the attractiveness of return on assets.
In conclusion, while Power Grid has demonstrated strong project wins and future capex plans, the disappointing earnings performance, weak capitalization, and rich valuations suggest limited upside potential.