Yes seems right according to cmp.
Though, wouldn’t that calculation occur at the price on the penultimate day of bonus shares credit? Hypothetically, if bonus shares will be credited tomorrow then whatever price eod today will be used for the calculation, correct?
Analyst Webinar Update:
-
Indicated that they dont intend to keep significant cash in hand & any excess cash generation (over & above capex requirement) will be paid out (So ₹18-20 looks like very likely, infact could be higher as PGCIL requires ₹6-7/sh for Equity part of Capex, which leaves ₹23-24)
-
Over next 12-18 months, ₹5000 crore additional TBCB assets likely to be transferred to Invit, apart from starting the transfer of remaining 26% of already transferred assets
-
FY22 capitalization of 17000cr (which is a growth of 9-10% on current total base)
-
Capitalization may come down going forward to 10000-15000cr range (equal to the capex they r incurring currently). Opportunities from various solar parks ahead. EV charging, Data Center etc very nascent
3 Likes
Yes Correct. Whatever is the closing price on T-1 of ex date, will get adjusted to 3/4
1 Like
- Effective dividend is 4/sh (not 3) as its on expanded number of shares (after bonus)
1 Like
I am sharing some of my observations about financials of Powergrid
If we zoom out and look at the last 10-years, sales have grown at 16.84% and profits have grown at 16.13%. Sales growth has mainly come from transmission charges which has compounded at higher rates (17.16%) whereas consultancy (services) has only grown at 3.8% and telecom at 14.22%.
There has not been a single year where sales or profits have not grown.
| P&L | FY11 | FY12 | FY13 | FY14 | FY15 | FY16 | FY17 | FY18 | FY19 | FY20 | FY21 | FY11-21 Growth |
|---|---|---|---|---|---|---|---|---|---|---|---|---|
| Revenues | 8’612.00 | 10’785.00 | 13’328.00 | 16’146.00 | 18’233.00 | 21’243.00 | 26’581.00 | 30’431.00 | 35’661.00 | 38’671.00 | 40’824.00 | 16.84% |
| Transmission charges | 7’903.00 | 9’544.00 | 12’211.00 | 14’327.00 | 16’999.00 | 19’808.00 | 24’630.00 | 28’844.00 | 33’894.00 | 36’532.00 | 38’499.00 | 17.16% |
| Consultancy - services | 299.00 | 290.00 | 228.00 | 333.00 | 385.00 | 466.00 | 582.00 | 491.00 | 502.00 | 514.00 | 434.00 | 3.80% |
| Telecom | 187.00 | 201.00 | 231.00 | 276.00 | 275.00 | 392.00 | 504.00 | 607.00 | 663.00 | 698.00 | 707.00 | 14.22% |
| Sucharge income | 203.00 | 309.00 | 744.00 | |||||||||
| Incentive income | 217.00 | 427.00 | 481.00 | |||||||||
| PAT | 2’697.00 | 3’255.00 | 4’235.00 | 4’497.00 | 5’046.00 | 5’948.00 | 7’520.00 | 8’198.00 | 10’034.00 | 11’059.00 | 12’036.00 | 16.13% |
Another way to understand growth is to see how transmission assets (length of transmission lines and capacity of substations) have grown. Transmission lines have grown at 7.4% and sub-station capacity has grown at 16.76%. So sales growth of 16.8% has come from growth in assets + realization (or pricing of power transmitted using these assets). Availability has always ben higher than 98.5% leading to incentive income.
| Operational metrics | FY11 | FY12 | FY13 | FY14 | FY15 | FY16 | FY17 | FY18 | FY19 | FY20 | FY21 | |
|---|---|---|---|---|---|---|---|---|---|---|---|---|
| Transmission lines (ckm) | 82’355.00 | 93’000.00 | 100’107.00 | 107’574.00 | 116’625.00 | 129’600.00 | 139’709.00 | 148’327.00 | 158’298.00 | 163’222.00 | 168’256.00 | 7.41% |
| Sub-stations (MVA) | 93’050.00 | 125’000.00 | 164’763.00 | 206’338.00 | 234’709.00 | 255’000.00 | 292’543.00 | 332’163.00 | 371’912.00 | 409’898.00 | 438’108.00 | 16.76% |
| IR capacity (MW) | 89’090.00 | 90’090.00 | ||||||||||
| Availability | 99.80% | 99.94% | 99.90% | 99.92% | 99.87% | 99.72% | 99.79% | 99.81% | 99.71% | 99.82% | 99.76% | |
| Reliability (tripping per line) | 1.27 | 0.59 | 0.58 | 0.56 | 0.53 | 0.66 | 0.68 | 0.6 | 0.46 | 0.39 | 0.36 |
How has the quality of balance sheet evolved?
Equity reserves and debt have grown at 12.6% and 13.21%. Cost of borrowing has come down from 10% levels to 6% in FY21. Incrementally, capital has been deployed in lower return TBCB assets which are now being transferred to the Powergrid Invit, hence making Powergrid’s ROE closer to regulated ROEs of 15.5%. ROE over the decade has largely varied between 13-17%. Here are the detailed numbers
| BALANCE SHEET | FY11 | FY12 | FY13 | FY14 | FY15 | FY16 | FY17 | FY18 | FY19 | FY20 | FY21 | FY11-21 Growth |
|---|---|---|---|---|---|---|---|---|---|---|---|---|
| Receivables | 4’728.00 | 5’041.00 | 3’676.00 | |||||||||
| Equity | 21’351.00 | 23’487.00 | 26’213.00 | 34’413.00 | 38’037.00 | 43’811.00 | 49’807.00 | 54’426.00 | 59’088.00 | 64’695.00 | 69’936.00 | 12.60% |
| Debt | 40’883.00 | 53’402.00 | 66’188.00 | 80’470.00 | 93’845.00 | 106’255.00 | 117’198.00 | 130’503.00 | 142’076.00 | 145’270.00 | 141’410.00 | 13.21% |
| Equity in TBCB | 4’016.00 | 2’736.00 | ||||||||||
| Cost of borrowing | 7.22% | 6.66% | 6.04% | |||||||||
| ROE | 12.63% | 13.86% | 16.15% | 13.07% | 13.09% | 13.58% | 15.10% | 15.06% | 16.98% | 17.09% | 17.21% |
Capex vs capitalization
A key monitorable for Powergrid is how much of capital is being infused into building new assets (capex) vs how much of these assets are being capitalized and generating cashflows. In the earlier part of the decade, Powergrid was putting up new capacity which are now getting commercialized. So the capitalization to capex ratio is improving from 60-80% levels in FY10-15 to 120%+ levels recently. This means higher dividends to shareholders as has been seen in the past few years. CY17/CY18/CY19/CY20 dividends have increased sequentially Rs. 4.35 / 5.25 / 8.33 / 15.
| CAPEX vs Capitalization | FY11 | FY12 | FY13 | FY14 | FY15 | FY16 | FY17 | FY18 | FY19 | FY20 | FY21 |
|---|---|---|---|---|---|---|---|---|---|---|---|
| CAPEX | 12’005.00 | 17’814.00 | 20’037.00 | 23’158.00 | 22’456.00 | 22’584.00 | 24’429.00 | 25’791.00 | 25’807.00 | 15’313.00 | 11’284.00 |
| Capitalization | 7’313.00 | 14’100.00 | 17’213.00 | 15’904.00 | 21’760.00 | 31’788.00 | 31’000.00 | 27’928.00 | 27’325.00 | 18’234.00 | 21’467.00 |
| Capitalization/CAPEX ratio | 60.92% | 79.15% | 85.91% | 68.68% | 96.90% | 140.75% | 126.90% | 108.29% | 105.88% | 119.08% | 190.24% |
Do discoms pay?
This has been a large monitorable for a long time, logic being discoms are under stress and will not pay powergrid which can destroy powergrid’s balance sheet. This has not been true historically with powergrid debt/equity ratio largely being in the 2-2.5x range over the last decade. Here is how billings vs realizations have panned out in the last decade. There are few good years, few bad years and >99.5% of the billed money has been realized by powergrid leading to very low write-offs.
| Billing vs realization | FY11 | FY12 | FY13 | FY14 | FY15 | FY16 | FY17 | FY18 | FY19 | FY20 | FY21 | FY11-21 Growth |
|---|---|---|---|---|---|---|---|---|---|---|---|---|
| Billing | 7’367.00 | 11’379.00 | 11’839.00 | 14’556.00 | 16’409.00 | 19’178.00 | 25’709.00 | 27’227.00 | 36’881.00 | 34’603.00 | 16.73% | |
| Realization | 10’219.67 | 11’925.00 | 14’393.00 | 15’848.00 | 18’668.00 | 25’548.00 | 26’875.00 | 36’882.00 | 35’910.00 | |||
| %age realization | 89.81% | 100.73% | 98.88% | 96.58% | 97.34% | 99.37% | 98.71% | 100.00% | 103.78% |
Disclosure: Invested
18 Likes
Highlights from the management commentary
-
Powergrid expects capitalization in FY22 to be INR160-170b. Of this, INR90- 100b would be for RTM projects, with INR60-70b for TBCB. In FY22, overall capex would be INR75b.
-
As per Powergrid, INR103b of upcoming opportunity is present in interstate and intrastate works. In addition, transmission schemes are being planned in Gujarat and Rajasthan, with a total potential cost of INR270-300b. DPR for transmission works at Leh (10GW) has also been prepared.
-
The company does expect an upward trajectory in dividends, but will look at distributing payouts that are sustainable.
2 Likes
Excellent set of numbers from Powergrid once again.
YoY revenue grew by 6% and profit before tax and exceptional items by 9%. 3K Crore exceptional income on account of transfer of assets to Invit. Overall really encouraging set of numbers and hope the market start giving merit for the ability of the company to generate cash flow via asset monetization by floating Invit’s. This could be a rerating candidate.
See the results here.
AJ
Disclosure: Invested and added recently.
1 Like
PGCIL Results & Analyst Call Update
-
1QFY22 EPS was ₹8.72/sh. Assuming similar run rate & 10-12% growth, FY22 EPS could be around 23-24/sh, higher than my earlier estimate of ₹22.5 (adjusted for bonus). ROE of 22%
-
Management in the call indicated invit transfer target of ₹7500cr assets in FY23 (similar to FY22 listing of Invit), ₹15000cr each in FY24 & FY25. Given the likely recurring nature of Invit transfers & profits from sale to Invit, ₹2500-3000cr of minimum PAT from invit transfers very likely per year
-
Management in earlier call had highlighted they dont intend to keep much cash & therefore distribute excess to shareholders, over & above its Capex requirement. Equity Capex required for FY23/FY24 is ₹2000cr per year or ₹3/sh
Assuming some working capital etc, my sense is, of 23-24 EPS, they can easily pay ₹16-18 dividends. Dividend yield could be 9-10% @176 price (slightly higher than my earlier estimate of 8-9%)
- This is a regulated & stable business, with growth of 8-10%. A dividend yield of 9-10% in PGCIL is very very healthy
I expect reasonable rerating on the stock once these dividend numbers pan out
Disclosure
I am an investor in the stock, so may be biased
I am not SEBI registered
3 Likes
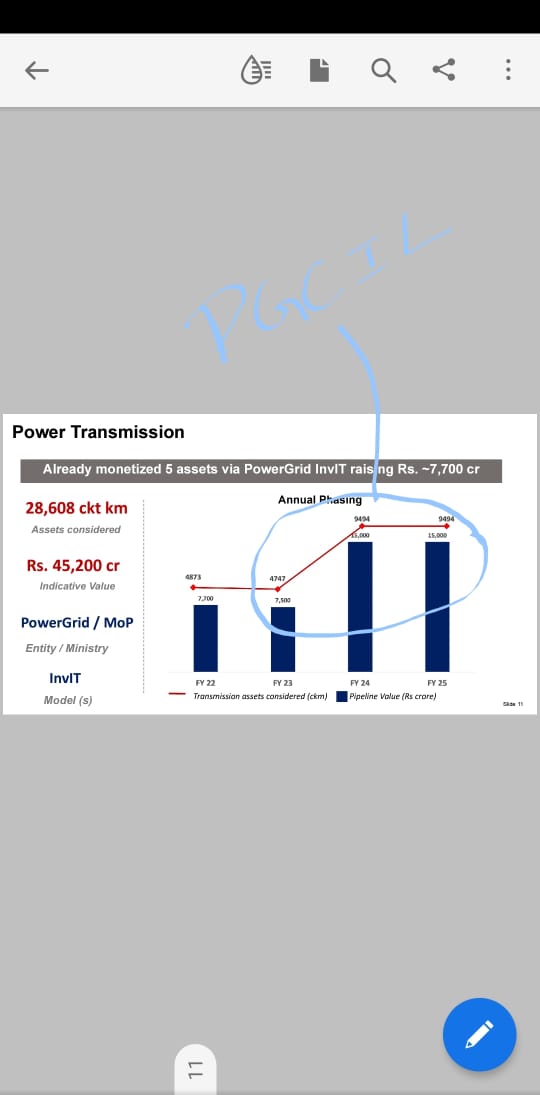
National Monetisation plan lists same targets for PGCIL, as highlighted by management in the call
This is a very big number, giving visibility of 4-5 years of Invit transfer profits being recurring and not one time
2 Likes
News Feed:
1 Like
Excellent set of numbers from Powergrid as expected:
Key observations below:
- Even after floating Invit, revenue has grown by a healthy 7.3% YoY.
- The finance cost and debt are on down trend while the cash balance has improved significantly.
- Notable increase in receivables YoY, which will remain a key monitorable going forward.
- EPS is up by 10% YoY and nearly doubled H1 to H1.
See the results announcement here.
AJ
Disclosure: Remain invested and views are biased.
2 Likes
Hi Harsh, don’t you think that they gave out higher dividends because of governments’ demand during the covid crisis as they did from a lot of other PSUs also, and not because they suddenly had an increase in their cash flows.
I have experience of only 1.5 years, so apologies beforehand if it is a stupid question.
This can be another revenue stream for Power Grid Corporation.
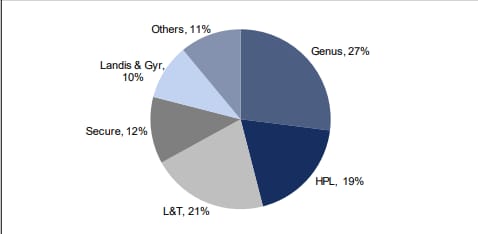
Currently, the largest player in the Industry is Genus which has had many corporate governance issues and is incomparable to the financial might of Powergrid.
In addition to this Genus has more market share with private DISCOMS (67%) as compared to PSU DISCOMS. Hence, Powergrid which has better and longer relationships with PSUs can capture their market share. Lastly, smart meter deployment in itself will help the core business of Powergrid as it drastically increases collection efficiency and decreases AT&C losses of DISCOMS.
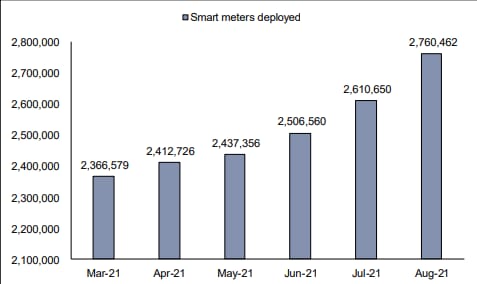
The pace at which smart meters are being deployed.
@harsh.beria93 views?
3 Likes
About higher dividend, this has much more to do with reduced capex intensity and higher capitalizations. I have summarized the same in a previous post.
| CAPEX vs Capitalization | FY11 | FY12 | FY13 | FY14 | FY15 | FY16 | FY17 | FY18 | FY19 | FY20 | FY21 |
|---|---|---|---|---|---|---|---|---|---|---|---|
| CAPEX | 12’005.00 | 17’814.00 | 20’037.00 | 23’158.00 | 22’456.00 | 22’584.00 | 24’429.00 | 25’791.00 | 25’807.00 | 15’313.00 | 11’284.00 |
| Capitalization | 7’313.00 | 14’100.00 | 17’213.00 | 15’904.00 | 21’760.00 | 31’788.00 | 31’000.00 | 27’928.00 | 27’325.00 | 18’234.00 | 21’467.00 |
| Capitalization/CAPEX ratio | 60.92% | 79.15% | 85.91% | 68.68% | 96.90% | 140.75% | 126.90% | 108.29% | 105.88% | 119.08% | 190.24% |
Additionally, monetization via Invit route has led to higher cash generation which has also resulted in higher dividend payouts.
About smart meters market, I do not know if it can absorb the kind of cashflows that is generated by Powergrid. In one of the previous posts, I did a breakup of revenues earned from other business ventures and it shows that none of the other businesses have scaled up to transmission revenues (<3% of overall revenues). So I will be careful of extrapolating their other business ventures.
| P&L | FY11 | FY12 | FY13 | FY14 | FY15 | FY16 | FY17 | FY18 | FY19 | FY20 | FY21 | FY11-21 Growth |
|---|---|---|---|---|---|---|---|---|---|---|---|---|
| Revenues | 8’612.00 | 10’785.00 | 13’328.00 | 16’146.00 | 18’233.00 | 21’243.00 | 26’581.00 | 30’431.00 | 35’661.00 | 38’671.00 | 40’824.00 | 16.84% |
| Transmission charges | 7’903.00 | 9’544.00 | 12’211.00 | 14’327.00 | 16’999.00 | 19’808.00 | 24’630.00 | 28’844.00 | 33’894.00 | 36’532.00 | 38’499.00 | 17.16% |
| Consultancy - services | 299.00 | 290.00 | 228.00 | 333.00 | 385.00 | 466.00 | 582.00 | 491.00 | 502.00 | 514.00 | 434.00 | 3.80% |
| Telecom | 187.00 | 201.00 | 231.00 | 276.00 | 275.00 | 392.00 | 504.00 | 607.00 | 663.00 | 698.00 | 707.00 | 14.22% |
| Sucharge income | 203.00 | 309.00 | 744.00 | |||||||||
| Incentive income | 217.00 | 427.00 | 481.00 | |||||||||
| PAT | 2’697.00 | 3’255.00 | 4’235.00 | 4’497.00 | 5’046.00 | 5’948.00 | 7’520.00 | 8’198.00 | 10’034.00 | 11’059.00 | 12’036.00 | 16.13% |
Disclosure: Invested (position size here)
4 Likes
More than the revenue that it can potentially earn from the smart meter business do you have any idea to what extent can smart meters help them as it drastically improves the performance of DISCOMS. Won’t this lead to lesser receivables and lower receivable days. Additionally, I have read many articles which say that DISCOMS don’t supply electricity to many consumers 24/7 due to their constrained financial position. If smart meters come in then won’t this lead to increase in supply by DISCOMS and consequently more power being transmitted through powergrid?
not exactly. It allows them to cut their losses as power theft control is a bit easier to manage. Think of one use of smart meters as prepaid SIM. Some last mile customers dont pay on time or steal. The idea is to install smart meters which are recharged by customers to have power in their house. Once the unit power consumed value exceeds the meter top up value, the meter cuts power to the house.
This is in theory to cut power theft one of the reasons for smart meters deployment.
Combine with SCADA power distribution control software, you can precisely know where power is being stolen.
4 Likes
Got this. Thanks.
On the other hand, won’t the customers who pay on time and don’t receive 24/7 electricity start getting it full time and thus leading to increased electricity supply. I live in a small city in Bihar and we receive electricity for about 18 hours a day. Thus, this could theoretically increase the electricity supply to towns like mine by about 33%. I also have a house at my farm and there the case is even worse.
According to this, the AT&C losses were about 21%. So, in a very simplistic sense, this means that more than 80% of the electricity bills are being paid. so, 80% will get more electricity?
I understand that it is a very simplistic explanation, but I just want clarity in regard to this.
Incorrect. you only get electricity if you pay for it. If they’re able to stem their losses and bring it below 8%, then availability increases; there is add on effect of providing longer hours of eleccy but just because 10MW more power is now available, you’re not suddenly increasing your consumption, right?
In one sense, since houses are underpowered in their needs(a typical household would need a little over 200 units/month to be comfortably useful; worldwide developed countries is 4000+/year; we are at less than 1200/year per capita; this is from CESC/Coal India conf call, I think), we would see increased consumption and hence more transmission via PG initially.
18hrs to 24 hrs availability would see increase in consumption not a geometric increase but decent enough
3 Likes
Do anybody have any info about why Electricity Amendment Bill 2021 is not going to be introduced in this winter session of parliament? I could not find the same under Bills to be tabulated.
3 Likes