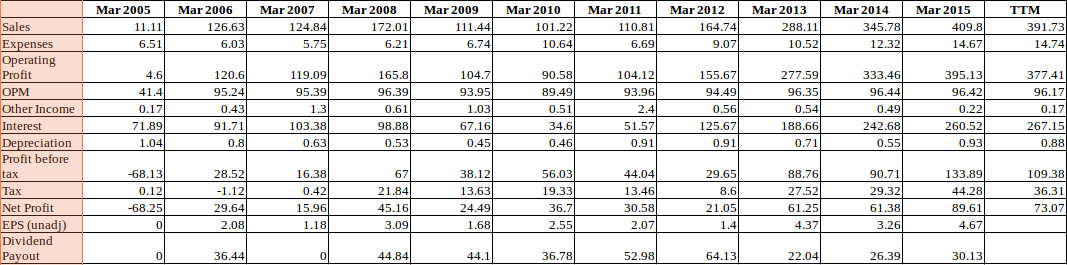
With expected reduction in interest PNB Gilt may report very good numbers. As on March 31 2019, the company has investment of around Rs 8,817 Cr. Of Rs 8817 Cr investment book, nearly 6,588 Cr is G Sec (Central/State), Rs 1,580 Corporate Debt, Rs 648 Cr Certificate of Deposit and Rs 3 Cr of equity holding. This is compared to Rs 180 Cr equity as on March 31 2019.
Hence, the company is almot 50 times leveraged (Investment of Rs 8816 Cr/ Equity Rs 180 Cr) leverage. With decline G Sec from 7.37% as on March 2019 end to 6.88% as on June 2019 end. Depending on book and duration of holding, the company may report major spurt in profit during June 2019 quarter.
Further, in the scenario when interest rate are likely to remain low (and general economy not performing below average growth rate), this investment can work as hedge in portfilio in my opinion.
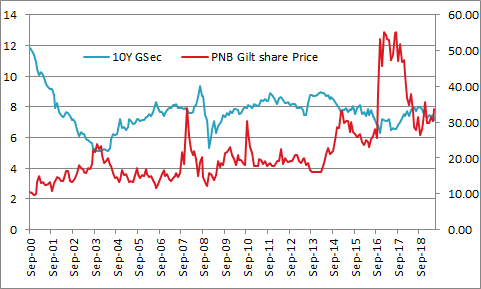
Last time, during June 2017 quarter, the 10 year G Sec yield declined by 47 basis point from 7.06% end of March 2017 to 6.59% end of June 2017. The company net proft, almost doubled from Rs 55 Cr in March 2017 quarter to Rs 112 Cr in June 2017. Please note that despite this jump in profit, share price of company declined from Rs 53 per share to Rs 49 per share. Hence, while the net profit and financial performance may increase due to decline in interest, since same is not considered sustainable market may not show immediate improvement in price.
Find enclosed Monthly, 10 Year G Sec rate and PNB Gilt monthly share price since 2000.
| Year |
Month |
Gsec 10 Y |
PNB Gilt share Price |
Q Gsec Change |
| 2000-01 |
Sep-00 |
11.81 |
10.50 |
0.70 |
| 2000-01 |
Oct-00 |
11.61 |
10.16 |
|
| 2000-01 |
Nov-00 |
11.40 |
9.75 |
|
| 2000-01 |
Dec-00 |
10.94 |
9.94 |
-0.87 |
| 2000-01 |
Jan-01 |
10.48 |
13.31 |
|
| 2000-01 |
Feb-01 |
10.04 |
15.08 |
|
| 2000-01 |
Mar-01 |
10.27 |
12.94 |
-0.66 |
| 2001-02 |
Apr-01 |
10.08 |
13.13 |
|
| 2001-02 |
May-01 |
9.71 |
12.41 |
|
| 2001-02 |
Jun-01 |
9.46 |
12.34 |
-0.82 |
| 2001-02 |
Jul-01 |
9.26 |
12.68 |
|
| 2001-02 |
Aug-01 |
9.14 |
13.13 |
|
| 2001-02 |
Sep-01 |
9.15 |
10.80 |
-0.31 |
| 2001-02 |
Oct-01 |
8.79 |
12.86 |
|
| 2001-02 |
Nov-01 |
7.92 |
13.54 |
|
| 2001-02 |
Dec-01 |
8.27 |
14.66 |
-0.88 |
| 2001-02 |
Jan-02 |
7.65 |
14.40 |
|
| 2001-02 |
Feb-02 |
7.47 |
13.50 |
|
| 2001-02 |
Mar-02 |
7.34 |
13.43 |
-0.92 |
| 2002-03 |
Apr-02 |
7.40 |
14.25 |
|
| 2002-03 |
May-02 |
7.65 |
16.28 |
|
| 2002-03 |
Jun-02 |
7.57 |
16.31 |
0.23 |
| 2002-03 |
Jul-02 |
7.37 |
13.50 |
|
| 2002-03 |
Aug-02 |
7.16 |
13.31 |
|
| 2002-03 |
Sep-02 |
7.20 |
13.65 |
-0.37 |
| 2002-03 |
Oct-02 |
6.98 |
14.40 |
|
| 2002-03 |
Nov-02 |
6.46 |
15.90 |
|
| 2002-03 |
Dec-02 |
6.08 |
18.11 |
-1.12 |
| 2002-03 |
Jan-03 |
6.34 |
17.10 |
|
| 2002-03 |
Feb-03 |
6.23 |
17.03 |
|
| 2002-03 |
Mar-03 |
6.19 |
16.01 |
0.11 |
| 2003-04 |
Apr-03 |
5.91 |
15.75 |
|
| 2003-04 |
May-03 |
5.85 |
17.06 |
|
| 2003-04 |
Jun-03 |
5.73 |
16.88 |
-0.46 |
| 2003-04 |
Jul-03 |
5.62 |
18.26 |
|
| 2003-04 |
Aug-03 |
5.26 |
22.20 |
|
| 2003-04 |
Sep-03 |
5.26 |
21.64 |
-0.47 |
| 2003-04 |
Oct-03 |
5.11 |
24.00 |
|
| 2003-04 |
Nov-03 |
5.14 |
22.43 |
|
| 2003-04 |
Dec-03 |
5.14 |
23.21 |
-0.12 |
| 2003-04 |
Jan-04 |
5.19 |
20.78 |
|
| 2003-04 |
Feb-04 |
5.27 |
18.49 |
|
| 2003-04 |
Mar-04 |
5.15 |
19.20 |
0.02 |
| 2004-05 |
Apr-04 |
5.15 |
20.06 |
|
| 2004-05 |
May-04 |
5.30 |
17.89 |
|
| 2004-05 |
Jun-04 |
5.87 |
17.70 |
0.71 |
| 2004-05 |
Jul-04 |
6.19 |
15.83 |
|
| 2004-05 |
Aug-04 |
6.15 |
14.40 |
|
| 2004-05 |
Sep-04 |
6.24 |
14.55 |
0.38 |
| 2004-05 |
Oct-04 |
6.87 |
13.20 |
|
| 2004-05 |
Nov-04 |
7.21 |
13.80 |
|
| 2004-05 |
Dec-04 |
6.59 |
16.73 |
0.35 |
| 2004-05 |
Jan-05 |
6.71 |
15.11 |
|
| 2004-05 |
Feb-05 |
6.49 |
15.41 |
|
| 2004-05 |
Mar-05 |
6.69 |
14.14 |
0.09 |
| 2005-06 |
Apr-05 |
7.19 |
13.20 |
|
| 2005-06 |
May-05 |
7.06 |
13.43 |
|
| 2005-06 |
Jun-05 |
6.88 |
13.28 |
0.20 |
| 2005-06 |
Jul-05 |
6.95 |
15.11 |
|
| 2005-06 |
Aug-05 |
7.19 |
17.18 |
|
| 2005-06 |
Sep-05 |
7.21 |
15.49 |
0.32 |
| 2005-06 |
Oct-05 |
7.08 |
14.40 |
|
| 2005-06 |
Nov-05 |
7.11 |
15.19 |
|
| 2005-06 |
Dec-05 |
7.12 |
14.89 |
-0.09 |
| 2005-06 |
Jan-06 |
7.31 |
16.84 |
|
| 2005-06 |
Feb-06 |
7.34 |
15.53 |
|
| 2005-06 |
Mar-06 |
7.53 |
14.66 |
0.41 |
| 2006-07 |
Apr-06 |
7.39 |
14.93 |
|
| 2006-07 |
May-06 |
7.68 |
13.91 |
|
| 2006-07 |
Jun-06 |
8.13 |
12.75 |
0.60 |
| 2006-07 |
Jul-06 |
8.28 |
11.66 |
|
| 2006-07 |
Aug-06 |
7.93 |
12.75 |
|
| 2006-07 |
Sep-06 |
7.68 |
14.18 |
-0.45 |
| 2006-07 |
Oct-06 |
7.64 |
15.41 |
|
| 2006-07 |
Nov-06 |
7.41 |
16.58 |
|
| 2006-07 |
Dec-06 |
7.61 |
15.00 |
-0.07 |
| 2006-07 |
Jan-07 |
7.77 |
15.60 |
|
| 2006-07 |
Feb-07 |
7.95 |
14.14 |
|
| 2006-07 |
Mar-07 |
7.94 |
13.61 |
0.33 |
| 2007-08 |
Apr-07 |
8.13 |
14.40 |
|
| 2007-08 |
May-07 |
8.12 |
14.89 |
|
| 2007-08 |
Jun-07 |
8.16 |
15.64 |
0.22 |
| 2007-08 |
Jul-07 |
7.91 |
14.63 |
|
| 2007-08 |
Aug-07 |
7.92 |
15.83 |
|
| 2007-08 |
Sep-07 |
7.92 |
21.75 |
-0.24 |
| 2007-08 |
Oct-07 |
7.87 |
18.41 |
|
| 2007-08 |
Nov-07 |
7.92 |
23.85 |
|
| 2007-08 |
Dec-07 |
7.81 |
33.94 |
-0.11 |
| 2007-08 |
Jan-08 |
7.57 |
25.99 |
|
| 2007-08 |
Feb-08 |
7.63 |
22.31 |
|
| 2007-08 |
Mar-08 |
7.64 |
20.70 |
-0.17 |
| 2008-09 |
Apr-08 |
8.02 |
22.01 |
|
| 2008-09 |
May-08 |
8.11 |
19.73 |
|
| 2008-09 |
Jun-08 |
8.65 |
14.85 |
1.02 |
| 2008-09 |
Jul-08 |
9.35 |
18.90 |
|
| 2008-09 |
Aug-08 |
8.71 |
20.14 |
|
| 2008-09 |
Sep-08 |
8.72 |
14.70 |
0.07 |
| 2008-09 |
Oct-08 |
7.48 |
13.28 |
|
| 2008-09 |
Nov-08 |
7.12 |
12.08 |
|
| 2008-09 |
Dec-08 |
5.30 |
15.71 |
-3.42 |
| 2008-09 |
Jan-09 |
6.00 |
15.56 |
|
| 2008-09 |
Feb-09 |
6.57 |
14.93 |
|
| 2008-09 |
Mar-09 |
7.04 |
13.95 |
1.74 |
| 2009-10 |
Apr-09 |
6.29 |
15.15 |
|
| 2009-10 |
May-09 |
6.75 |
19.09 |
|
| 2009-10 |
Jun-09 |
6.95 |
17.48 |
-0.09 |
| 2009-10 |
Jul-09 |
6.99 |
18.71 |
|
| 2009-10 |
Aug-09 |
7.50 |
18.15 |
|
| 2009-10 |
Sep-09 |
7.34 |
21.45 |
0.38 |
| 2009-10 |
Oct-09 |
7.59 |
21.64 |
|
| 2009-10 |
Nov-09 |
7.46 |
22.50 |
|
| 2009-10 |
Dec-09 |
7.74 |
23.03 |
0.40 |
| 2009-10 |
Jan-10 |
7.58 |
20.93 |
|
| 2009-10 |
Feb-10 |
7.86 |
19.61 |
|
| 2009-10 |
Mar-10 |
7.83 |
17.96 |
0.09 |
| 2010-11 |
Apr-10 |
7.78 |
20.85 |
|
| 2010-11 |
May-10 |
7.52 |
19.54 |
|
| 2010-11 |
Jun-10 |
7.58 |
19.28 |
-0.25 |
| 2010-11 |
Jul-10 |
7.83 |
18.45 |
|
| 2010-11 |
Aug-10 |
7.99 |
18.00 |
|
| 2010-11 |
Sep-10 |
7.90 |
30.34 |
0.32 |
| 2010-11 |
Oct-10 |
8.12 |
26.85 |
|
| 2010-11 |
Nov-10 |
8.05 |
23.18 |
|
| 2010-11 |
Dec-10 |
7.95 |
21.45 |
0.06 |
| 2010-11 |
Jan-11 |
8.15 |
17.81 |
|
| 2010-11 |
Feb-11 |
8.10 |
17.63 |
|
| 2010-11 |
Mar-11 |
8.02 |
17.78 |
0.07 |
| 2011-12 |
Apr-11 |
8.13 |
19.65 |
|
| 2011-12 |
May-11 |
8.41 |
19.35 |
|
| 2011-12 |
Jun-11 |
8.35 |
18.38 |
0.33 |
| 2011-12 |
Jul-11 |
8.48 |
19.13 |
|
| 2011-12 |
Aug-11 |
8.35 |
17.70 |
|
| 2011-12 |
Sep-11 |
8.40 |
17.93 |
0.05 |
| 2011-12 |
Oct-11 |
8.88 |
18.49 |
|
| 2011-12 |
Nov-11 |
8.76 |
17.78 |
|
| 2011-12 |
Dec-11 |
8.55 |
17.78 |
0.15 |
| 2011-12 |
Jan-12 |
8.29 |
18.49 |
|
| 2011-12 |
Feb-12 |
8.20 |
19.09 |
|
| 2011-12 |
Mar-12 |
8.56 |
19.05 |
0.01 |
| 2012-13 |
Apr-12 |
8.65 |
22.54 |
|
| 2012-13 |
May-12 |
8.46 |
18.34 |
|
| 2012-13 |
Jun-12 |
8.23 |
19.99 |
-0.33 |
| 2012-13 |
Jul-12 |
8.26 |
19.50 |
|
| 2012-13 |
Aug-12 |
8.31 |
18.79 |
|
| 2012-13 |
Sep-12 |
8.14 |
19.16 |
-0.09 |
| 2012-13 |
Oct-12 |
8.20 |
19.20 |
|
| 2012-13 |
Nov-12 |
8.20 |
20.21 |
|
| 2012-13 |
Dec-12 |
8.20 |
20.89 |
0.06 |
| 2012-13 |
Jan-13 |
7.94 |
20.78 |
|
| 2012-13 |
Feb-13 |
7.92 |
19.24 |
|
| 2012-13 |
Mar-13 |
8.01 |
18.56 |
-0.19 |
| 2013-14 |
Apr-13 |
7.79 |
19.65 |
|
| 2013-14 |
May-13 |
7.48 |
19.84 |
|
| 2013-14 |
Jun-13 |
7.46 |
17.96 |
-0.55 |
| 2013-14 |
Jul-13 |
8.27 |
18.45 |
|
| 2013-14 |
Aug-13 |
8.78 |
16.70 |
|
| 2013-14 |
Sep-13 |
8.76 |
16.00 |
1.30 |
| 2013-14 |
Oct-13 |
8.71 |
16.00 |
|
| 2013-14 |
Nov-13 |
8.72 |
16.05 |
|
| 2013-14 |
Dec-13 |
8.77 |
16.10 |
0.01 |
| 2013-14 |
Jan-14 |
8.87 |
16.10 |
|
| 2013-14 |
Feb-14 |
8.94 |
16.10 |
|
| 2013-14 |
Mar-14 |
8.88 |
17.00 |
0.11 |
| 2014-15 |
Apr-14 |
8.89 |
18.45 |
|
| 2014-15 |
May-14 |
8.69 |
21.00 |
|
| 2014-15 |
Jun-14 |
8.75 |
22.90 |
-0.12 |
| 2014-15 |
Jul-14 |
8.49 |
21.15 |
|
| 2014-15 |
Aug-14 |
8.63 |
21.40 |
|
| 2014-15 |
Sep-14 |
8.53 |
21.90 |
-0.23 |
| 2014-15 |
Oct-14 |
8.30 |
24.95 |
|
| 2014-15 |
Nov-14 |
8.12 |
28.60 |
|
| 2014-15 |
Dec-14 |
7.92 |
28.25 |
-0.61 |
| 2014-15 |
Jan-15 |
7.69 |
33.10 |
|
| 2014-15 |
Feb-15 |
7.77 |
33.00 |
|
| 2014-15 |
Mar-15 |
7.80 |
29.80 |
-0.12 |
| 2015-16 |
Apr-15 |
7.89 |
30.45 |
|
| 2015-16 |
May-15 |
7.64 |
30.40 |
|
| 2015-16 |
Jun-15 |
7.87 |
27.30 |
0.07 |
| 2015-16 |
Jul-15 |
7.81 |
30.15 |
|
| 2015-16 |
Aug-15 |
8.05 |
27.30 |
|
| 2015-16 |
Sep-15 |
7.53 |
26.65 |
-0.34 |
| 2015-16 |
Oct-15 |
7.92 |
25.95 |
|
| 2015-16 |
Nov-15 |
8.07 |
26.30 |
|
| 2015-16 |
Dec-15 |
8.09 |
26.60 |
0.56 |
| 2015-16 |
Jan-16 |
7.52 |
24.35 |
|
| 2015-16 |
Feb-16 |
7.64 |
23.55 |
|
| 2015-16 |
Mar-16 |
7.40 |
25.05 |
-0.69 |
| 2016-17 |
Apr-16 |
7.87 |
24.55 |
|
| 2016-17 |
May-16 |
7.47 |
23.05 |
|
| 2016-17 |
Jun-16 |
7.78 |
25.15 |
0.38 |
| 2016-17 |
Jul-16 |
7.41 |
26.10 |
|
| 2016-17 |
Aug-16 |
7.11 |
28.20 |
|
| 2016-17 |
Sep-16 |
6.81 |
25.45 |
-0.97 |
| 2016-17 |
Oct-16 |
6.82 |
38.25 |
|
| 2016-17 |
Nov-16 |
6.30 |
53.30 |
|
| 2016-17 |
Dec-16 |
7.17 |
45.75 |
0.36 |
| 2016-17 |
Jan-17 |
7.15 |
55.25 |
|
| 2016-17 |
Feb-17 |
7.09 |
54.35 |
|
| 2016-17 |
Mar-17 |
7.06 |
53.25 |
-0.12 |
| 2017-18 |
Apr-17 |
7.22 |
52.90 |
|
| 2017-18 |
May-17 |
6.51 |
47.25 |
|
| 2017-18 |
Jun-17 |
6.59 |
48.95 |
-0.47 |
| 2017-18 |
Jul-17 |
6.55 |
55.00 |
|
| 2017-18 |
Aug-17 |
6.54 |
55.30 |
|
| 2017-18 |
Sep-17 |
6.82 |
47.05 |
0.23 |
| 2017-18 |
Oct-17 |
7.03 |
51.85 |
|
| 2017-18 |
Nov-17 |
7.25 |
46.90 |
|
| 2017-18 |
Dec-17 |
7.52 |
47.30 |
0.70 |
| 2017-18 |
Jan-18 |
7.37 |
43.15 |
|
| 2017-18 |
Feb-18 |
7.70 |
36.80 |
|
| 2017-18 |
Mar-18 |
7.42 |
34.85 |
-0.10 |
| 2018-19 |
Apr-18 |
7.80 |
38.00 |
|
| 2018-19 |
May-18 |
7.93 |
32.90 |
|
| 2018-19 |
Jun-18 |
8.00 |
28.75 |
0.58 |
| 2018-19 |
Jul-18 |
7.74 |
27.70 |
|
| 2018-19 |
Aug-18 |
8.01 |
31.50 |
|
| 2018-19 |
Sep-18 |
8.01 |
26.50 |
0.02 |
| 2018-19 |
Oct-18 |
7.84 |
28.10 |
|
| 2018-19 |
Nov-18 |
7.69 |
30.00 |
|
| 2018-19 |
Dec-18 |
7.44 |
35.50 |
-0.58 |
| 2018-19 |
Jan-19 |
7.29 |
29.75 |
|
| 2018-19 |
Feb-19 |
7.45 |
29.80 |
|
| 2018-19 |
Mar-19 |
7.37 |
31.35 |
-0.07 |
| 2019-20 |
Apr-19 |
7.46 |
30.20 |
|
| 2019-20 |
May-19 |
7.13 |
33.55 |
|
| 2019-20 |
Jun-19 |
6.88 |
|
-0.49 |
The company has also declared dividend of Rs 1.4 per share with August 14 2019 being Ex dividend bank. At current price of Rs 36 per share, same translate 3.9% Dividend yield
Risk:
The expectation of high profit growth depend on many moving parts. Since the company has large borrowing, any derivative on that book (which I may not be aware) can completely change the picture.
Disclosure: I have nearly 1% allocation in my portfolio to this company which has been added during Last 15-20 days. My view may be biased due to my investment. Further, I am neither SEBI registered investment advisor and nor recommending anyone to invest in the company. The investor shall do his/her own due diligence before making any investment decision.