Phreak's Thoughts, Ideas and Opinions

This is from twitter handle - @EquityInsightss

It also says - To download the data, Margin Trading Disclosure https://nseindia.com/all-reports

But I couldn’t locate data for complete 1 lac crore on NSE website. The table above lists 64 companies totalling MTF of about 34k crore.

Instead of fearing which all micro-cap will crash, we can look at whole data and will have more clearer picture.

4 Likes

Look at what exactly ?

It’s like looking at the sky and counting stars, 20 on Monday, 40 on Tuesday.

Okay… but does it really mean anything ?

It was infinite earlier, it’s infinite now.

CDSL has 21 crore outstanding shares. One day MTF data says 1 crore shares are in MTF, the next day it says 50 lakh. But no matter how many are in MTF, the total is still 21 crore.

It doesn’t matter at all.

1 Like

I have a contra view here, there is extreme pessimism in market rightnow, fear index is at peak, fundamental indicators are also indicating that slowdown should reverse in some pockets due to Govt initiatives, 75 bps rate cut, GST rationalization and income tax cuts will free up 8-10 lk additional credit in hands of consumers, inflation should also bottom out in near future. So brick & mortar stocks should bounce back from here as Govt Capex might take a hit going forward. Era of thematic stocks bull run is over. EMS sector should go in a long term time correction with normalized PE ratio of 20-25.

6 Likes

Yes, those are all valid points, and I agree with most of them.

But my argument is restricted to dismantling the myth that analyzing MTF data has any real value.

Beyond that, many here are far more experienced in reading markets, it’s not my core competence.

The risk is not in the quantity of the shares, it’s in the quality of the share holder.
Imagine there are 1000 shares of a company X.

Scenario A: The “Cash” Market - You have 1,000 investors who each buy 1 share of X for ₹100 using their own savings.

  • Bad news comes out, and the price drops to ₹80.
  • These investors are in loss but they don’t have to sell. They can just wait for recovery.

Scenario B: The “MTF” Market - Now, imagine those same 1,000 shares are bought by traders who only had ₹30 of their own money. They borrowed the other ₹70 from a broker (MTF) to buy the share at ₹100.

  • The price drops to ₹80.
  • The share is worth ₹80, but the broker is still owed ₹70. The trader’s own equity has shrunk from ₹30 to just ₹10.
  • Margin call gets triggered.
  • The trader doesn’t have extra cash. The broker’s automatically sells the share at ₹80.

In Scenario B, that sell order hits the market regardless of whether the trader wants to sell or not.

Now, imagine this happening to 500 traders at the same time. Suddenly, you have a flood of forced sell orders hitting the screen. But because the price is falling, no buyers are stepping in. The price crashes from ₹80 to ₹60 which triggers another wave of margin calls for the guys who thought they were safe at ₹70.

In both the scenarios quantity of the shares remained same, yet the outcomes were different due to the leverage.

21 Likes

This is a very hypothetical situation, and most of what you said never actually happens.

First of all, the MTF position size is very small compared to a company’s market cap.
Secondly, MTF is available only in fairly liquid names.

Prices in such stocks don’t just fall from 100 to 60 without a valid reason.

And it’s a market, if a stock becomes cheap at 60, people will buy it, right ?

So they won’t let it fall that much in the first place, and even if it does, the recovery is usually very swift.

As I said, at the stock level there is no leverage; it exists only at the individual level.

CDSL has 21 crore outstanding shares. How does it matter if 1 crore out of 21 crore is MTF and the rest is non-MTF ?

The total float in the market is still 21 crore. Forced selling is just selling, you can’t “force sell” when no synthetic liquidity is created.

9 Likes

That sure explains the volatility and the slowness in rising up after a steep drop but does not really mean all the MTF is being held in small/microcaps only . Unless one knows what percentage of stock (in a particular company )is held by MTF availers ,what good is it to press the panic button over generalised statements ? Big largecaps still rules the MTF list looking at the screenshot by Gaurav Agarwal . Momentum stocks or present darlings will have the largest MTF exposure simply because MTF is mostly used by people with more adventurus traits or speculative inclination . So it sure means that once a darling falls it will fall hard ,as seen in Taril,Kaynes,Sahkti pumps etc. , but does not mean all micro smallcaps will suffer the same .

2 Likes

This is key, i guess. Stock moves will now be dependednt on individual performance. So our work has to be stock specific and fundamentally solid companies will move ahead.

2 Likes

With @phreakv6 help, I have been able to download the MTF file from NSE website for 8-Dec-25.
mrg_trading_08122025.xlsx (108.3 KB) Here it is, if someone wants to do some kind of analysis.

I have tried to calculate average of last 30 days value of Kaynes shares traded
Quote-Equity-KAYNES-EQ-10-11-2025-10-12-2025.xlsx (7.9 KB)
and compare it with total MTF for the script.

So daily average value for last 30 days is 1028 crores and total MTF is 766 crores. So total MTF is approx 75% of daily traded value. To my mind the amount of leverage does seem so big that it can create chaos in the market.

Also fairly large amount of MTF is in scripts with quite large free float market cap for example total MTF for Hindustan Aeronautical is 1674 crores whereas it’s free float market cap is 74,751 crores. So MTF is 2.2% of free float market cap.

We can bisect and dissect these number in n number of ways. If you have some other way to look at these numbers which is causing worry, please share so that we can contribute and share our findings.

16 Likes

A subtle Humour take on the serous subject.
This one’s a crazy exercise unless if someone has tech to parse & get the data sorted for easy filtering.

On a LIGHTER CRAZY note, just like PEAD = Post-Earnings Announcement Drift, which relates to price action movement post declaration of result, we should create a new feature called MEAD :sweat_smile:

MEAD — Margin Exposure After Disclosure

Definition:

MEAD refers to the predictable price drift that occurs after brokers disclose Margin Trading Facility (MTF) data, especially during bearish or stressed market phases. When a stock shows high MTF participation, a fall in price increases the threat of margin calls, triggering forced sell orders by brokers or investors who cannot bring in fresh collateral.
This chain reaction often creates a downward price drift even after the initial fall has already happened.

Intended Purpose:

MEAD helps traders identify fragile stocks where a sharp downside move can lead to a cascade of forced selling because MTF positions are high. It acts as an early-warning tool for understanding:

• Liquidity stress
• Probability of margin calls
• Forced unwinding risk
• Bear-market vulnerability

OTHER CREATIVE TERMINOLOGY OPTIONS:

  1. MTSD — Margin Trigger Selloff Drift
  2. MFAD — Margin-Failure Aftershock Drift
  3. M-CRASH — Margin Call Reaction & Sell-off Hammer
  4. P-MTD — Post-Margin Trigger Drift
  5. M-SAND — Margin Selloff Amplified Negative Drift
10 Likes

MTF was never the driver of the broad-based bull market. The rally in small caps began because of low valuations and strong earnings growth, which later attracted margin-funded buying.

The Smallcap index was trading at a 17 P/E when the previous run started.

1 Like

In zerodha, “Margin” just means “Money locked for a specific purpose.”. When you buy a stock with your own cash (Delivery/CNC), the trade doesn’t settle instantly. It takes a day (T+1) for the money to actually leave the broker and go to the exchange. Until that happens, Zerodha moves your cash from “Free Cash” to “Used Margin.” It’s not leverage; it’s just your own money being “blocked” to guarantee the trade until settlement finishes overnight.

MTF (Margin Trading Facility) is a specific product where you borrow money to hold stocks longer than a day. You put down ~25-30% of the cash, and the broker lends you the rest.

2 Likes

1st of all, thanks Bhavani for excellent analysis , as always. I feel, that’s why it’s very important to follow technicals. Personally was invested in Kaynes, Dixon but gradually reduced and then exited as smart money started exiting…will advise Retail to learn the same , on weekly timeframe basis. It’s impossible for retail to track so many variables.

2 Likes

An overall decent article praising MTF by CEO of kotak securities (who benefits from the lending book)

Indian stock market total capitalization is approx 450 lakh crore, MTF size is about 1 lakh crore. Liquidity in certain over leveraged stocks may be a significant factor though.

6 Likes

Found a somewhat compelling idea in the largecap space - Hindustan Zinc. Everybody knows the technicals and can look up the chart - its hit a fresh 52w high after 6 months and trading at 2 yr highs but considerably below (~30% lower) than ATHs. Rest of the post is on fundamentals.

Brief
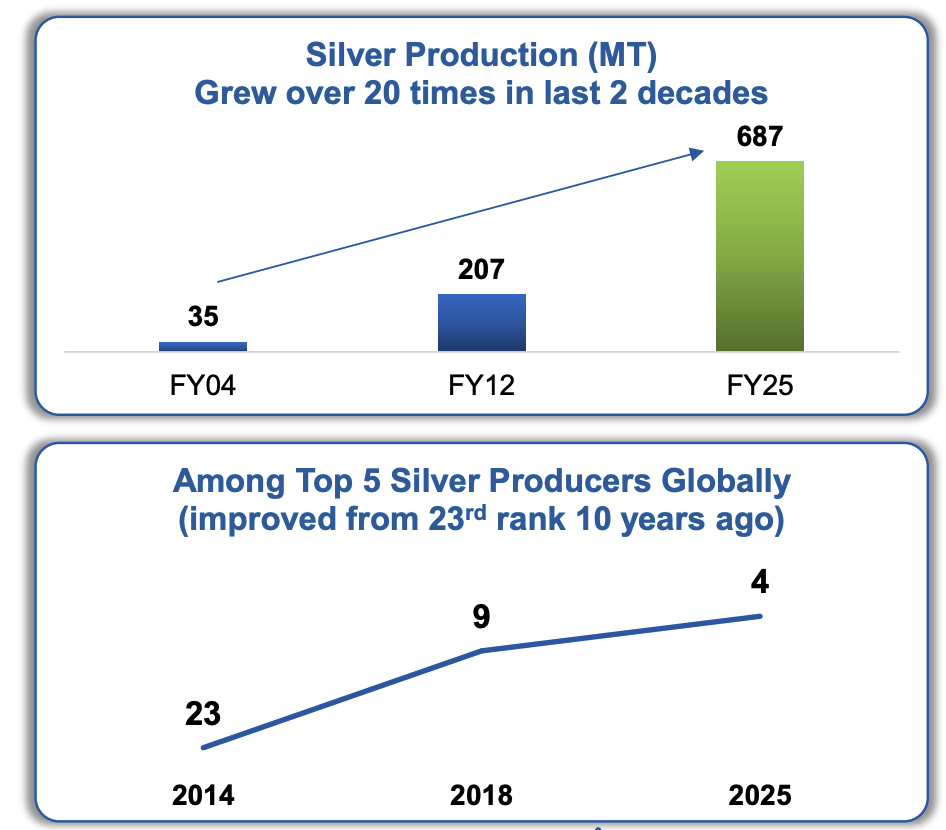
HZL produces predominantly zinc, lead and silver. It is one of the lowest cost producers in the world and has also is 4th largest in Silver and its impressive how the company has vaulted from 23rd to 4th position in a span of ~10 yrs in silver.

Silver Macro
Before you do anything if you haven’t read, take an hour off and read this. Silver has been added as critical mineral last month by US. The context for the same is explained in great detail in the post.

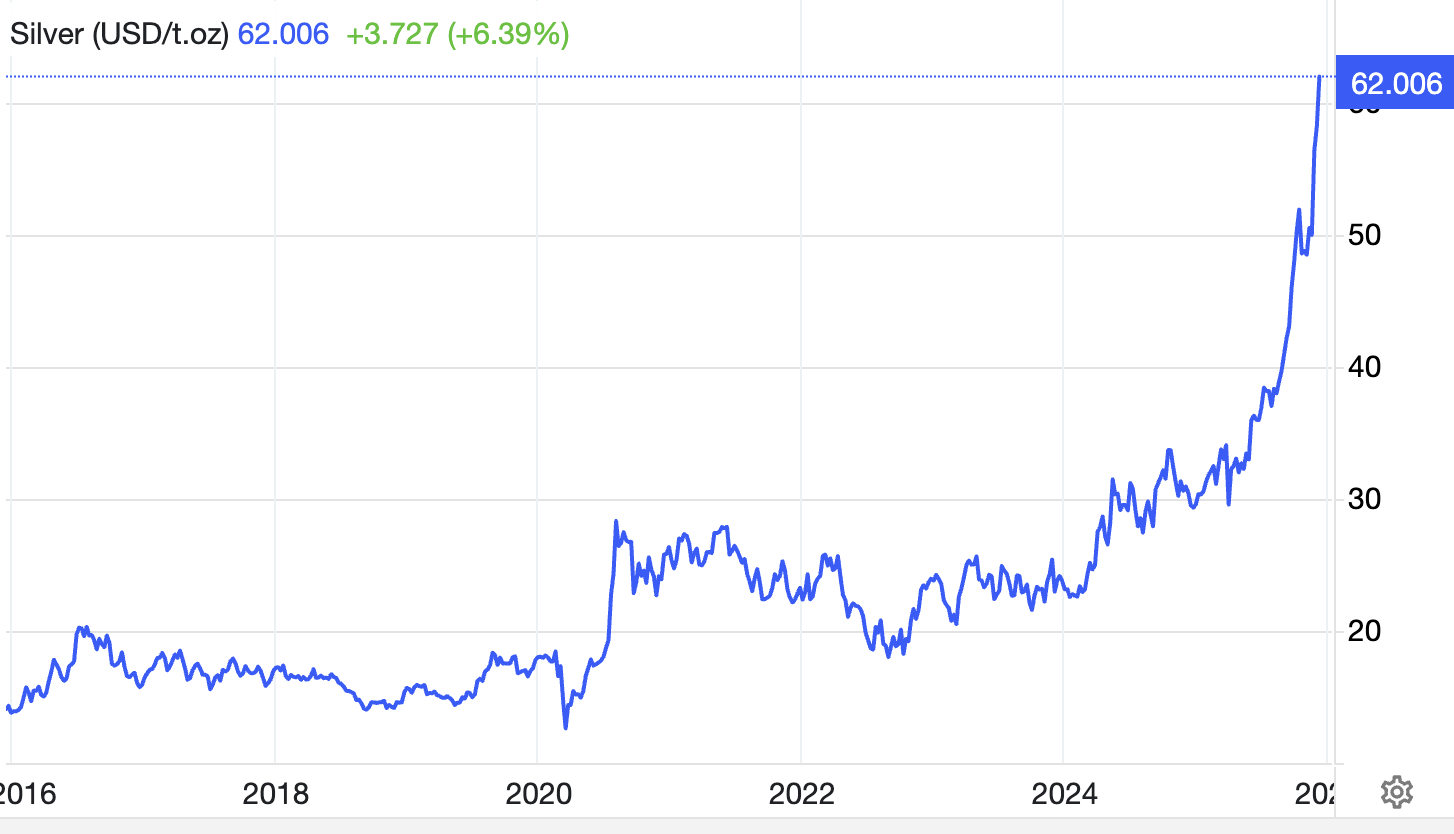
The reason I got interested in HZL is because of the way Silver has been behaving in the last 3 months. These are taken from B&K report on HZL (phenomenal report)

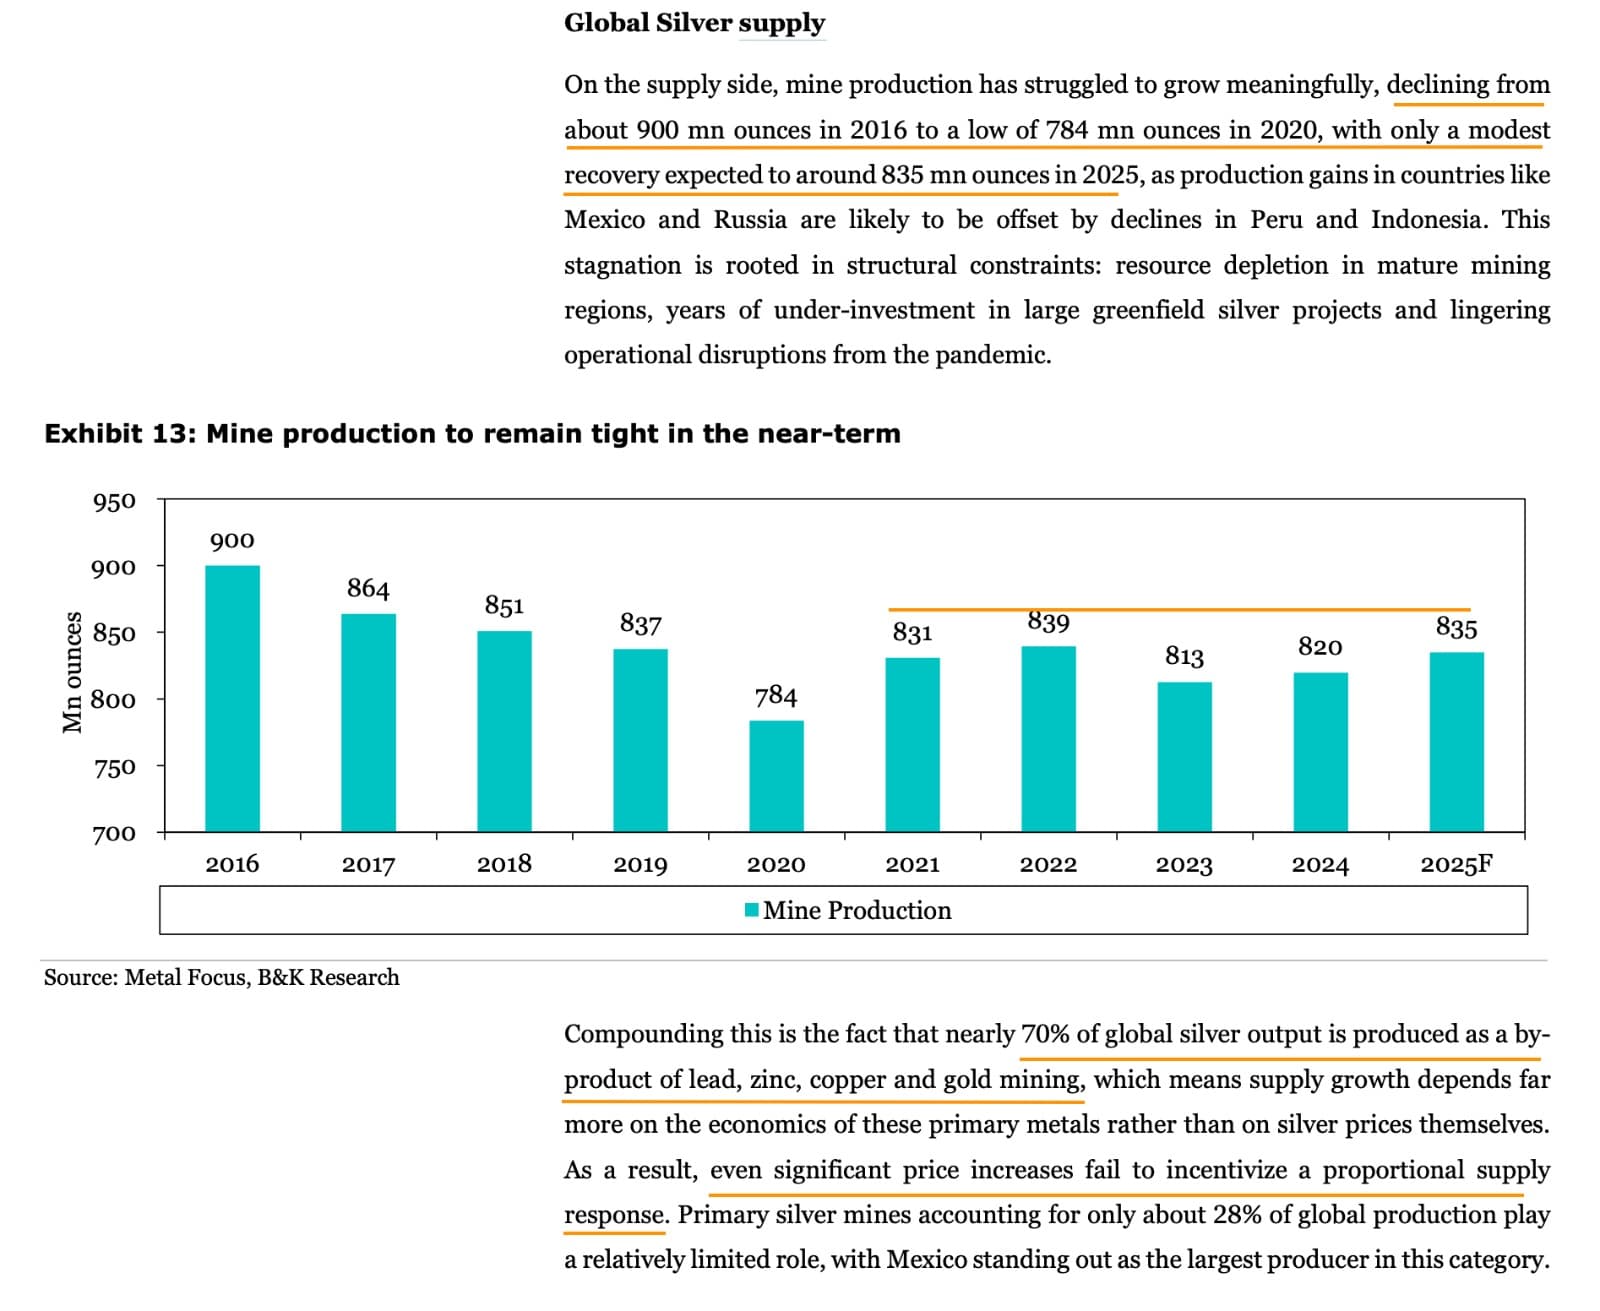
Silver has been in deficit last 5 years and being a monetary as well as industrial metal, the demand is going to remain strong going forward with QE + AI, Drones, Humanoid Robots, Data Centers, 5G all competing for Silver.

But the production hasn’t kept up - mainly because Silver is mostly a hitchhiker mined along-with other minerals like Zinc, copper etc. There’s no big production bumps expected in the near future.

There are some calls for even triple digit prices on silver. But I think better to take them with a pinch of salt. They do make some pertinent points about silver:gold ratio though and how it used to be 6%+ even not so long ago but is today ~1.5%. Maybe it is silver’s time to get re-rated. But our assumption here in this post is very, very conservative at just ~$50. Anything else is bonus.

Thesis
Its a decent way to play Silver through Indian equities. The Zinc-Lead part of business can hold their own as prices are firm there as well. As of recent quarter it derives 40%+ of its EBITDA from Silver and silver prices have gone parabolic.

People playing commodities have been excited about Silver since Oct so this is nothing new. HZL still struggled to break past the 520 barrier which it did for the first time yesterday.

It is also shielded from daily volatility one has to endure while playing Silver as a commodity because as long as the avg realised prices for the quarter is higher than in the past, the company would make higher profits and that is good enough, given the low starting valuations

The company has a silver production capacity of ~700MTPA. In H1 they have produced 293MT and in guidance they have 680MT so H2 should have ~400MT production. Of this 130MT is hedged at $37/oz while silver price today is trading $60+/oz. So the rest of the capacity of 270 MT will be sold at spot as per management - this is where every incr. $ goes directly to bottomline.

Levers
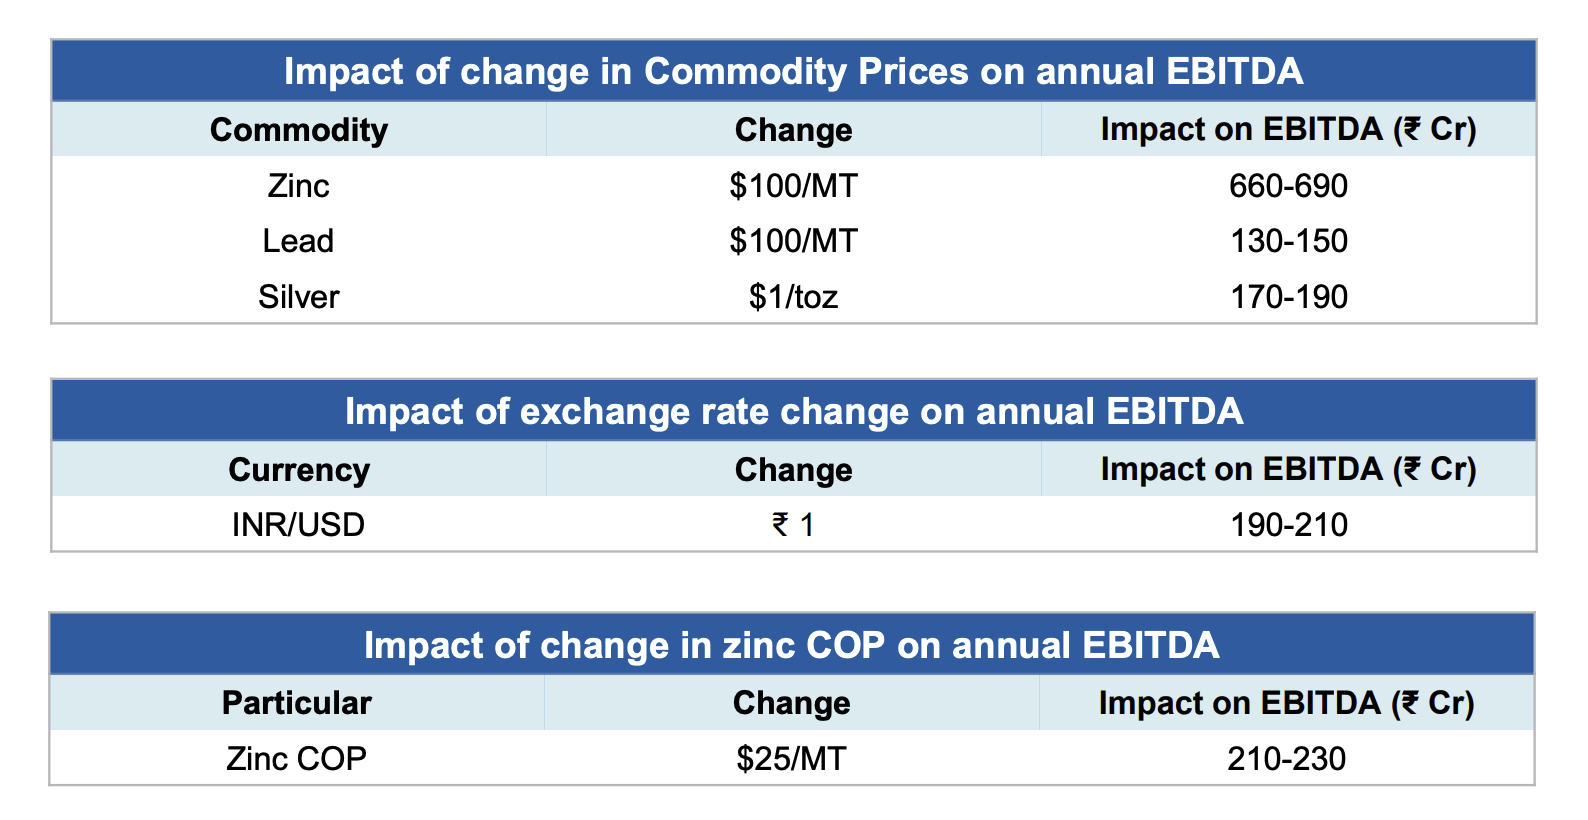
Several levers in this are currently playing out. Silver $1/oz adds ~180 Cr to EBITDA.

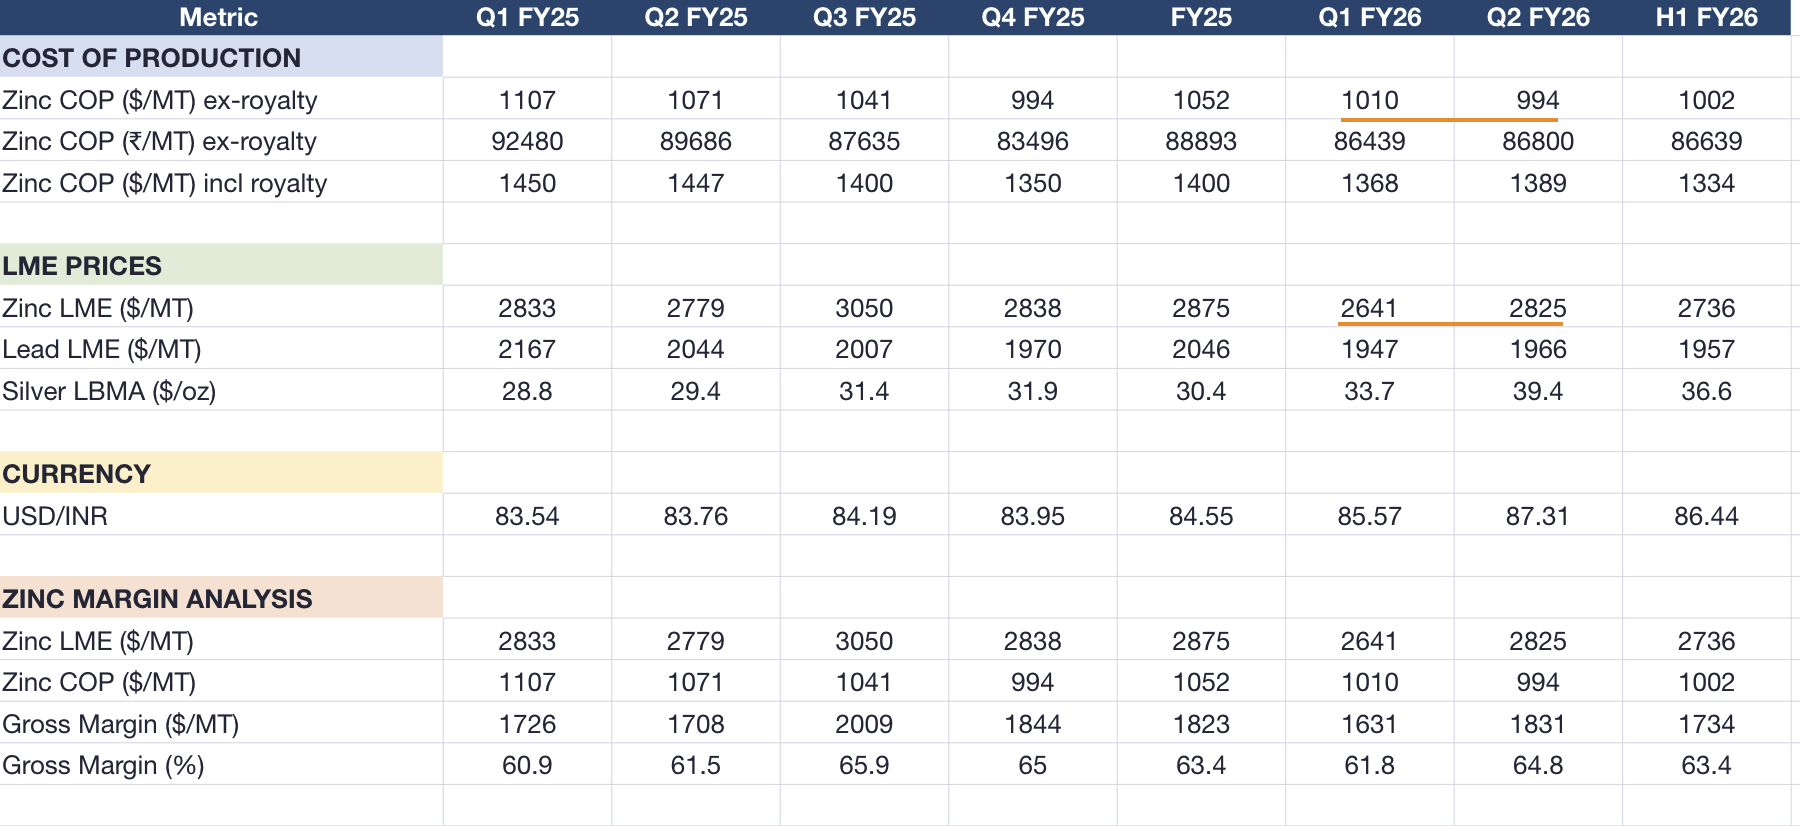
In Q2 silver realised price was $39.4 and that already made silver contribution to EBITDA go up to 41%. Silver volumes were lower than production capacity as well in H1 at 293 MT vs 350-400 MT possible in H2. We might be looking at $45/oz avg in H2 and $50+ avg next yr (spot prices are already 60+ but being very conservative here) which can add ~2000 Cr to EBITDA.

Also exchange rate has seen a bump from 87-88 levels to 89-90+ levels this qtr. That should add ~400 Cr to EBITDA.

Zinc prices in Q2 were ~$2800/MT. There’s a bump up by ~$300 in spot prices. Zinc ~99kt seems to be hedged out of ~800kt, so we can assume a $200 bump in realisations which should add 1300 Cr to EBITDA.

The other thing is Zinc COP - the company has gradually reduced cost of production of zinc which is now down to $994 and guidance is go as low as $950 by Q4. This adds another 300-400 Cr to EBITDA from efficiency improvements.

So overall, even with these conservative assumptions (mainly on silver), we can see a ~4000 Cr EBITDA gain in next 12 months (~22% growth). If we assume another $10 gain in silver (bull case) - then we are talking another 1800 Cr (33% growth).

Valuation
Given the considerable growth levers available, the company is still priced in cheap at 20 P/E when global peers are all priced ~30 P/E. Fresnillo which is the largest is priced at 62x. Southern copper corp (silver byproduct) trades at 32 p/e. Pan american silver corp at 29x. All are trading at ATHs, unlike HZL which has not participated in the silver run at all until this week. HZL is the world’s 4th largest silver producer and their mine is the 4th largest producing mine (though India ranks 12th - thats how big HZL is).

Risks
Promoter has played tricks here in the past. Mainly dividend stripping - even borrowing to pay dividend. But maybe ~25% of the dividend paid came from debt and rest from accruals. This risk might be contained in the near future because there’s a lot of capex commitment that requires maybt 20-30k Cr to be invested over the next few years.

Promoter might still raise money by selling stake increasing float. This again has happened in the past. But the company is very underowned and is cheap - I see a considerable shift globally towards precious metals that its possible that these start trading higher than historic valuations because of geopolitics and macroeconomics.

Since we aren’t overpaying, commodity cycle risk here is low - might be different if buying 30-40% higher.

Disc: Invested

98 Likes

@phreakv6 are you still holding Ceinsystech & genesys? Its Vertical fall in both.

1 Like

@Cshar No I don’t. Still have some ceinsys to follow through on the thesis but genesys I sold back in Jan. Both are perhaps at good levels now.

I went down the rabbit-hole of silver out of curiosity since its something I have never explored before. Tried to ask a lot of questions, find answers and piece together an understanding.

Generally for a commodity, there’s a rate of fresh production and rate of recycling of previously mined quantity, there’s consumption (some reversible, some irreversible) so it helps to understand some of these to understand value.

Silver supply deficit is roughly 200 Moz (million troy ounce) per year. Production is roughly 800 Moz as I previously posted. Total silver ever mined on planet earth - 56 Boz (billion oz) or around 1.74m MT. But in this 28 Boz has been lost in industrial use and is in landfills (very expensive to recycle). 25 Boz is in jewellery and only 3 Boz is in investment grade (bars, coins, ETFs). For gold 98% of everything ever mined still exists.

The other thing i wanted to understand was how much of underground reserves exists and what is it as % of mined reserve. For Gold, there’s 216k MT that exists above ground vs 850k MT for silver (half is lost) and underground reserves for Gold is around 60k MT (30%) and silver around 550k MT (32% of 1.74m MT mined). But the catch is gold’s above ground stock grows 1.5% annually while silver’s above ground stock is constantly shrinking (consumption > production + recycling)

Assuming you are all familiar with stock vs flow, gold’s stock-to-flow ratio is ~60 (~3500 MT production vs 216k MT above ground) but for silver this is ~3-4x (800 Moz vs 3 Boz) for investable silver.

There in lies the catch. Silver taking a sudden turn as a monetary metal puts undue pressure on supplies. A lot of silver locked up in jewellery isn’t currently monetisable in the same way gold is (via gold loans for eg.). That should put some perspective on RBI allowing silver loans in the near future.

Now coming to Silver ETFs.. This is how it has moved for India

Jan '24: 3.7k Cr
Jan '25: 13.6k Cr
May '25: 16.8k Cr
Dec '25: 40k Cr+

The growth in ETFs in crazy even when adjusting for price of silver (This is reported silver AUM). So ETF demand from India is what is causing the crazy silver imports over last few months. RBI strangely seems to be OK with this even though its putting pressure on the rupee. To put it in perspective - our ETF holdings alone is 10% of global silver production (and now Indian pension funds are allowed to invest in Silver ETFs). It looks to me like we are the reason for Silver’s upward momentum.

Central banks haven’t recognized silver as a monetary metal since the 1970s. Even before that post Bretton Woods in 1939 when dollar was pegged to $35 per ounce of gold, the gold-to-silver ratio went for a toss. So these two steps progressively eroded silver’s stance as monetary metal which was there for millennia prior. What’s happening now seems to be a reversal in stance - at least in Asia (the West seems to be happy to get rid of Silver and even today there’s no intent in most of West towards Silver though the intent towards Gold has changed). We have to see how much this changes in the near future.

What happened in Oct is silver lease rates spiking to 35% (ATH) - i.e rates for borrowing physical silver for delivery. This is normally 0.3-0.5%. LBMA free float in silver has reduced by 75% of where it was in 2019. Comex is down 58% from 2022 highs. Physical silver supplies are dwindling in the west. That should put into perspective Trump’s recent designation of Silver as a critical mineral. China is also restricting it from Jan '26. (8MT of silver in 1 GW data center apparently as per this post)

Silver has always been a small market compared to Gold and that’s why the Hunt brothers tried to corner it in the 80s (still shows funnily in the chart). Even today, the story is same vs Gold. Gold ETFs are worth $530b vs $45b in silver (12:1). A $1b incr buying in silver goes a long way into stress on demand of physical metal and thus the supply squeeze vs gold. That’s why things were great when everything was paper contracts but ETFs require physical silver of certain purity - once this demand started coming in, things have started to go haywire.

Not sure how it ends and certainly my understanding of this whole thing isn’t complete and I have tried to dump everything here to help my thinking. There’s a possibility the paper silver disconnects from physical silver or gets settled in cash or something.

Few things that are worth watching which could be risks to Silver price

  1. Any govt interference to wean away people from Silver - like how they launched SGBs :-)
  2. Industrial substitution of silver with other metals or tech improvements to use less silver
  3. Silverware could find its way into the market from the glacierised form they have been in at higher prices - I think this is RBIs plan as well for monetising public Silver

At least from HZL thesis, its still good to work with $50/oz for another 3-6 months and ensure this level is safe before recalibrating.

Disc: Invested in HZL recently and absolute novice in commodities and novice even otherwise. Writing just to clear my head

58 Likes

Thanks @phreakv6 for detailed reply and interesting analysis on silver.

1 Like

@phreakv6. Always a delight to read your posts.

Would request your deep dive or atleast initial research (which is more than deep dive of normal folks like me) for nuclear energy sector and it’s ecosystem, especially in view of recent SHANTI bill introduced by the government.

Thanks and regards

3 Likes

Just a thought and question - on same logic, why would platinum not go up significantly from here, afterall platinum is even more scarce then Gold?

2 Likes