Of course I do. You have been very actively posting many charts, and I am sure many are getting benefited by them.
Some people remain only as fundamental investors, they know that it is the changes that take the stock up or down, and so focus on those changes. While investors who depend on TA are not too bothered about what is happening on the ground, as all of that is reflected in the charts. I think, both are correct in their respective ways. Like Buffett says, bulls make money and bears make money, so good investors who belong to both these camps make money.
And I personally feel that, it is not that difficult to have both these styles mixed, for a better outcome. In fact, I am getting more inclined towards looking at a chart first and then take a decision as to go forward or not. How could one deny a chart that encompasses the story of a stock for the period selected? But also, the first movers are always fundamental investors, they know that the weather is changing and that it is the right time to make a move, which then gets captured in the charts.
So yes, learning from different disciplines will yield better results, unless one masters one particular way of skinning the cat.
I also happened to be a purely fundamental investor. Used to buy whatever I found undervalued and sit on the same for years. Then I realised that certain stocks won’t move for years and certain other stocks would go to very high levels and would start correcting from there. in both cases, I was loosing -either on opportunity cost or loss of profit.
Was trying to find a better way -and then I realised that prices move in cycles (EW) - effort should be to enter at lower end of the cycle and try to exit when the cycle is near the peak. And most of the cycles happen due to tailwind in sector, economy as well as liquidity. That’s how i got into tracking cycles, macros and technical analysis.
Now I consider myself as a fisherman and market as an ocean, I select the fish (fundamental basis) and then wait for the calm waters and tailwinds in the sector ( as stocks of one sector tend to move in a herd) to go inside the ocean. But tend to get out when there are signs of a low tide ( less liquidity) or a tsunami. Don’t want to take those extra risks.
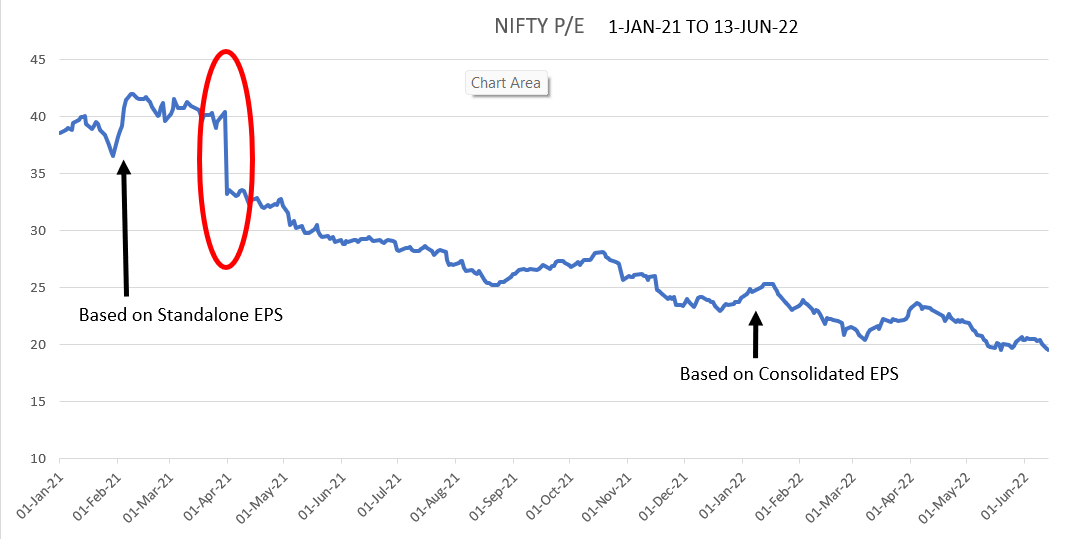
There is one thing investors must remember while using all this - NSE changed their method of calculating P/E from Standalone EPS to Consolidated EPS with effect from 31-Mar-21 without any retrospective correction. So P/E ratio prior to that date is not comparable with current P/E to that extent.
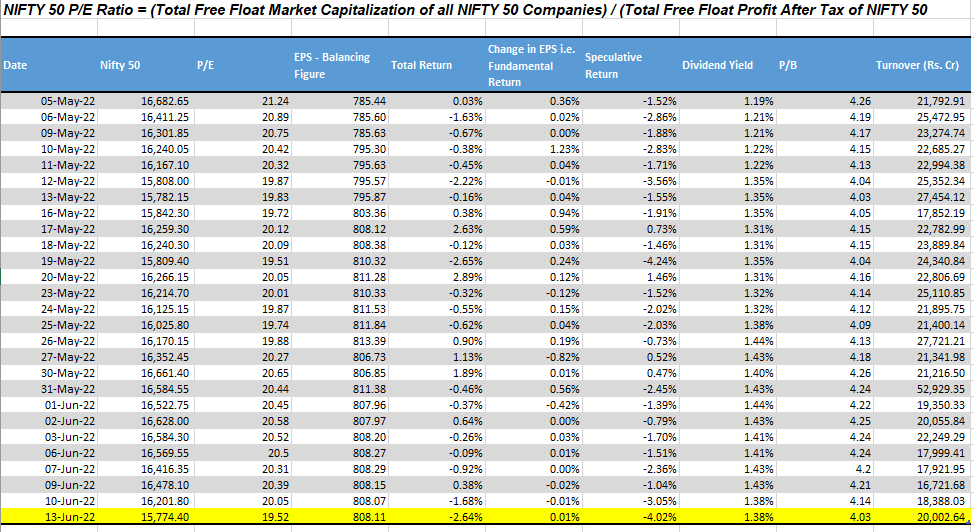
Your reminder got me thinking. Just tried bifurcating Total Returns into Fundamental, Speculative & Dividend Yield. (Reference: Parag Parikh’s Book on Value Investing)
Here, the fundamental component reflects trend in earnings of corporations comprising Nifty 50. And the Speculative Component reflects the impact of change in appraisal of earnings - i.e., change in PE ratio due to investor optimism or pessimism.
Can one comprehend the comparatively predictable/fundamental return this way?
Ps. In the markets since barely a year. Could have made some errors that may be very obvious to you. Please share your critiques/rationale - here to learn!
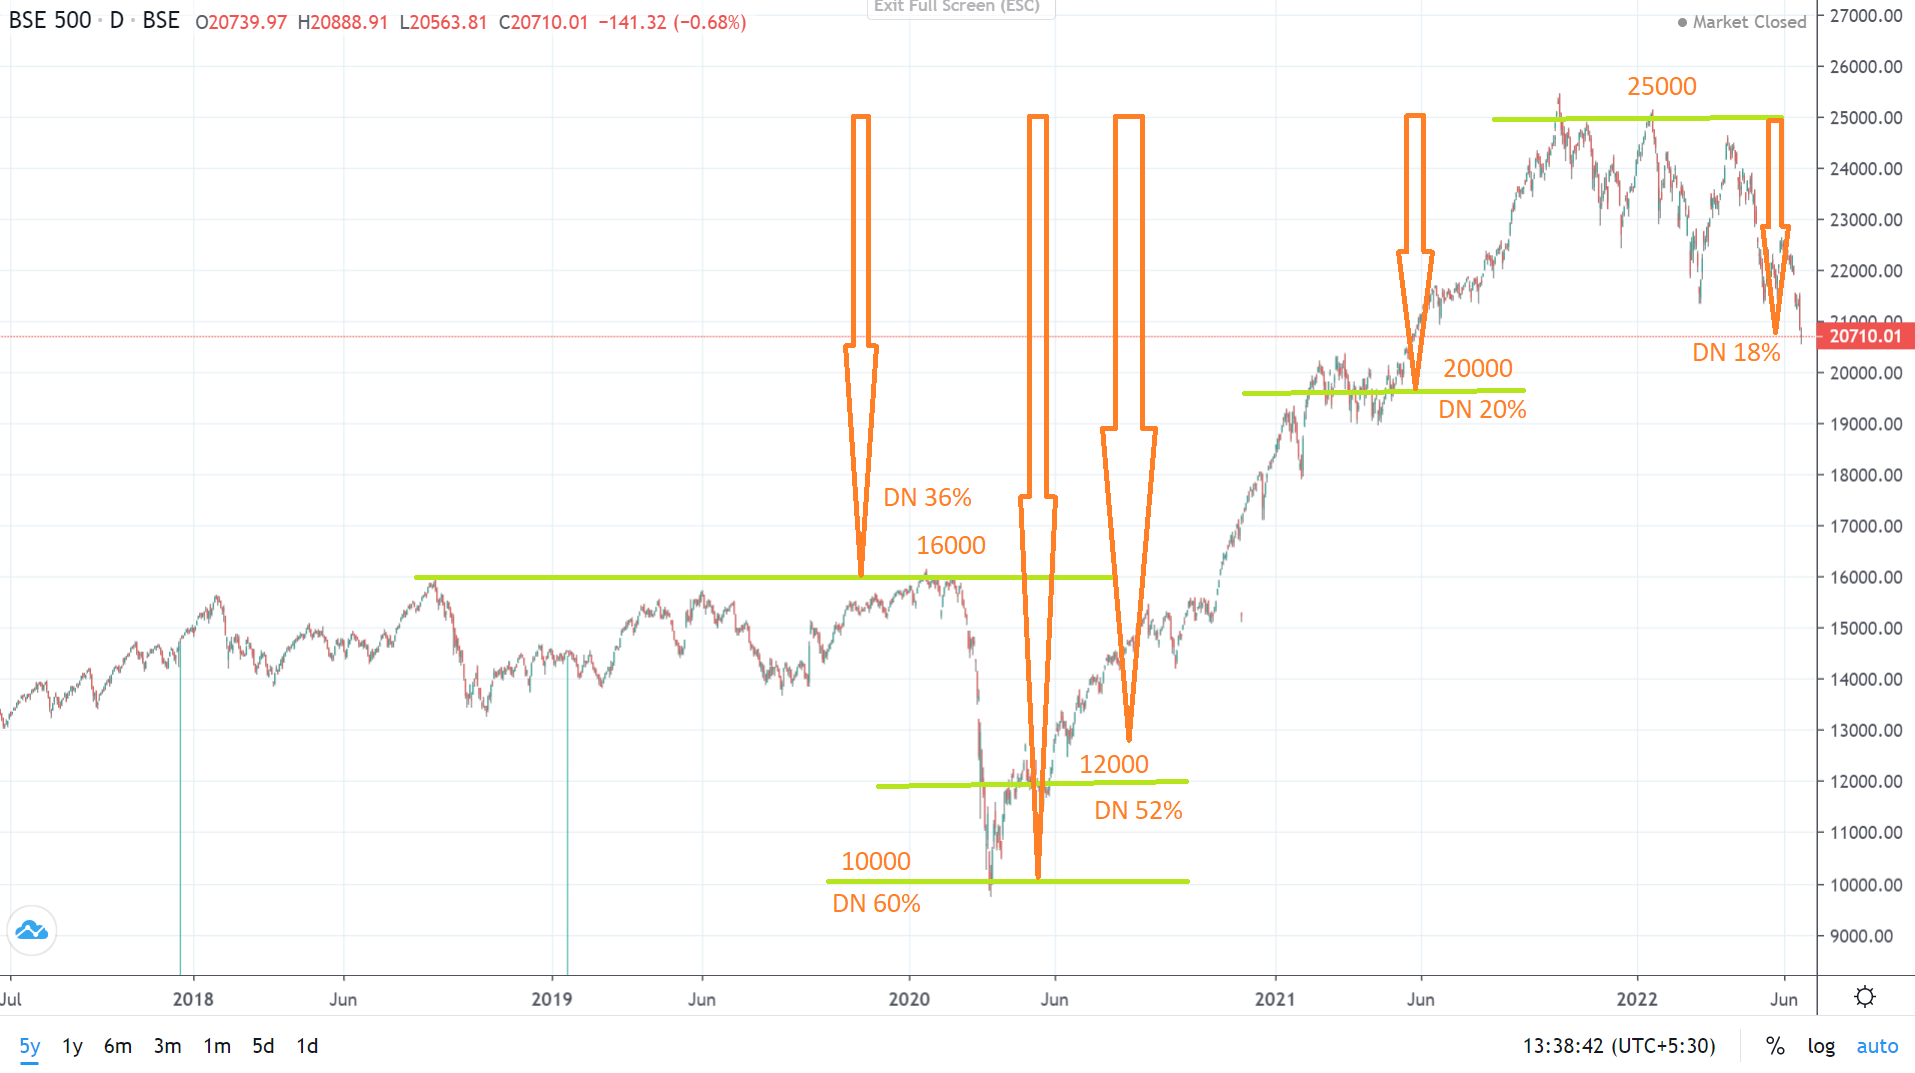
I am not sure this would help in any precise way, because the decrease in levels, or the consolidation tells that optimism or froth is fading away. I think this would if you are an index investor, you can start investing depending on the current levels, if they are comfortable for you to invest. But if you are a stock investor, this broader market data although has influence on the stocks, each stock has its own support and resistance zones, its own fundamental structure.
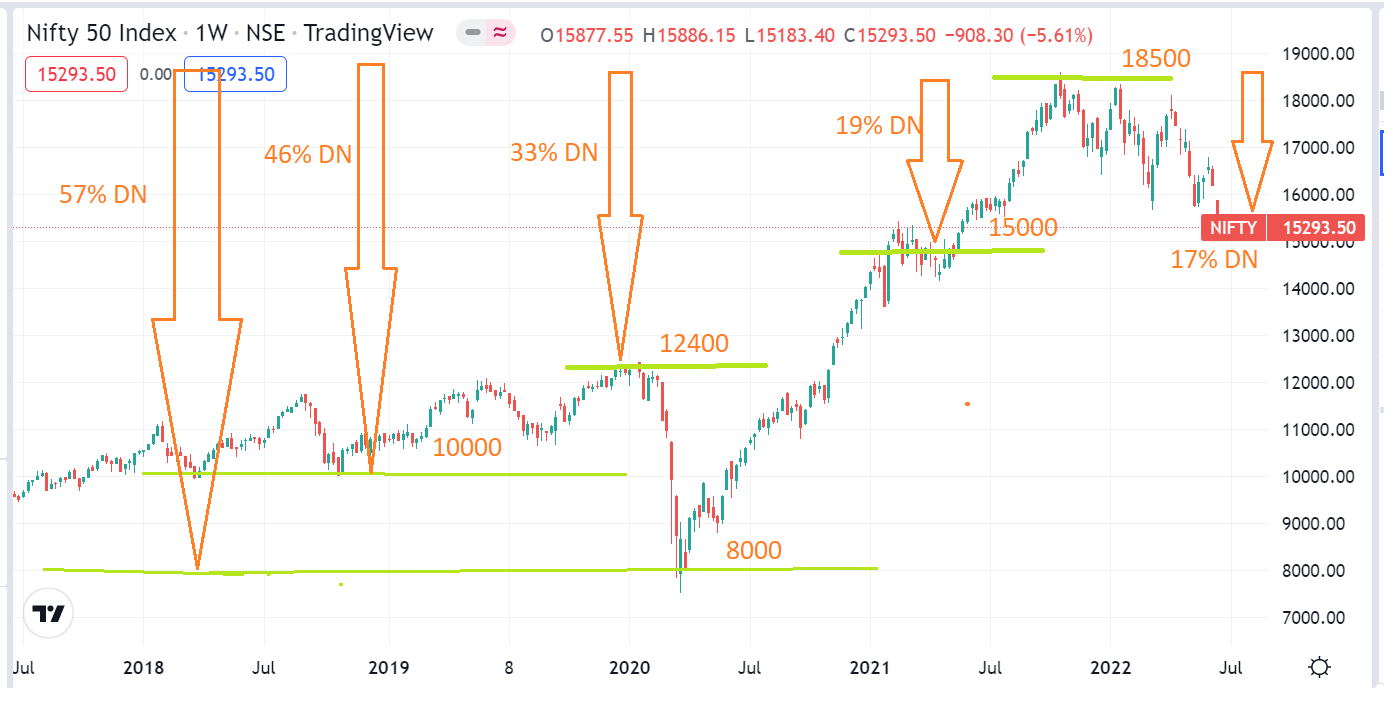
One could say, the fall is not over as the index is down only 15% from ATH, and there will be another 15% fall from these levels, or it will fall by 5% and will stay there for a couple of quarters etc. It all boils down to how you are invested in the market.
Just my thoughts. Invested both in stocks, and indices.
Somehow I would not suggest any buying at this stage. There has been a structural breakdown in global indexes -inflation, FED QT, Bonds situation + war +Bitcoin liquidity - there are lot of moving macro factors.
I feel this is only the 1st leg of the bear market , next leg would be more severe. To get more macro factors, one can always check my thread on macros.
There are however select stocks building flags like Apcotex, timken however most likely they will fail
Second scenario could be that the market will attempt another recovery as retail interest is still strong. Most people who have been in the previous bear market would have likely exited where it’s easy to exit. Some can’t due to the size of their holdings
The remaining will most likely exit if there is another rally. As June quarter comes to end leading into July where quarter results are declared we will most likely see a penultimate rally.
I think there will be another rally but by December it will get really scary because you’d be past festive demand into leaner period.
I don’t track many variables, just level of credit in the economy, bond rates and individual stock charts
Agree with you. I also feel that we might see a small bear -market rally (counter-trend bounce) in July after 3 months of consistent fall. (as per EW too, small retracement is expected once we comlplete current leg of fall )
But overall ,we are in a bear market and may be for next 6-9 months.
Not Just That. Even the Nifty constituents have changed over last decade. Many PSUs of lower PE are replaced with higher PE companies like Bajaj Finance, Bajaj Finserve etc.This has naturally lifted average PE of Nifty. I dont have any exact data, but if earlier the normal average PE of nifty was 15 then now with new entrants, it must have elevated to PE of 20.
Hi everyone,
According to this article, the formula for the calculation of Nifty PE is as follows:
NIFTY 50 P/E Ratio = (Total Free Float Market Capitalization of all NIFTY 50 Companies) / (Total Free Float Profit After Tax of NIFTY 50 Companies for the Last 4 Quarters)
Can anyone help me understand what the Total Free Float Profit After Tax means and how it is calculated?
I don’t think there is any such thing as Free Float Profit After Tax, the article is incorrect. Nifty P/E would be calculated as (Summation of market cap of all Nifty 50 companies / Summation of PAT). Of course by reducing promoter stake from both the numerator and denominator, arithmetically you will get the same P/E as answer, but functionally it doesn’t make sense.
Contribution to NIFTY (index value) for each company is based on its free float market cap. In that context, should the contribution to PE should also carry similar weightage?
I mean Nifty (or any Index) PE should be equal to Weighted Average of its Constituents PE.
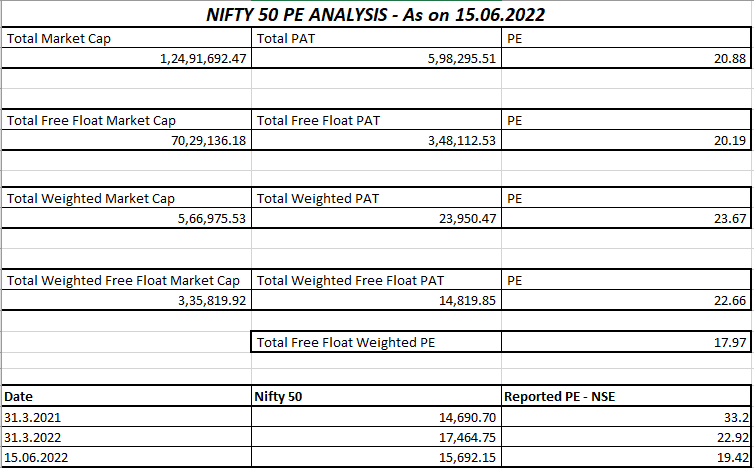
I tried doing that and am getting a PE of 17.97 compared to the 19.42 PE reported by NSE on 15.06.2022. These are the different permutations and combinations I tried. The closed was
Nifty 50 PE = Total Free Float Market Cap of all Nifty 50 companies / Total Free Float PAT of all Nifty 50 companies
Here, I took Free Float PAT as the sum of PAT of each company multiplied by its free float, i.e., public shareholding. (Free Float Holding = 100% - % of Promoter Holding)
One can do the arithmetic and get a number, but the question is what it means functionally and if it adds value to the way Nifty P/E is understood, interpreted and used.
A P/E ratio indicates how many times of current earnings the investors are willing to pay for the stock. In case of the Nifty, how many times of aggregate PAT the market values it.
On the other hand, free float market cap is used instead of total market cap due to the belief that stocks with higher free float are more liquid and have lower impact cost. And so price changes are free from “artificial” volatility caused by lack of liquidity and reflect the “true” demand / supply condition. Using FF supposedly makes the index more robust.
These two are unrelated issues. I doubt if anything will be achieved by weighing Index P/E with free float. Seems to unnecessarily complicate things when all we want is a simple Market Cap-to-PAT figure.
What you have said, makes sense. I was just trying to figure out and understand how exactly the PE for Nifty was calculated in order to make sense of the number with clarity.
Nifty is a fabricated index and it no where indicates the overall stage of the economy or the markets.
Look at the number of companies that have corrected by more than 20-40% with in this index , but you don’t see it in Index. HDFC and Reliance have a greater weightage in the index thus any price movement of these 2 affect the index in a greater manner than it should ideally do. That also have an impact on overall PE ratio.
Most of the world’s best indexes are not designed like this ( e.g DOW gives only 5% weightage to Apple although it is > a trillion dollar company)
To me it is useless to do any analysis on this index unless you are trading in index. ( although not perfect, but Nifty 500 is still a better index if someone wants take a view on the markets.