
Delta never really led to much restrictions but the spread of Omicron can see govts imposing restrictions. Many EU countries have reannounced lockdowns and that’s what the fear is. FED related action was always something that markets anticipated, which is why they had corrected 7 odd percent. I’m pretty sure the further correction is anticipating a deterioration in earnings environment in Q4. Lets see how it plays out.
What is the updated PE ratio for nifty now?
It’s 24.29.
Sources for easy lookup
4 Likes
Hi,
Though NIFTY has corrected in last few days, P/E seems to have moved up or at same level.
This could be due to some lower earnings by some NIFTY companies due to inflation/raw material costs/lower margins.
So one need to wait longer for meaningful P/E correction, if one is looking to enter NIFTY Index funds at fair P/E.
Just a thought from my side, though I do not invest in any index funds as of now.
That’s a correction from 40 odd … would that construe as a lot? Despite nifty being less than 10% away from ATH.
Since the Nifty PE graph is a combination of 2 graphs - the Nifty Index graph and the EPS graph, these individual graphs are as follows (NIFTY50 - Nifty 50 PE (trendlyne.com))
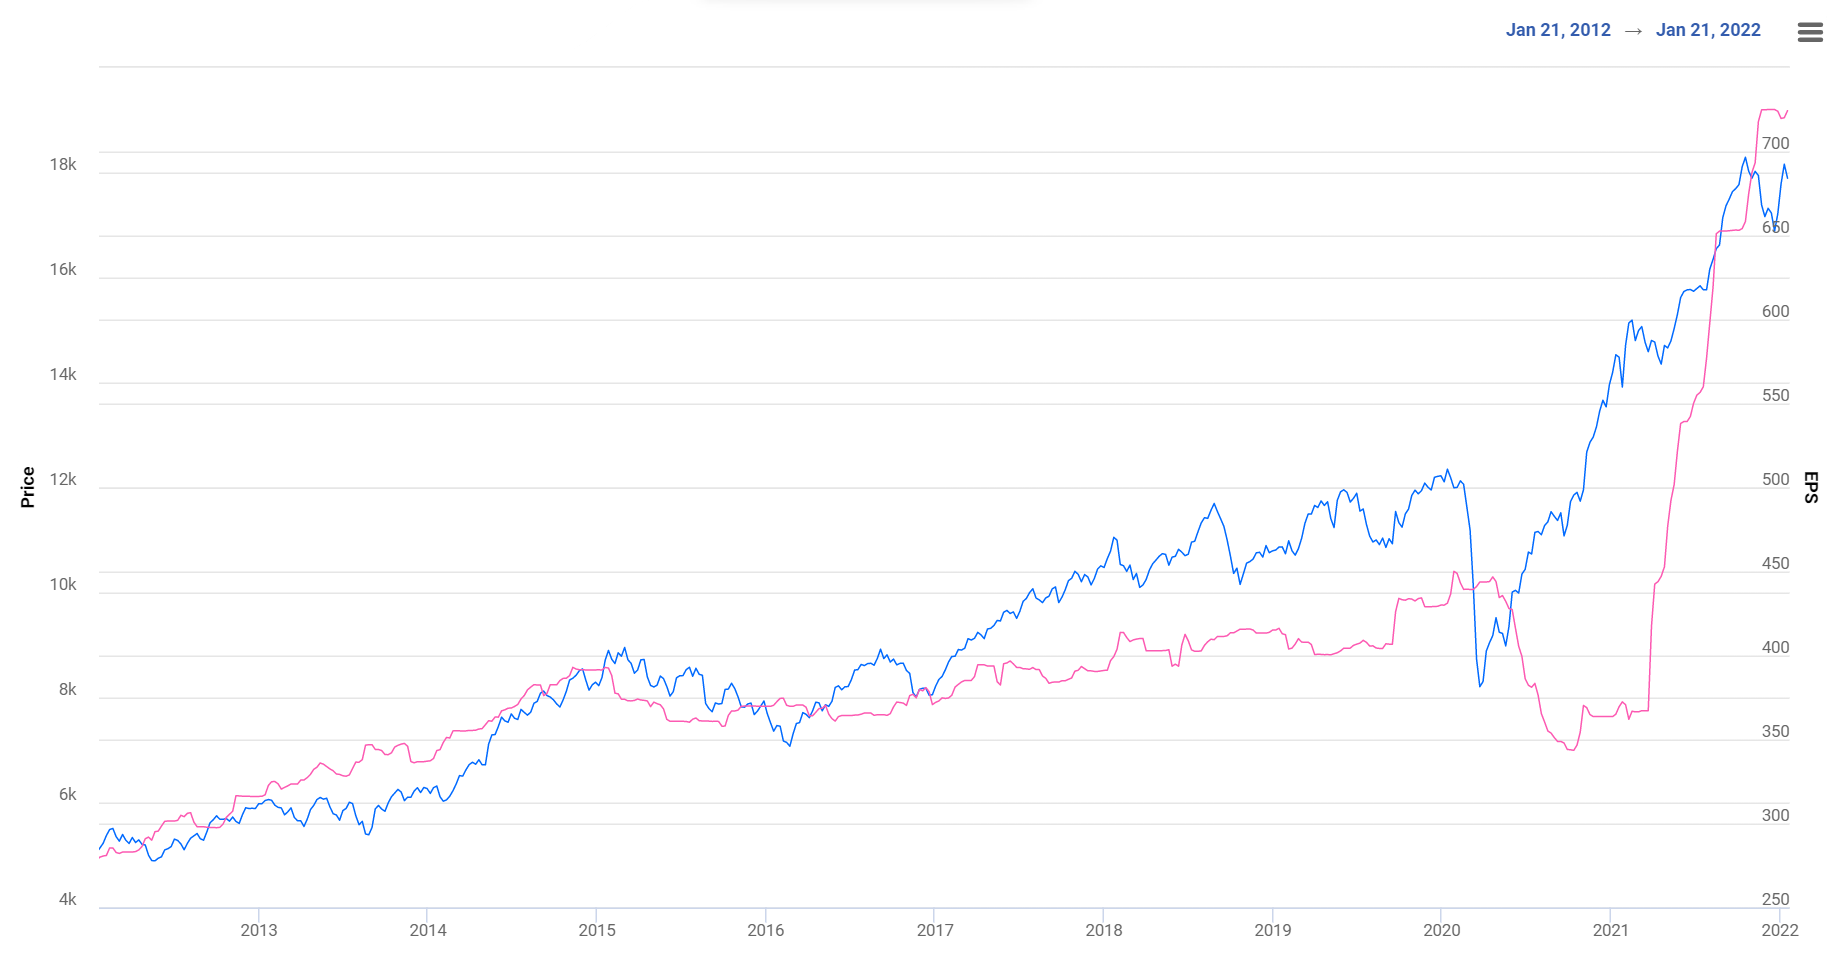
These two charts combined give the PE chart shown below
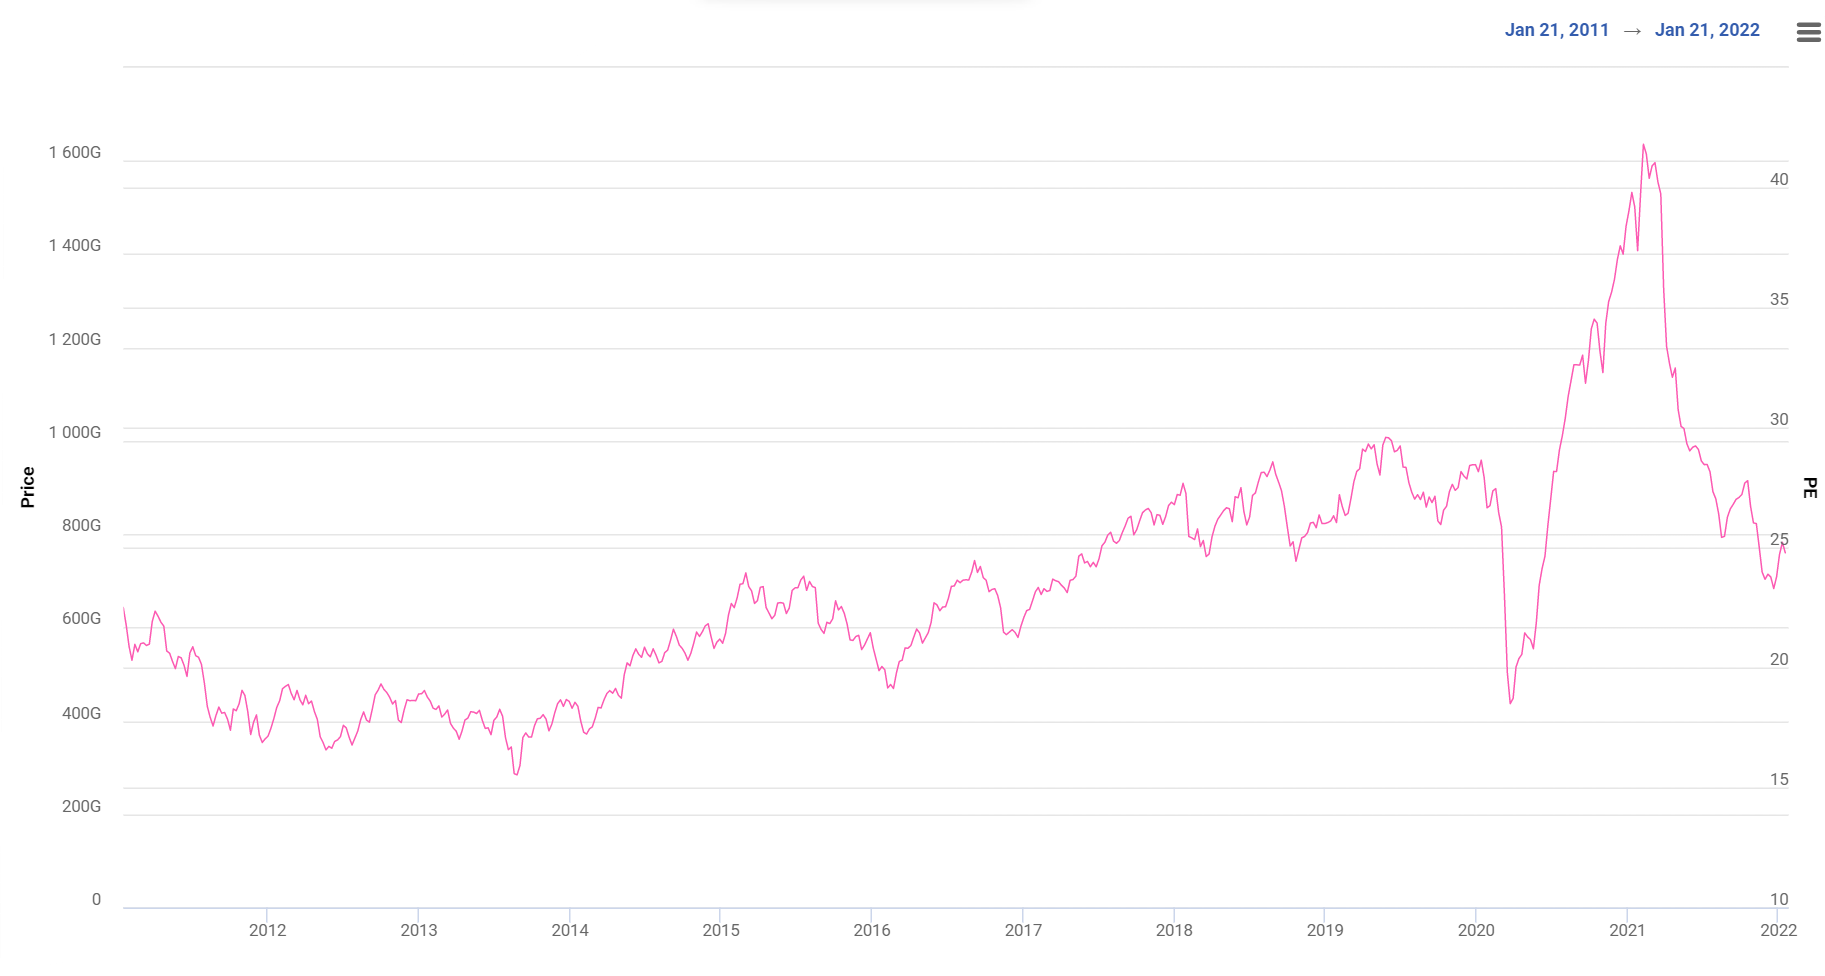
From the above graphs, it is clear that the correction from 40+ to 25 is because of the EPS catching up with Price i.e. The P increased first and the E followed later.
Looking ahead, some estimates are that EPS will touch ~900 by FY23. In such a scenario, I feel it’s unlikely that PE would drop drastically, It may hover around the current levels…
(Caveat: Prediction is a fool’s errand. This is just a gut feel)
4 Likes
The drop in PE is because of change in calculation methoda of eps from standalone to consolidated. So I think it is not right to compare it with historical values. Please correct me if I am missing something.
8 Likes
I prefer for sensex:
1 Like
You are right that’s why I prefer sensex PE , link as mentioned in my other comment
3 Likes
Everyone is discussing PE in this thread while not talking about earning growth estimation. Most of the Nifty50 cos hold concall and if one plots their earning guidance, we can see what the 1 / 2 year forward EPS will be.
Simply taking a 13% compounded growth for two years (8 to 9% estimated annual GDP growth plus 4 to 5% inflation) would give us an EPS of 925 (currently 725) by December 2024. In that sense Nifty is currently at less than 19x two year forward PE.
Now let us look at the correlation between historical GDP growth rate and Nifty50 EPS.
| Year | GDP % | Nifty50 EPS % | Nifty50 Alpha |
|---|---|---|---|
| 2010 | 8.50% | 11.61% | 3.11% |
| 2011 | 5.24% | 10.40% | 5.16% |
| 2012 | 5.46% | 14.49% | 9.04% |
| 2013 | 6.39% | 6.33% | -0.06% |
| 2014 | 7.41% | 16.37% | 8.96% |
| 2015 | 8.00% | -5.37% | -13.37% |
| 2016 | 8.26% | 0.00% | -8.26% |
| 2017 | 6.80% | 5.41% | -1.39% |
| 2018 | 6.53% | 6.15% | -0.38% |
| 2019 | 4.04% | 3.86% | -0.18% |
| 2020 | -7.25% | -16.28% | -9.03% |
One can see above that the Nifty 50 alpha has been closely correlated to inflation except during NDA2 years where some structural reforms took place, effects of which we’re seeing now.
Overall I feel 15% earnings growth in Nifty50 constituents is very much a possibility. And if you assume that and have a medium term horizon, we’re looking at 925 EPS and even at a 22 multiple, that would give us Nifty50 at 20350 by Dec 24.
Personally feel, that we will see broad based growth in the next few years.
4 Likes
While trying to check valuations of Indian markets relative to others, on PE basis, came across the below resource.
3 Likes
It makes no sense looking at PE without knowing interest rates. When my liquid fund gives me 3-4% then I will look at equities even at 25 PE so as important earning and earnings growth is, even more important is to know/guess where the interest rates are headed.
3 Likes
I shared the data point because it seems to relevant to the discussion. I agree with your POV, but at the same time looking at how India is valued relative to other markets is an important data point. Otherwise we are likely to be swayed by the home country bias. Anyways it is just one data point among many others, to help us, investors to make more informed decisions.
1 Like

Good insight
This thread used to be very active once upon a time, but has been forgotten since long.
Came across this tweet today:
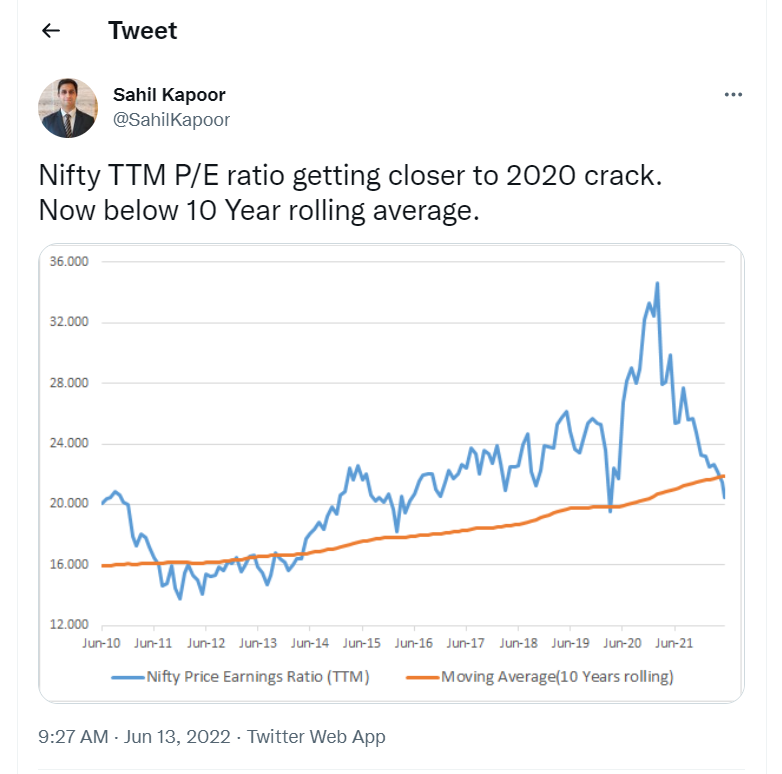
6 Likes
Any idea what would be Nifty PE if we go to 12000 levels and historically how many times we’ve gone to that level in last 2 decades !
You can use the following site to track Nifty PE ratios
5 Likes
Thanks for sharing. So major bottoms (after a real bull market, 2000, 2008 ) were made near 10-11 PE . As per this , long way to go as currently we’re at 19. Some earnings may go down in June quarter and sensex may come down - both need to work in tandem to form a bottom .
If only it were that simple. I would not say ‘this time it is different’ for a fall, but I think I will say that for the veracity of the fall, because the factors for such a rise and such a fall could be different, the macros and micros could be different. DIIs are more active today than those periods, different sectors present in indices compared to those times, at least a portion of investors know what they are doing, balance sheets are good, tax collections, GDP forecast, government incentives, rainfall etc etc are not to be excluded.
While I do agree and use numbers and charts to the extent I can, I do know that there are fundamental reasons why one stock or an index goes up. Even in the midst of indices’ falls, why some stocks rise, because there are fundamental reasons for that. One particular business makes headlines while many have halved.
So I would say, the prices may fall more, but not to the extent of the previous bear market, but could go into consolidation and remain such for months before starting the leg of the journey.
Just my thoughts for what they are worth, learning both FA and TA.
4 Likes
Appreciate and agree with your views. I tend to follow mix of indicators to understand the extent of rise/fall . Liquidity, Bitcoin, Open interest in FnOs, Currency movement ,Bonds yields etc etc , PE ratio happens to be one of the indicators. Nothing is used in isolation. Hope you understand.