
You are right. Not much difference between Nifty 50 and Nifty 500.
so what I have done is I bifurcate my capital into two parts equally…
50% goes into UTI Nifty Index Fund and
50% goes into UTI Nifty Next 50 Index fund…
top 100 companies are good enough for overall proxy of the market…
3 Likes

There is lot of noise of non inclusion of Dmart in Nifty but it will be great if someone can educate me why Pidilite is not being in Nifty.
1 Like
Below doc has the criteria Nifty follow to include in index.
2 Likes
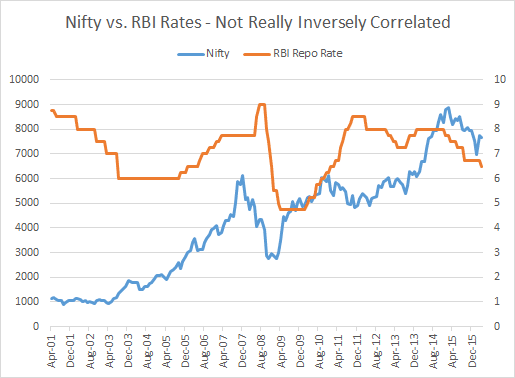
I do not have latest one but this graph is showing market bottom out when interest rates are halfway in the down cycle,
It can be seen in 2002 & 2008.
is this correlation right? or their is more to it like liquidity available in the system.
1 Like
They don’t look correlated. Try calculating the Spearman rank correlation between the two. Also, the gradients of the two curves maybe useful to plot : Bottoming out = local minima.
interest rates are halfway in the down cycle
How can you know in advance if you are halfway in the down cycle? So it’s not really an actionable metric for making decisions.
I have found Bank FD rates as an intuitive metric, so maybe that’s something worth checking. They can be a leading indicator for market topping out - but not done a proper study.
I maintain similar charts on Bajaar - Indicators.
5 Likes
Adding to what @vml has said above, traditionally Indian stock markets have risen during a rate hike cycle. You can see this in your chart during the period 2005-08 and later during 2013-15. Post 2015, markets fell despite falling interest rates. During the rate hike cycle from 2009-12, markets first rose and then fell, to end flat. On longer period durations, markets have risen more often than not during rate hikes. The article given below quotes an NSE study which says that markets have given a median return of 24.6 % across eight rate hike cycles.
https://www.forbes.com/advisor/in/investing/how-interest-rates-affect-stock-market/
According to me, the reason for this (apparent anomaly) is that our markets have traditionally been dominated by FII flows, which are sensitive to currency risk, especially when investing in emerging markets. Rate hikes strengthen the local currency and provide comfort to foreign money to come in.
The current rate hike cycle is more an exception to this, as it has coincided with rate hikes globally, leading to fund outflows. Thus, we should avoid generalizations since every situation is unique and market movements are influenced by several factors besides interest rates.
7 Likes
An interesting article on the Benner cycle where a farmer predicted business cycles with high accuracy : How The Benner Cycle Predicts 100+ Years of Market Movement
1 Like
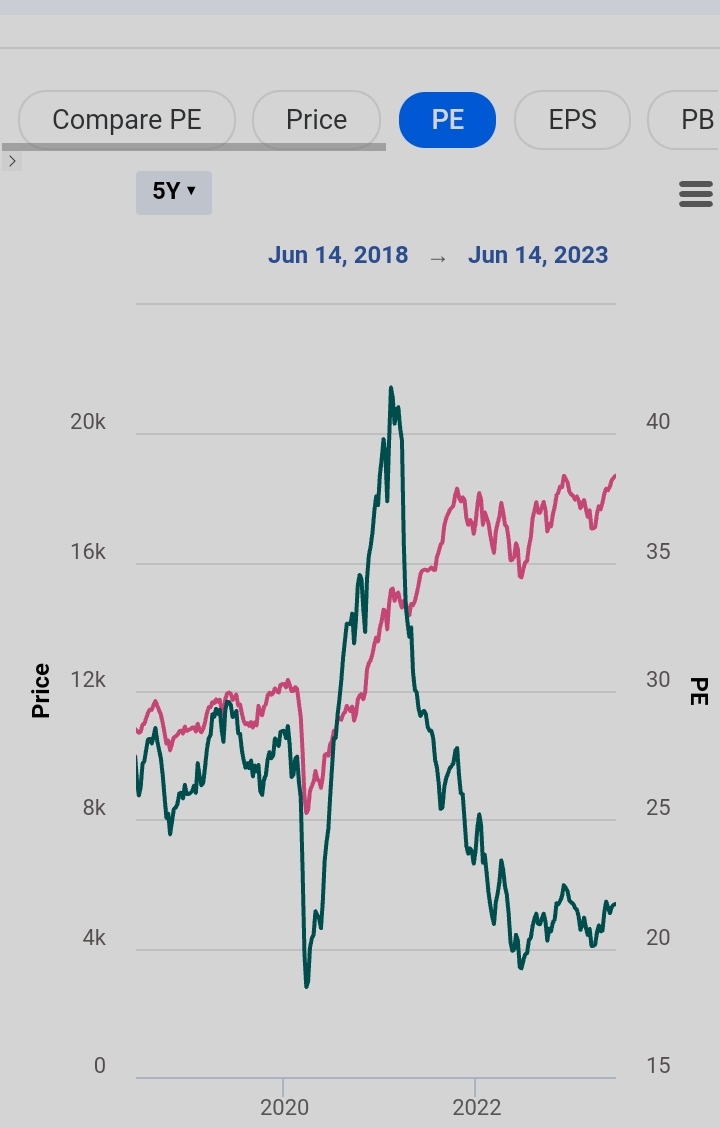
An old active thread I thought to revive as Nifty is near all time high. The question is will it boom past. Nifty PE wise it is not over heated and around 20-21 range as per trendlyne
Considering smallcap and midcap indexes already moving up, can we consider it is a good time for investors
2 Likes
Market moves of different indices. Views from Nooresh
1 Like
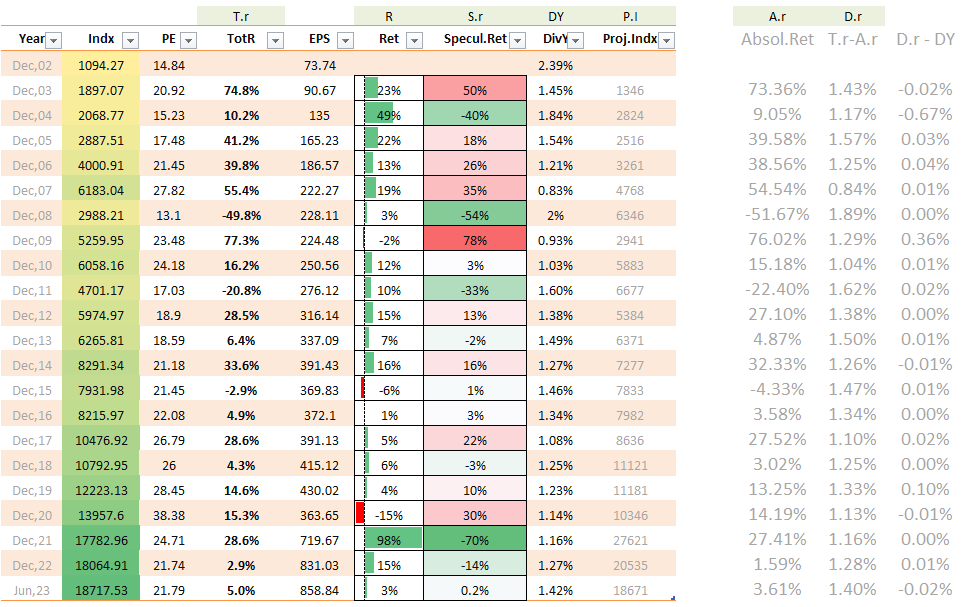
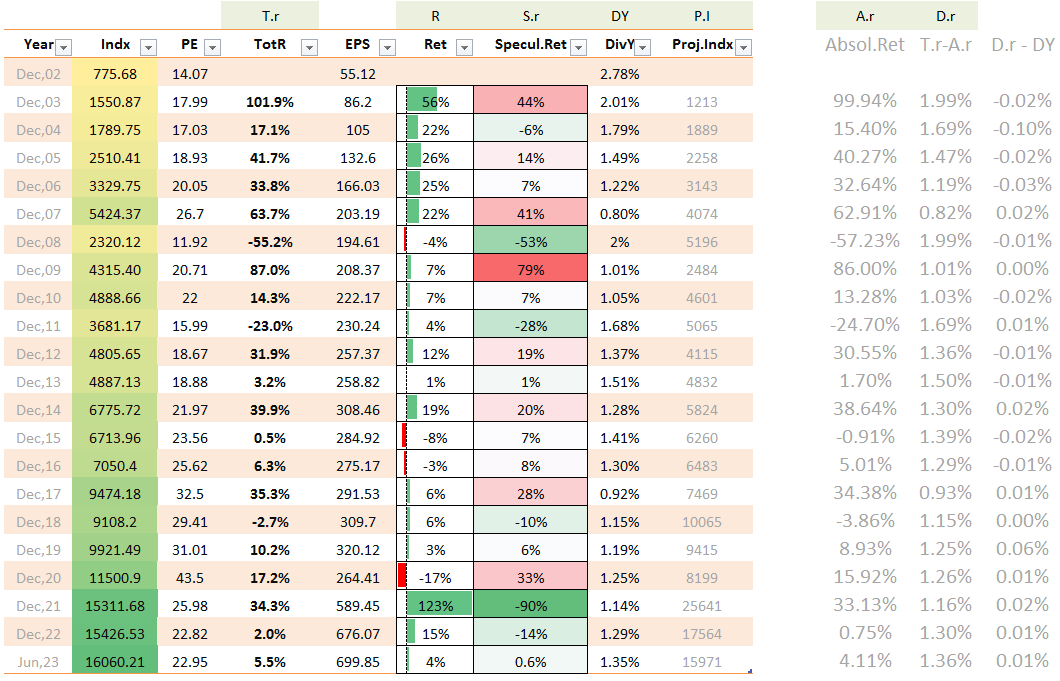
Paragh Parikh model from 'Value Investing … ’ Book.
Chapter 2. Please consult that volume for interpretation and methodology.
{Dont want to mis-phrase, mis-interpret or repeat it here}
Data is from Trendlyne chart points.
Errors, if any, will be mine.
~~ Subjective opinion ~~
Hardly any speculative return so far. Time correction/consolidation underway. If there’s no external-events markets seem to be poised for growth ahead. Good reason to hold on.
~~ ~~ ~~ ~~ ~~ ~~ ~~ ~~
Nifty 50
^^^^^^^^^^^^^^^^^^^^^^^^^^^^^^^^^^^^^^^^^^^^^^^^^^^^^^^^^^^^^^^
Nifty 500
4 Likes
3 Likes
How often is the EPS component updated in the NIfty P/E, P/B and Dividend Yield Data available on NSE? Is there any methodology document for their calculation of the P/E ratio that is available?
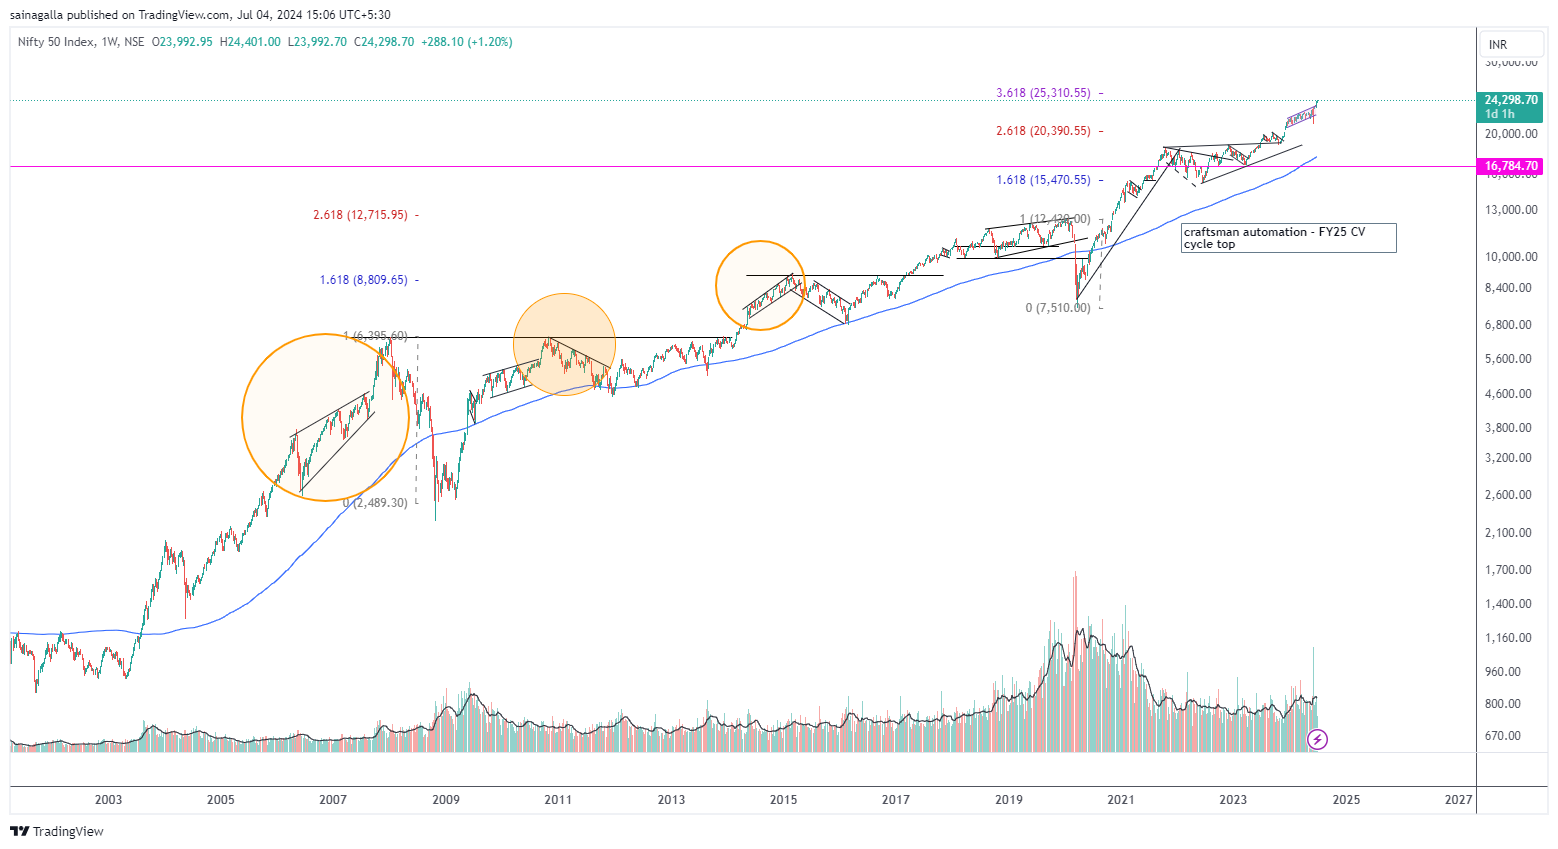
Nifty is either about to enter mania phase or already topped. I am leaning towards former as Nifty has a breakout from upward trending channel. Confluence of factors suggest a minimum of 25300, but could go much higher as well. But once this rally ends, its going to be a big down market event akin to 2007, 2010, 2015
3 Likes
Historical P/E Ratio Trends
-
December 2019**: Just before the COVID-19 pandemic, the Nifty 50 P/E ratio was at 28.
-
May 2019**: The Nifty 50 reached its peak P/E ratio of 29.7.
-
Last 10 Years**: Historically, the Nifty 50 has seen peak P/E ratios around 29 and troughs typically around 21-22.
*Current P/E Ratio
-
Current P/E Ratio**: As of today, the Nifty 50 P/E ratio is 23.
-
Current Nifty 50 Level: The index is trading at 24,380.
Given the current P/E of 23, the Nifty 50 appears to be trading below its historical peak P/E ratios. This suggests that there could be potential for further upward movement in the index, possibly up to around the 30,700 level (24,380 * 1.26), as it approaches historical peak valuations. However, it’s important for investors to consider other factors such as market conditions, economic indicators, and company earnings before making investment decisions.
10 Likes
Over the long term 2000 -2024, the Nifty PE ratio is between 17-20. By that measure currently, it is slightly on the expensive side.
1 Like
From 1st April 2021, nifty pe was calculated on consolidated profits instead of standalone.
8 Likes
Before quoting such old posts, it is better to check if the member is active or not. The member has not been active for more than 4 years.
He may become active after this reply, but if he doesn’t, then the act of sharing your views is as good as communicating into deep space or in a forest. We get no reply.
1 Like
Reading this thread after many years. This is a goldmine and I think others could benefit by reading this too.
1 Like