Thanks. Quiet a lot of the returns are due to sectoral allocations and commodity/cyclical positions. Of course, a lot of very long term stocks have done very well too. And we must thank the market for it.
Also, avoidance of certain sectors like pharma/IT in last 2 years aided a lot.
I always say, 2 things are important in investing and outperformance.
Knowing where to invest
Knowing where not to invest (this is something which many investors don’t give enough thought to)
Sorry, you won’t be 1/3rd as successful as WB by earning 1/3rd CAGR as WB. If you and WB start with Rs 10,000, and you and WB earn 7% and 21% CAGR respectively, guess how much you will have at the end of 30 years? You - Rs 76,122. WB - Rs 30,44,816.
I knew that was coming :). Yes, that’s a fact. To clarify, in the current
environment I am happy with 7% in the current cycle, right now. Will
allocate back into stocks when the time is right.
@sandeeprawat thanks for sharing such info. However, do you have any info regarding the p/b ratio around the same period? I am not much of a technical guy but I was talking to a friend of mine once and he said unless the p/b ratio goes above 4-5 the chances of a big fall are less.
In this huge ocean of information would love to receive some info regarding the above opinion of my friend.
It is very difficult to place any faith in the PB ratio… it is determined by what are the index constituents of the time… if the index constituents are banks you will see a different story and if they were changed to manufacturing then we would see a different story.
So, as I was asked by a friend and I will reproduce here… he said, what is the value of the PE ratio…
I told him, think you are buying a business. The owner of the business advises you that he makes a profit of 1 lac rupees. Now from this profit, the business owner decides how much to take home (dividend) and how much to keep in the business (retained) but his selling price of the business today is 25 lacs for something that makes 1 lac a year. Does it seem reasonable? Are you willing to buy it?
Now, then as is the market, we come around to low pe, roce, roe and so many more complications…
If one kept it simple… the chart shows most of the times are buying opportunities and 3-4 times a decade are selling opportunities.
Thats an interesting question and I never checked that before but I would still say, it is just like p/b ratio; any ratio when mixed with another ratio can show something else and that’s how markets get overvalued. I still like the old… kitna paise dene padenge and kitna paisa kamaai hogi?
PEG RATIO depends on accurate prediction of growth. Last 3 years there is only 2% growth in EPS after predicting 10-15% growth. So trailing PE is better to build a model for entry exit.
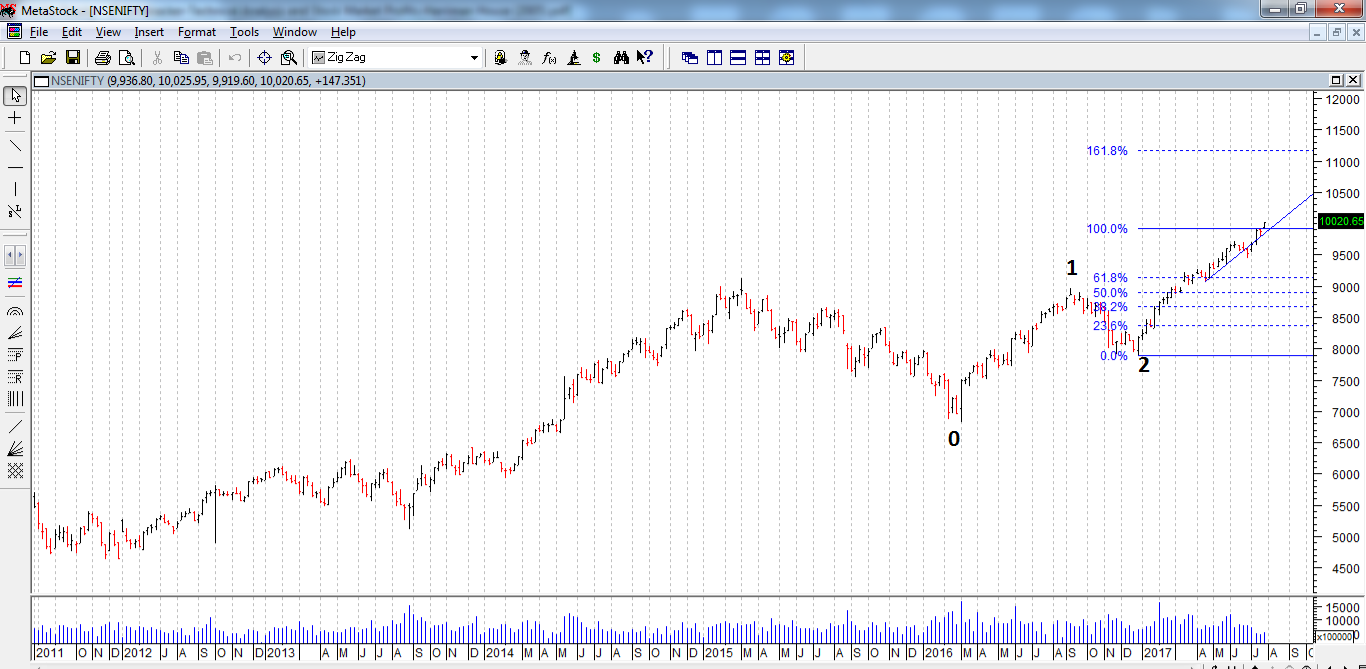
I have been reading about the works of elliott of late and reading always helps to broaden your thought process ( even if you dont agree at that moment in time). Basically he hypothesized that rallies and corrections move in 8 wave patterns. With a 5 wave upmove and 3 wave downmove. In the 5 wave upmove there are 2 waves that are corrections - wave 2 and wave 4. After the 5th wave finishes we become due for a 3 wave downmove that is bigger than the 2nd or the 4th wave of the 5 wave upmove.
There are some rules to wave counting that one can google but the most interesting one is that wave 3 ( of the 5 wave upmove ) is never ever the shortest wave and is most frequently the longest move and is usually 162% the size of wave 1. If by chance it exceeds the 162% level then we have something called a wave extension which takes wave 3 even higher ( how much higher is any ones guess ).
At todays levels - NIFTY has just done 100% of wave 1 and is expected to do 161.8% of wave 1 according to the theory.
According to the theory - the 5th move will be 38% or 62% of the distance from point 0 to the end of wave 3 or it will be equal to wave 1 ( i.e 100% of wave 1 ).
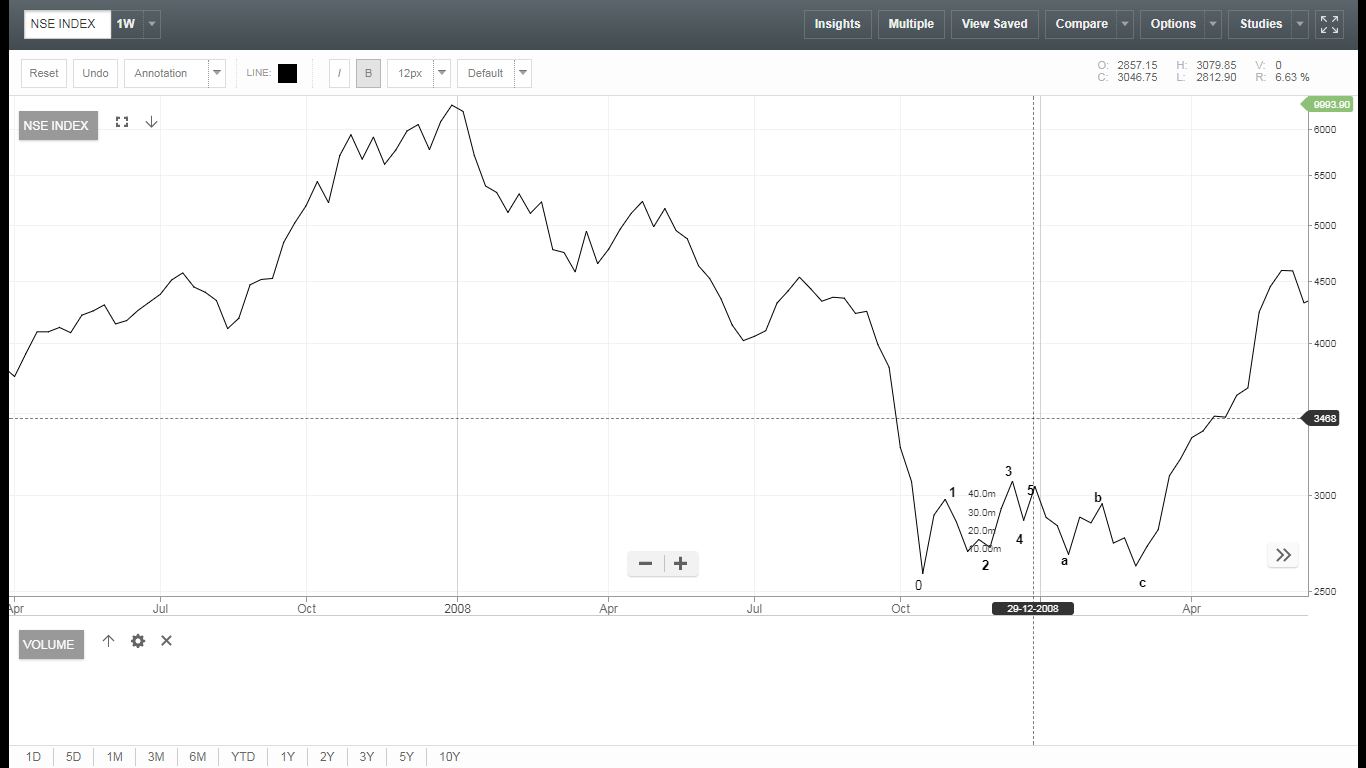
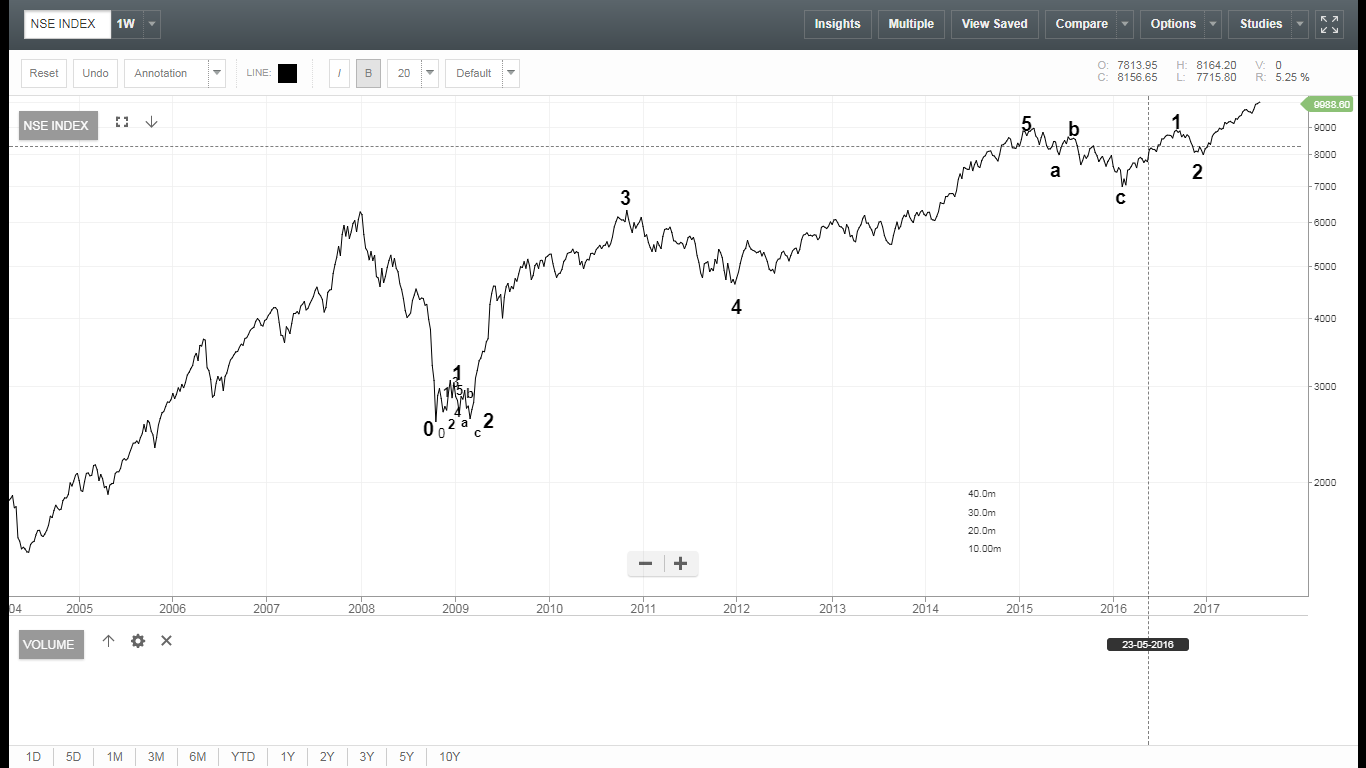
Thats one of the big drawbacks of elliott theory. Wave counting is very subjective and those with experience in market cycles are probably more adept at defining where one wave starts and one begins. Though i am certainly far from being an expert, i would like to think that Oct 2008 to March 2009 was the bottom formation and in my opinion it certainly adhered to the elliott wave counting rules. Here is the wave count from that period as i see it ( pls note this is all great in hindsight - so serious hindsight bias at work here!)
Obviously a small shift of numbers here & there would easily mean that we are in wave 5 and a correction that is greater than than wave 2 or 4 is in the offing. But i would like to think ( obviously ), that this is the true count.
I would certainly like to see how all this pans out. Wave 3 - good times ahead. Wave 5 - time to be cautious. Which one is it?
I ve done an analysis based on the data available in the NSE website for the bull market of 2003-2008. Hope this will help to identify the peaks and troughs.
The charts are attached. 2003 bull market started when the accumulation level in a williams accumulation / distribution charts crossed the previous highs of accumulation levels of 2000 mkt highs. The bull market florishes and accumulation levels are also going in tandem with the market till late 2007.
In late 2007 ,nifty accumulation lvls flattens despite huge rally in markets. I think that is an indication of top. Also in dec 2007 and jan 2008 nifty PE exceeded 27 lvls and reached a top of 28+ lvls.
Also pls see another analysis. I took the monthly advances and declines from NSE site. Then I did a mclallen oscilator and a summation index.From Jan 2006 onwards the summation index starts declining despite huge rally. there is huge divergence in summation index and nifty from 2006-late 2007. ie decling stocks are outnumbering advancing stocks despite huge market rally. I think it is caused by the exiting of fund houses from microcap , small cap and midcaps and entering largecaps to make their funds safe. During this time nifty 500 starts underperforming nifty50. This can be seen from running a relative strength (I did a 20 dma of RS) charts. If the Mclallen Summation Index and Nifty broader markets are showing huge divergence we can assume that we are in the last phase of the rally. Then towards the end of the rally, as markets is rallying like rocket, the frustrated retail investors who had been leftout of the majority of the rally will come to markets and they willl jump on all micro, small cap and junk stocks resulting in a sudden spike of advancing stocks outnumbering declining ones. I think that is the sign of a top nearing. its the time to exit from the markets and one can enter in small qty of call options if he/she wants to encash further rallies if any.
In the accumulation/ distribution charts, one can easly see accumulation lvls again rising above 2008 high lvls in 2009 begining when the markets was still languishing in sub 3000 lvls. at such a point one can nose dive into the market when valuations are dirt cheap. During a bear market final phases all the retails will sell their position in deseration and these will be accumulated by smart and strong hands. this can be easly seen and understood from accumulation/distribution charts.
I think Accumulation distribution charts are the sigle best and strongest tools for market timing for entry and exits.william accdis.xls (805.5 KB) advdec monthly.xlsx (52.1 KB) RS N50VsN500.xlsx (451.9 KB)
Thanks for the analysis Joe…will it be possible to map this Aug 2013-2017 period…My 2 cents is that Nifty PB was 8+ in Jan 2008 while now its 3.5 some, mostly due to built in capabity over the years…also the run up between 8k-10k nifty is hardly comparble to the ferocity of the aug 2007-jan 2008 run up- 28 pe/8 PB back then, if i recall. also there were 2-3, 15% and one 30% (may-jun 06) fall…i think the last 3 years have been more measued than anythng…but wud look fwd to ur analysis…am on 25% cash levels across portfolios
@sanketkulkarni1987 you should try ratestar.in for stocks and just somewhere above I posted a link for the nifty PE ratio as a chart. Ratestar shows the PE ratio historically for each stock. It also shows the points when good results are declared for a company and the PE falls overnight, then it rises up to it’s current PE ratio as per the market weather.
We are not even close to most high quality investors in India itself. So yes, maybe WB can pull off a market bashing performance with a smaller portfolio. We in all honesty might not be able to do the same. I always try to think in a 30 year period and then take a call, not on my results of 2-3-6 years. WB has beaten nearly everyone in the world. It might be a dangerous comparison
@valuestudent
Thanks for your response. If I appeared to be hinting that getting WB kind of returns was easy, that was not what I intended. 26% in US markets over an extended period and a large PF is phenomenal and it does not require any further confirmation from anyone, least of all, from an investing newbie like me,
Some of us have seen stellar returns over the last 2-3 years (not me, unfortunately, as I wasn’t invested enough ). Earning in good times has been relatively easier for retail investors. The most difficult part (at least to me) has been when to exit in bad times to limit losses and when to be back in the market to not miss the gains. I take the help of charts to determine the approximate peaks and troughs. Nice in theory, will know its efficacy in the next bear phase.
Let me assure you that is not what I read. It did not seem you were hinting at that at all. In fact, if my language was not clear, I should be apologizing for it.
I just said it in the spirit of discussing ideas and that’s it, in fact you seemed very aware that this is a risky time to invest.
I can confidently tell you that the markets give a chance every one year or so and missing gains is not forever. We only supply the patience to not invest when we have cash and to invest when “all the stars” align. Fundamental stars and market trend and possibility stars.
On exits, the only possible time to exit are good times and best possible times to buy are bad times. Nearest example was demonetization. The logic of investing was again forgotten and everyone thought this is going to end badly. Thats the time to buy.
Happy investing! You are on the right track. Profits will naturally follow.

 ). Earning in good times has been relatively easier for retail investors. The most difficult part (at least to me) has been when to exit in bad times to limit losses and when to be back in the market to not miss the gains. I take the help of charts to determine the approximate peaks and troughs. Nice in theory, will know its efficacy in the next bear phase.