
Wanted to share my updated understanding of Neuland Labs. Up front apologize for the very long read. This post has been months in the making (please see Raw data sources section point 1 for why its been months in making). ![]() This is largely based on reading even more concalls, more ARs and also looking at Neuland DMF filings and Neuland Process patents.
This is largely based on reading even more concalls, more ARs and also looking at Neuland DMF filings and Neuland Process patents.
The story of neuland can be understood in six broad strokes:
- The change in business/product mix (Q).
- The competitive advantage or the part of the business which makes it differentiated (Q)
- The quality of the management (Q)
- The growth in the underlying business (G)
- The longevity of the business and the growth (L)
- The valuation of the company (P)
In this post, i only spend time on the first 3 (quality) because in my opinion that part is most difficult to understand and requires a lot of reading.
The change in business/product mix (Q)
Neuland used to sell only Prime segment APIs (these are mature APIs, have been around for lot of time and have many competitors) in the beginning. Business mix is changing with low volume high value specialty APIs and CMS (CDMO) segment revenues rising. This is shown in graphs below:
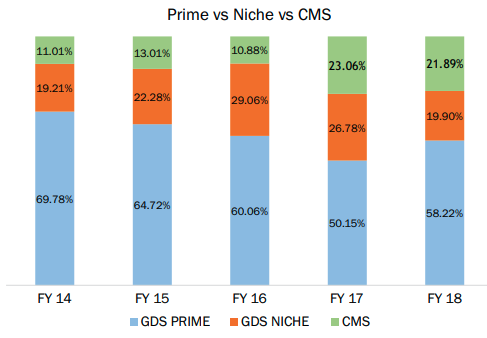
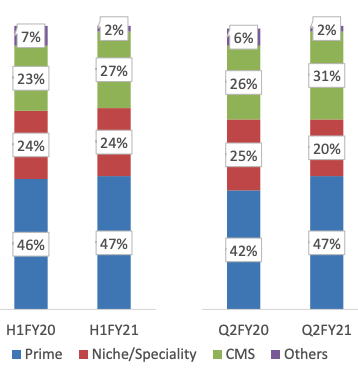
Prime revenues used to be 70% in 2014 and CMS used to be 11%. In Q2FY21 it is 47% for prime and 31% for CMS. This causes an expansion in margin.
The next level of research I did is to go through the USDMF filings to understand the complexity of the APIs for which Neuland is filing DMFs. https://pubchem.ncbi.nlm.nih.gov/ has very good data on many aspects of each chemical including APIs and intermediates. That has a section on complexity of the molecule which is computed using the Cactvs model. I have plotted these as a function vs time. The molecules for which DMFs have not been filed yet were randomly distributed to occur once every 4 months (assuming 3 DMFs every year) to obtain following graph:
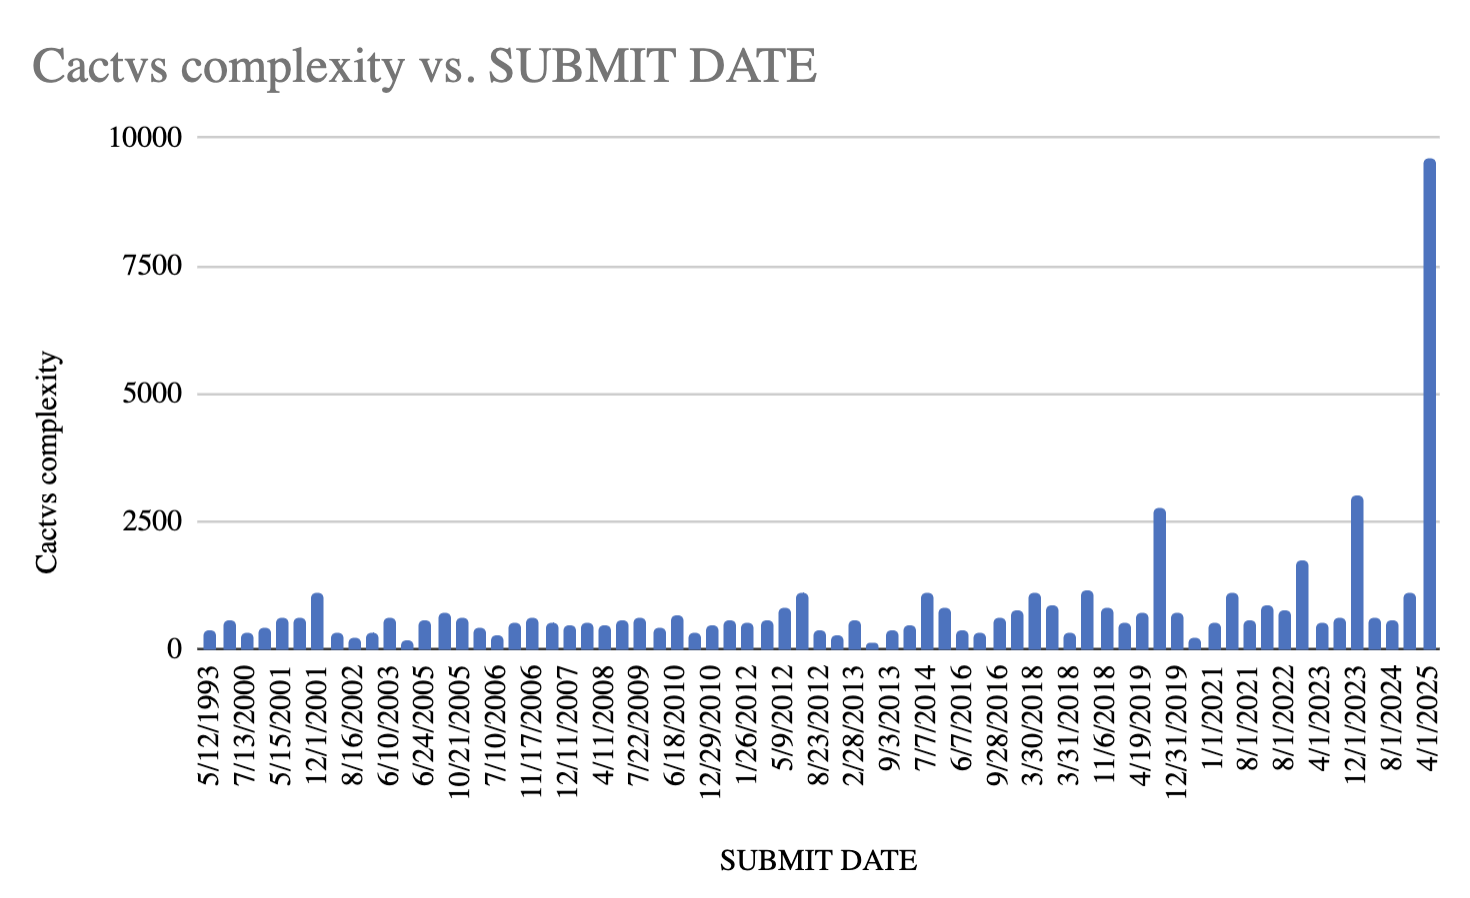
One can clearly observe that the complexity of the molecules for which DMFs are being filed is increasing over time. This serves as a further validation of the narrative of changing business mix towards more complex, high value APIs.
The competitive advantage or the part of the business which makes it differentiated (Q)
- Neuland has been aggressively investing in building the right workforce. While sales only increased 14% from FY19 to FY20, number of scientists working for neuland increased 40% YoY from 200 to 282.
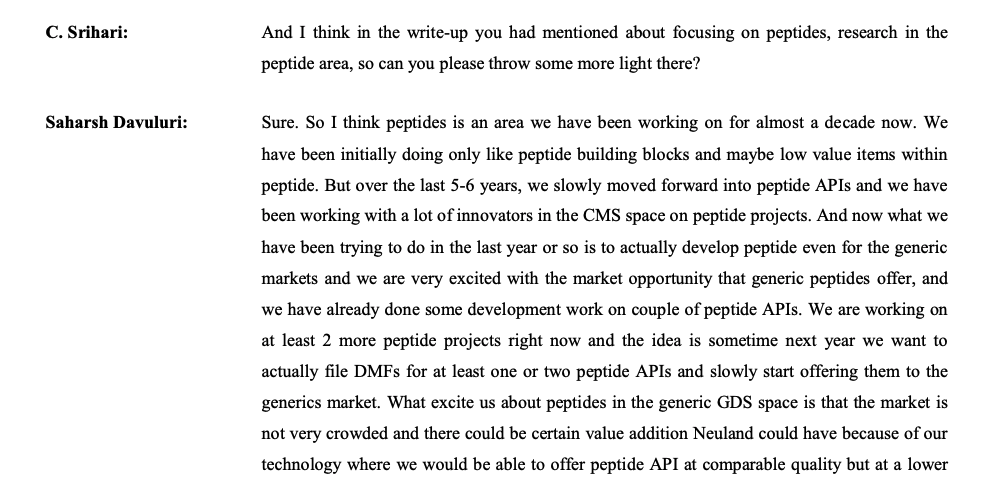
- One of the best primary sources on Neuland’s competitive advantages is the brochure they have on their website. Neuland Labs has published peer reviewed article on PharmTech sharing a newly developed strategy to increase sample loading for peptides 12 fold compared to conventional Prep-HPLC techniques. High quality Science & Research is certainly not the hallmark of a commodity. Neuland has been investing into this space for over a decade. Imagine the scientific leverage which is building up here.
- Even among the output (API) is commodity-like (prime APIs), a scientific organization finds ways to build a competitive edge. Operating leverage and scale advantages are benefits that any and every company would apply. But neuland has gone ahead and filed multiple Process patents for these APIs. These process patents demonstrate their appetite for applying their research acumen to improve the manufacturing processes and drive efficiencies:
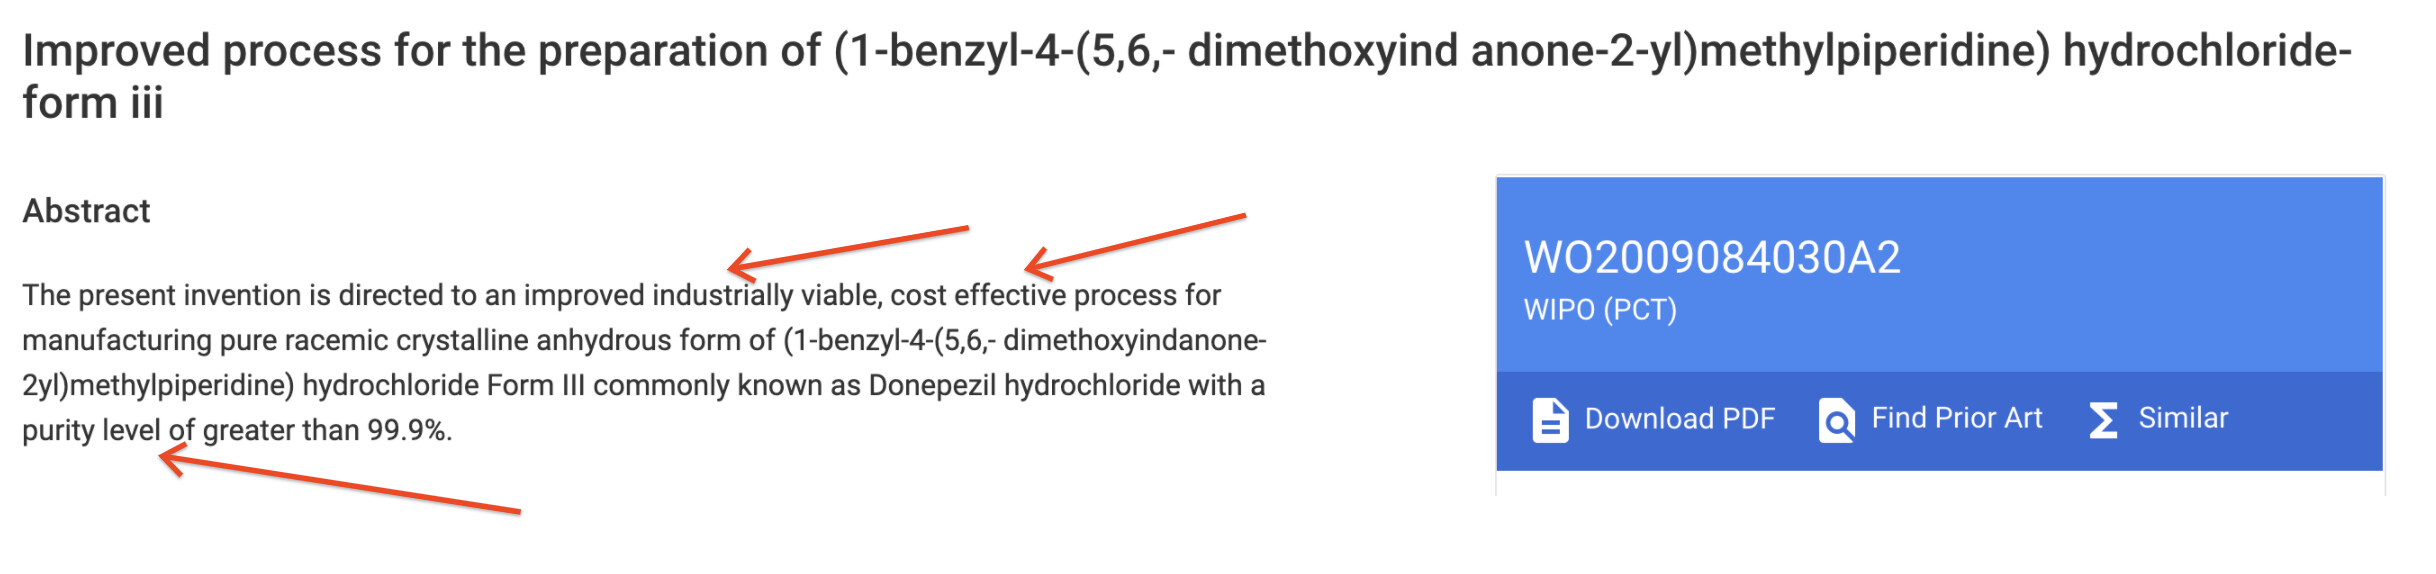
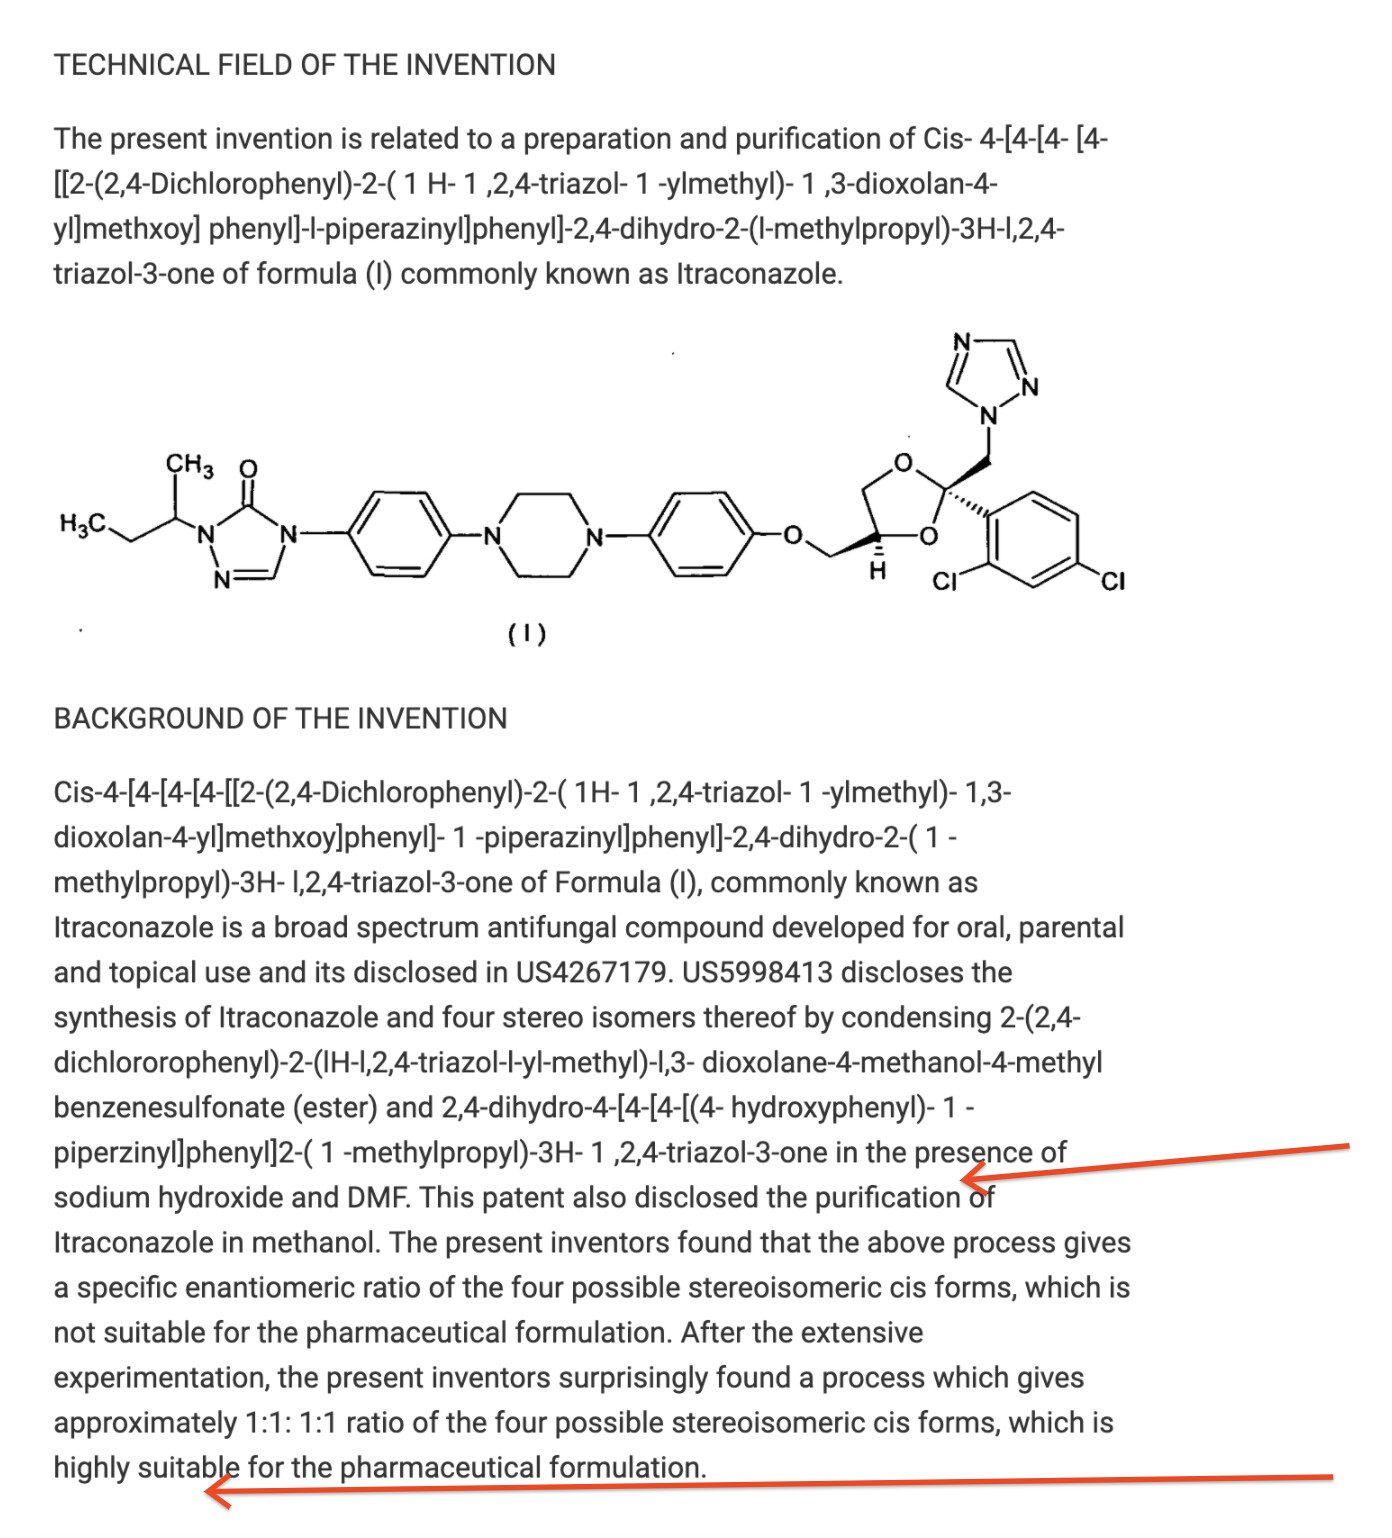
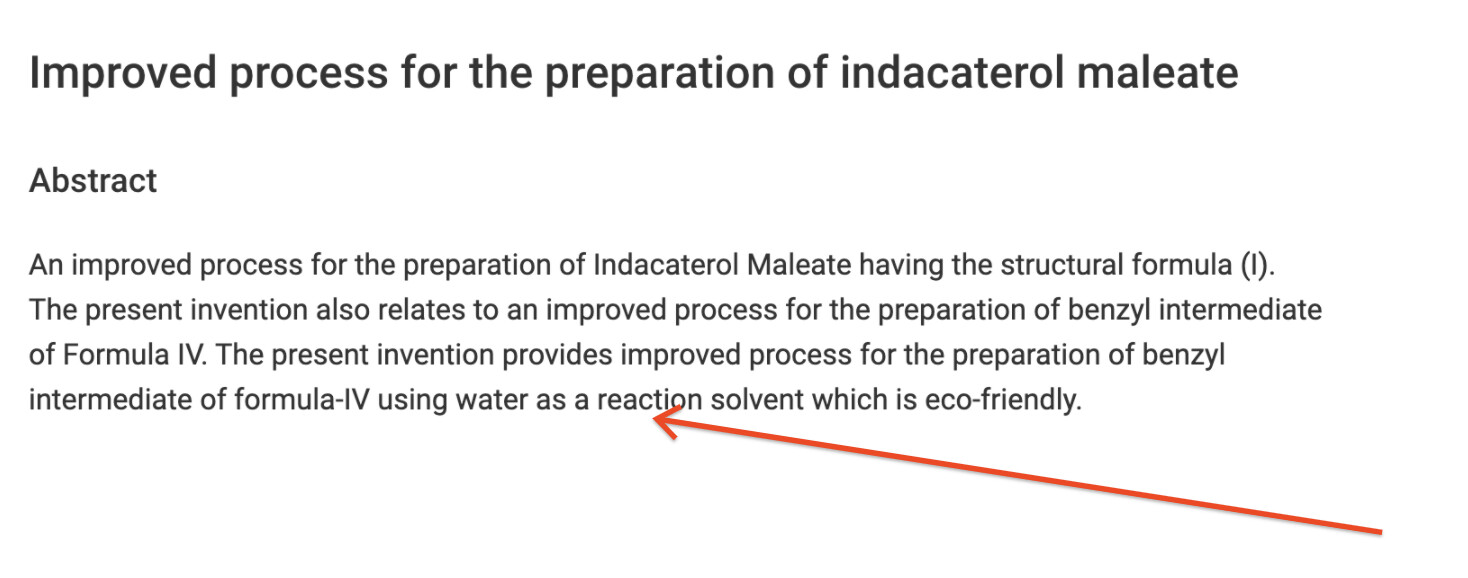
“Industrially viable”, “cost effective”, “high purity”, “easy handling”, “eco friendly” are words we see repeatedly in the patents.
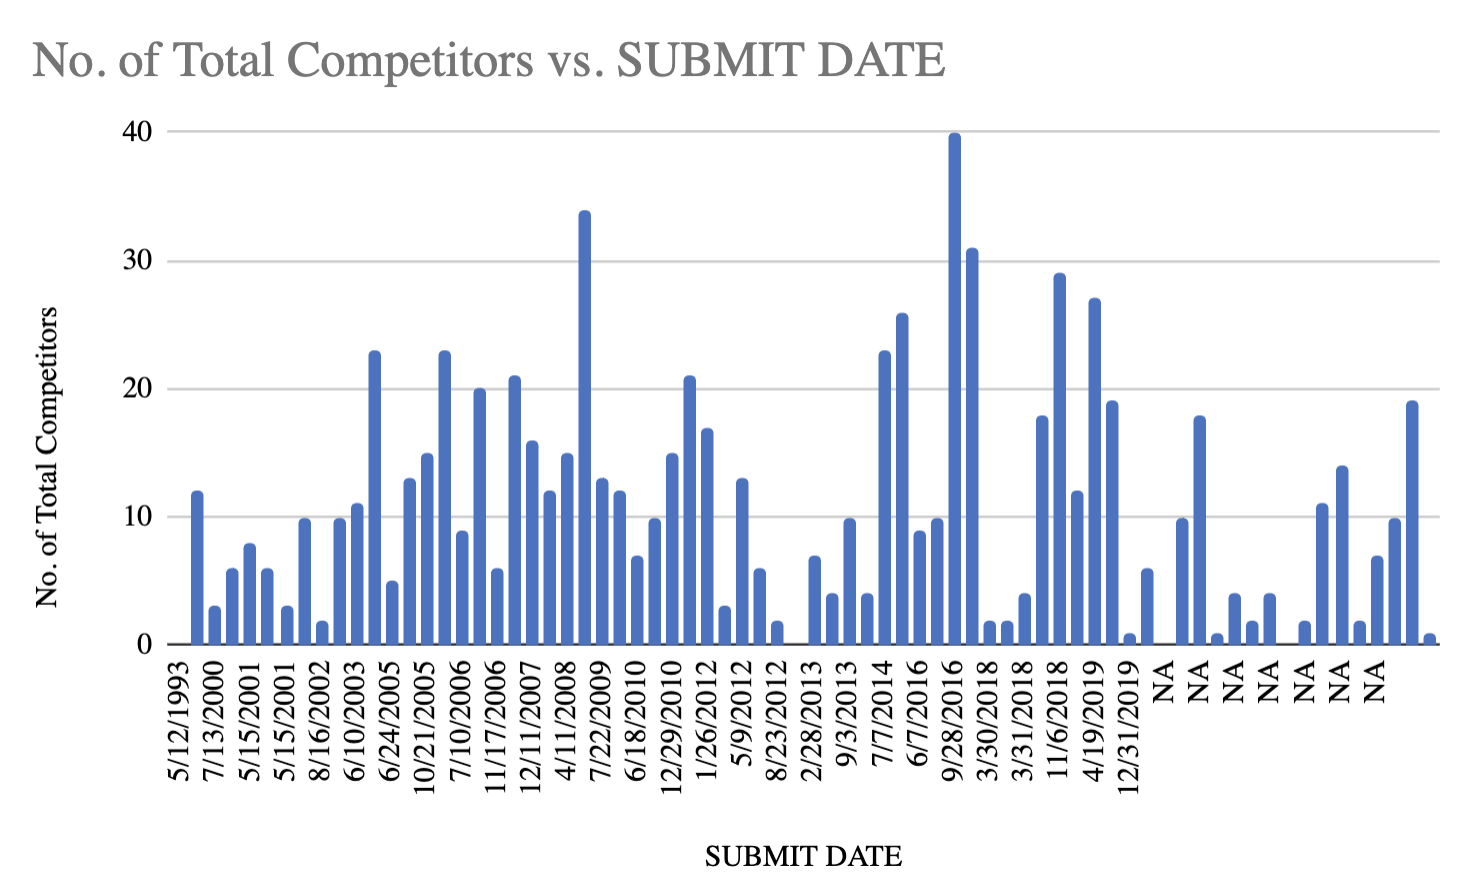
4. The newer DMFs have much fewer competitors. The ones with NA date, DMF has not been filed yet. Meaning that these are yet to come in the future. There is an element of time bias here but we can still see that newer molecules definitely have much fewer competitors than older ones:
The quality of the management (Q)
The business suffered two severe down years in FY18 and FY19. A key part of how I judge managements is how they communicate in down years. Both these annual reports are a treat to read.
From the FY19 Annual report:
From the FY18 Annual report:
Every time the business underperformed, the management clearly outlined the problem, talked about concrete remedial steps and one can see them walk the talk as well through the various concalls. As i have outlined in previous posts, management has been very conservative in giving growth guidance which is another thing I like about the management. This is unlike many other API players who guide for 25% growth to come for many years. Another aspect of the management which i find appreciable is the compliance culture they have build at Neuland. In 30+ years of operations, they have been audited 30+ times by USFDA and have not had any warning letters. The compliance track record and culture itself is a huge competitive advantage for Neuland. Management has talked about how they conduct mock USFDA drills in order to maintain this trackrecord.
Open Questions/Risks
There are several things I still do not understand about the business. As per Warren buffet, risk comes from not knowing a business. To that extent these represent the risks in the business:
- Looking at our 70 odd API molecules portfolio that we work on, why do we continue to file USDMF for APIs with 15-20 global competitors (eg: Sugammadex Sodium, Ticagrelor, apremilast, posaconazole) even after 2018? These APIs seem like the ones where competitive intensity is high and we should understand whether neuland has any unique or competitive advantages in manufacturing these molecules that lead us to filing these USDMFs.
- Given that our CMS portfolio has much higher profitability and margins, why do we not spend all incremental capital on CMS business? Is it due to a limited demand for the capabilities or some other reason? We understand the business viewpoint of continuity for all existing molecules, but why do we continue to deploy capital into newer prime or speciality APIs which have higher competitive intensity and lower profitability?
- We suffered loss of production in Q42018 and 2019 due to raw material shortages due to supply disruption from China. If the same issues were to repeat today, how much would our topline or bottomline suffer? Trying to get a sense for the extent to which this risk has now been mitigated with the strategic backward integrations, geographical multi-sourcing and fungible capacities.
Caveats
I have not analyzed market share size for molecules and molecule pipeline. I find these exercises not that useful. Look at this HDFC securities 2018 research report for Neuland. I quote: “Beyond two year time line, there are many lucrative API opportunities where NLL is working on. This list includes Sugammadex, Paliperidone, Posaconazole, Deferasirox, Dabigatran, Lurasidone and Bosentan. Some of these molecules are low volume products but could add meaningfully on EBITDA line”. Sugammadex today has 19 competitors. I do not think anyone has much skill in predicting market shares for molecules since we absolutely do not know how competitors pipelines would evolve.
Raw data sources
- Here is the Neuland DMF Analysis google sheet. Thanks to @YachnaBhatia for the idea of setting this up and also helping populate a large part of this sheet. Rows marked in green represent molecules which we found to be interesting.
- The data in this sheet is in turn derived from raw USDMF data.
- Neuland brochure has a lot of good info on sources of competitive advantages.
- The almost infinite number of articles on Neuland’s website which help clarify their business.
- https://pubchem.ncbi.nlm.nih.gov/ which contains good data on each chemical molecule.
- Company investor documents like AR, Investor presentation, Concalls.
Disc: Invested. Full PF here.