ORIENT BELL
#Management
Key Management Team (2024): Madhur Daga, Managing Director Overseeing strategic direction since 2018, Madhur Daga succeeded his father, Mahendra Kumar Daga. He has been instrumental in driving professionalization and growth, emphasizing leadership by qualified professionals.
Aditya Gupta, Chief Executive Officer With 33+ years of experience in leading companies like United Spirits (Diageo), Bharti Airtel, Reliance Communications, and the Tata Group, Aditya Gupta joined as CEO. He is an IIT Mumbai alumnus with a PGDM from IIM Bangalore, known for driving revenue growth and operational excellence.
Anil Agarwal, Chief Operations Officer Brings 37+ years of ceramics industry experience, previously with Somany Ceramics and Vrundavan Ceramics.
Himanshu Jindal, Chief Financial Officer With 22+ years in finance roles at Heidelberg Cement, Cipla, Cargill, Pfizer, and Den Networks, he has maintained strong financial discipline, ensuring a robust balance sheet and efficient cash conversion.
Companies management takes a long term approach, they are ready to take short term pain for long term gain.
today if you add back their marketing spend in profit, company is available at 10-11 PE, their cash flows are quite good and cash conversion cycle improved drastically in last five years. I am not able to do financial modeling in orient, there are lots of moving parts in it.
I am betting on valuations and management.
One more positive thing in the company we can look at is their gross margins against other large competitors.
Orient bell
THESIS-
Orient Bell Ltd has done well in keeping control over its working capital and in generating good cash flows.The strong balance sheet and healthy cash flows, limit the possibility of any mishaps.
Company has tried to focus on delivering an online sales experience to prospective customers through their website, adding features such as virtual visualisation, budget estimation, tile selection, and online ordering.
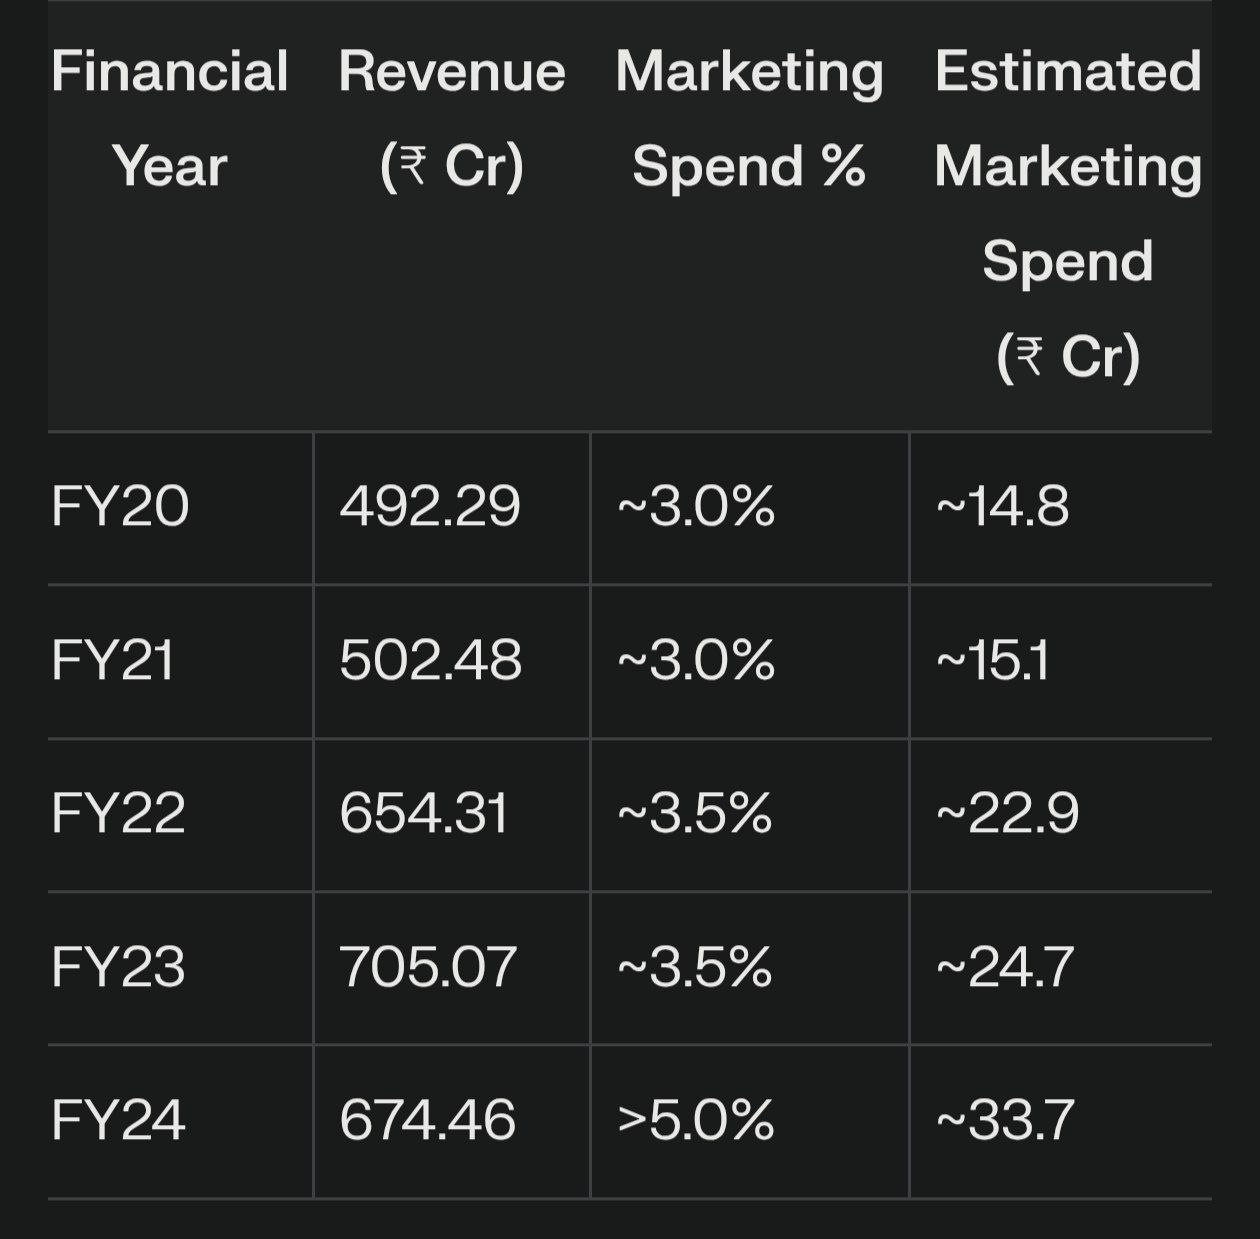
Company has finally started getting aggressive on brand building. the marketing cost as % of revenue for Orient Bell Ltd has spiked beyond 5% compared to 3-3.5% in the previous year.
Tile consumption per capita will go up as India’s per capita GDP keeps increasing.
ANTITHESIS -
The tiles industry is heavily commoditized, with very little to no difference in product quality between companies. India is a surplus capacity tiles market. Any slack in export demand can cause unorganised players to redirect their production towards projects in the domestic market, thus leading to pressure on tile realisations. Only strong tile brands are able to resist pricing pressure, and that too only to an extent.
Gas and power costs are more than 20% of revenue for tile companies. Thus, any large fluctuations in energy prices can have severe adverse impacts on tile margins.
The Russia-Ukraine war in 2022 and the resultant spike in natural gas prices caused tile margins to get squeezed significantly as all the price increases couldn’t be passed on to end consumers.
Due to the commoditized nature of the industry, pricing power, and sound unit economics are therefore gained via high spending on branding to gain customer share of mind and by increasing the scale of operations, respectively.
With such unfavourable price dynamics in a largely commoditized industry, scale, distribution strength, and brand power become very important for a company to succeed. Thus, brands that have already achieved scale are likely to keep getting better and deliver better unit economics, whereas smaller companies would find it very hard to achieve scale.