Long Cycles 2.0: Learnings from Secular Crashes-Market Cycles and our Actionables?

I did some basic number crunching to try and find patterns in the previous major market crashes. Below are some initial thoughts. Will see if I can develop on this theme further.

THOUGHTS

  • Both the previous big falls have been 50%+.
  • The falls were multi-stage. ie. markets fell 30%-ish for 4 times during the dotcom crash and thrice during the GFC.
  • During the GFC, the last leg of the fall was the sharpest, falling 45% in 2.6 months. This is when people already knew the extent of the problem.
  • Strong pullback rallies punctuated each leg of the fall.
  • Going by the last 2 falls, the 50% mark is roughly 6000 and 60% mark is 5000.
  • Each phase of the fall and rise comprised of about 2 months. Going by history, we could be looking at a pullback rally for the next 1-2 months.
  • During the dotcom crash, the market fell consistently for nearly 20 months, and during the GFC it fell for 10 months (top to bottom).
  • The extent and speed of the current fall could mean that we could be heading for a sharp but short cycle of fall which can last less than 1 year.
60 Likes

Very interesting observation .

When index has 3 to 4 such falls … is there any pattern across sectors is there any data or analysis on the same …

Say one sectors bounces back post 1st fall and never to fall back in the entire correction while some sectors never recover in any of rise but keep falling in every fall …

3 Likes

Here is a comparison of the valuation of Nifty 50 companies compared to their valuation in 2008. Majority of the companies are trading below their 2008 price to book levels. Price to book is more relevant than price to earnings in abnormal circumstances. Please note this strictly is a quantitative analysis. I am aware

  1. Nifty constituents have changed significantly from 2008
  2. Some businesses like Eicher are very different today than they were in 2008
  3. PSU stocks have gone below the 2008 levels even before this correction

valuation comparisionxlsx.xlsx (10.3 KB)

5 Likes

Hi

Thanks @basumallick dada for your data and analysis.

I have also been trying to look at a similar sort of analysis but more from a maximum drawdown (Max DD) terms point of view. Though each one’s portfolio will drawdown differently I have looked at Nifty 50 as a portfolio. I wanted to see how painful it is to hold on.

My objective was to look at 3 things essentially:

  1. How far does the portfolio fall
  2. How long does it stay in the dumps
  3. How fast does it fall

I have looked at daily data since 1st Jan 1999. NSE website has data of Nifty from this date onwards. The Max DD chart is below. For folks to get a definition of Max DD it is essentially how much the portfolio has fallen since the previous high, essentially peak to trough sort off.

There are only 3 blocks of period in which Nifty has gone below a drawdown on maximum terms of below 30%.

First period: Dotcom - Period roughly from Feb 2000 to Dec 2003
Second period: GFC - Period roughly from Jan 2008 to Oct 2010
Third period: Covid - Period roughly from Mid Jan 2020 to present

Now if we zoom into each of these 3 periods individually.

Dotcom period

image

How far does the portfolio fall
Max DD was 51%

How long does it stay in the dumps
The overall drawdown was for over 960 days!
image

How fast does it fall
It took a long time of 19 months to reach Max DD

Therefore the pain was elongated and slow in this period.

GFC period

image

How far does the portfolio fall
Max DD was 60%

How long does it stay in the dumps
The overall drawdown was for over 670 days approximately
image

How fast does it fall
It took 9 months to reach Max DD of 60%

The pain is extreme in this instance where in the whole drawdown period almost 15% of the times the portfolio is 50% or more down!

Covid period

image

How far does the portfolio fall
Max DD is 39% as of now

How long does it stay in the dumps
Too early to say. Its been less than 60 trading sessions only so far
image

How fast does it fall
The pain in this case is the speed of fall. In 46 trading days the portfolio was down over 30%. Why we are getting pinched this time is because this speed has happened only once before that was for a very few days in Oct & Nov 2008. The experience of a swift fall is equivalent to only the peak of the GFC crisis.

The data is taken from NSE and there could be a few bps error here and there as I have done this manually. But I am trying to get the essence of the analysis across.

Hope this puts things into context to that of prior falls.

All the best to your trading & stay very safe!!

Regards
Deepak

42 Likes

Someone has rightly said that history tends to repeat itself and so has happened with stock markets when stock valuations have reached sky high. Under such situations the market needs a big event to correct itself significantly but unfortunately the current event is way much bigger than our anticipations and considering which the current downfall in stock markets seem trivial . Under these situations i wonder whether can we take an educated guess what to anticipate in medium term as far as benchmark’s direction is concerned looking into the history of downfall of stock markets under financial crises of similar proportionate.
Considering the very high valuation (PE of around 28) i moved my 75% of equity portfolio into debt in Jan 2018 as per my thinking philosophy that one must consider the overall valuation of stock markets as well. An investor must be getting into the cash from equities along with stock market valuations metrics getting higher and higher to create a margin of safety of different manner, because when a overvalued market correction happens it punishes all the stocks, irrespective of their valuation and fundamentals, more or less.
I did a little exercise with initial thinking that we are into a bear phase now. This exercise represents the way the markets have moved downwards during recent financial crises. Figures, dates given the the screenshot are approximate to present a holistic view to draw conclusions regarding market behavior under bear phases with intention to get a clue what could unfold in future.
This is my first post on the forum and pardon and guide me if am getting something wrong. This is the forum i really admire and helping me to mature as an investor.

23 Likes

Nicely tabulated.

I observe that in the current downtrend first fall has been the fastest and sharpest (39% …1.3 months).
Further, the up-move has not taken out the high of preceding up-move in previous two cycles. But in current case the high of second up-move i.e. 31150 is higher than high of first up-move i.e 30000.

Don’t have much technical knowledge but felt this could be noteworthy

1 Like

I did some quick checks and made an attempt to find out if the current rally in the market is sustainable or not. The purpose of this post is to share my findings with everyone at VP and for me to come back to it in future to verify my current thought process. Sorry for long post. I hope this post will be worth the time you spend reading it. And if this post doesn’t belong here, please let me know, and I will move it to appropriate thread.

Date: 11th April 2020

Are we seeing a ‘head fake’ rally?

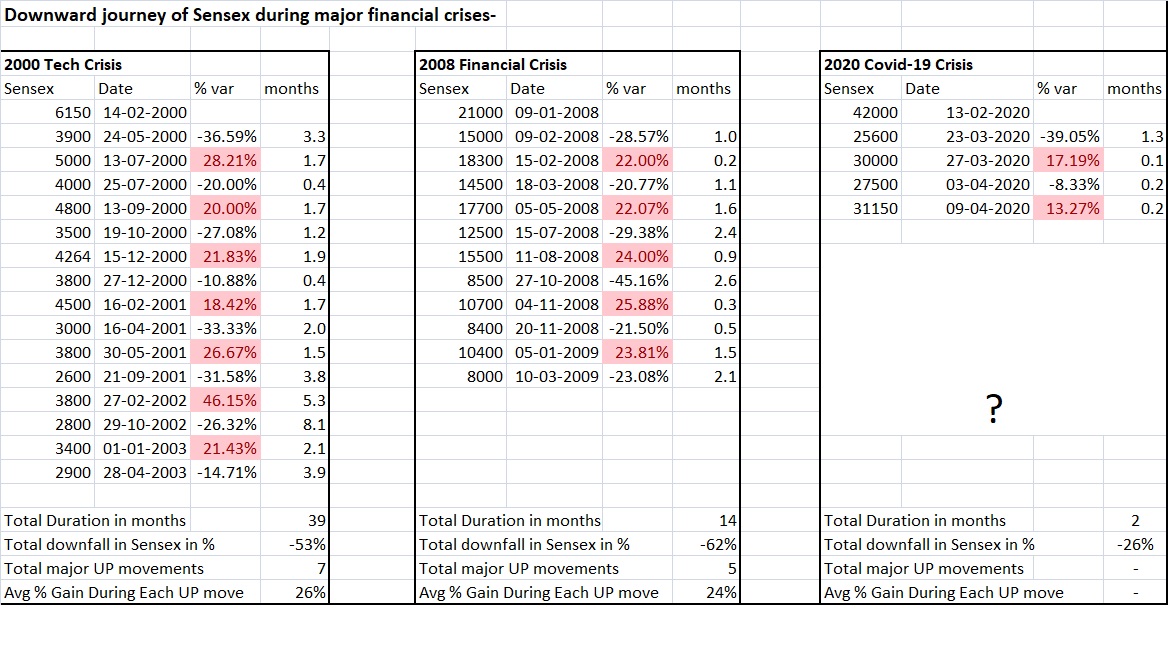
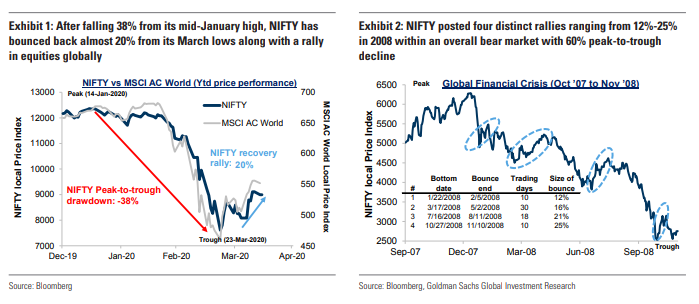
Indian market indices and most individual businesses made 52 week low on 24th of March 2020. Both Nifty & Sensex have made a nice pull back of 21.31% and 21.53% respectively from 24th March 52 week lows. This is good rally. But the big question is, is it ‘head fake’ rally OR an actual sustainable rally with longer and sustainable legs. I did some quick checks and made an attempt to find it out. Let’s take a look:

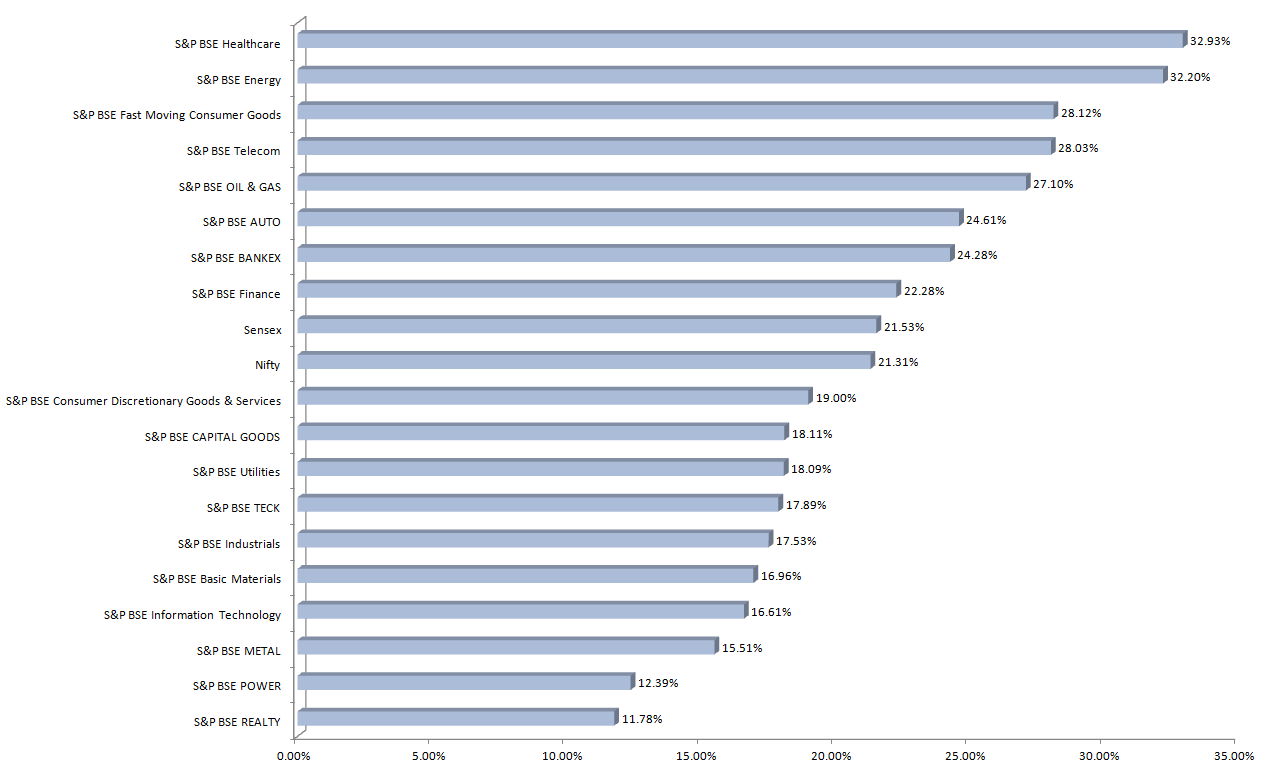
Below is how most BSE Sectors/Indices have moved UP from the 24th March lows.

Defensives % Up from 52week Low
BSE Healthcare 32.93%
BSE Fast Moving CG 28.12%
BSE Telecom 28.03%
BSE Oil & Gas 27.10%
BSE Utilities 18.09%
Sensitives % Up from 52week Low
BSE Energy 32.20%
BSE IT 16.61%
Cyclicals % Up from 52week Low
BSE Auto 24.61%
BSE Bankex 24.28%
BSE Finance 22.28%
BSE Consumer Discretionary 19.00%
BSE Capital Goods 18.11%
BSE Industrials 17.53%
BSE Basic Materials 16.96%
BSE Metal 15.51%
BSE Power 12.39%
BSE Realty 11.78%

Most Gains Have Come From Defensive Sectors

Defensives are perceived to be “safe havens” in bear markets and as we can see from above that they have participated heavily in this rally. In fact we can clearly tell that Defenives have led the rally. All sectors except Utilities have outperformed SENSEX by very wide margin.

This shows that market participants are still possibly FEARFUL and CAUTIOUS and are opting to go with DEFENSIVES in these uncertain times.

Only 3 out of 10 cyclical Indexes have done well relative to SENSEX; Auto, Bankex, and Financials have done well. But Capital Goods, Industrials, Basic Materials, Metals, Power, and Realty have underperformed in this rally by big margin. Its always good to see leadership in rally coming from cyclical businesses that benefit higher from economic growth. Their participation in the rally shows investors are confident of the economic outlook. This has not been the case in this particular rally.

Unpromising Market Breadth

There are two things that I am looking at for checking Market Breadth; down-from-52-week-highs and up-from-52-week-lows. A query gives me total of about 3608 businesses on screener.in.

Up-from-52-week-lows

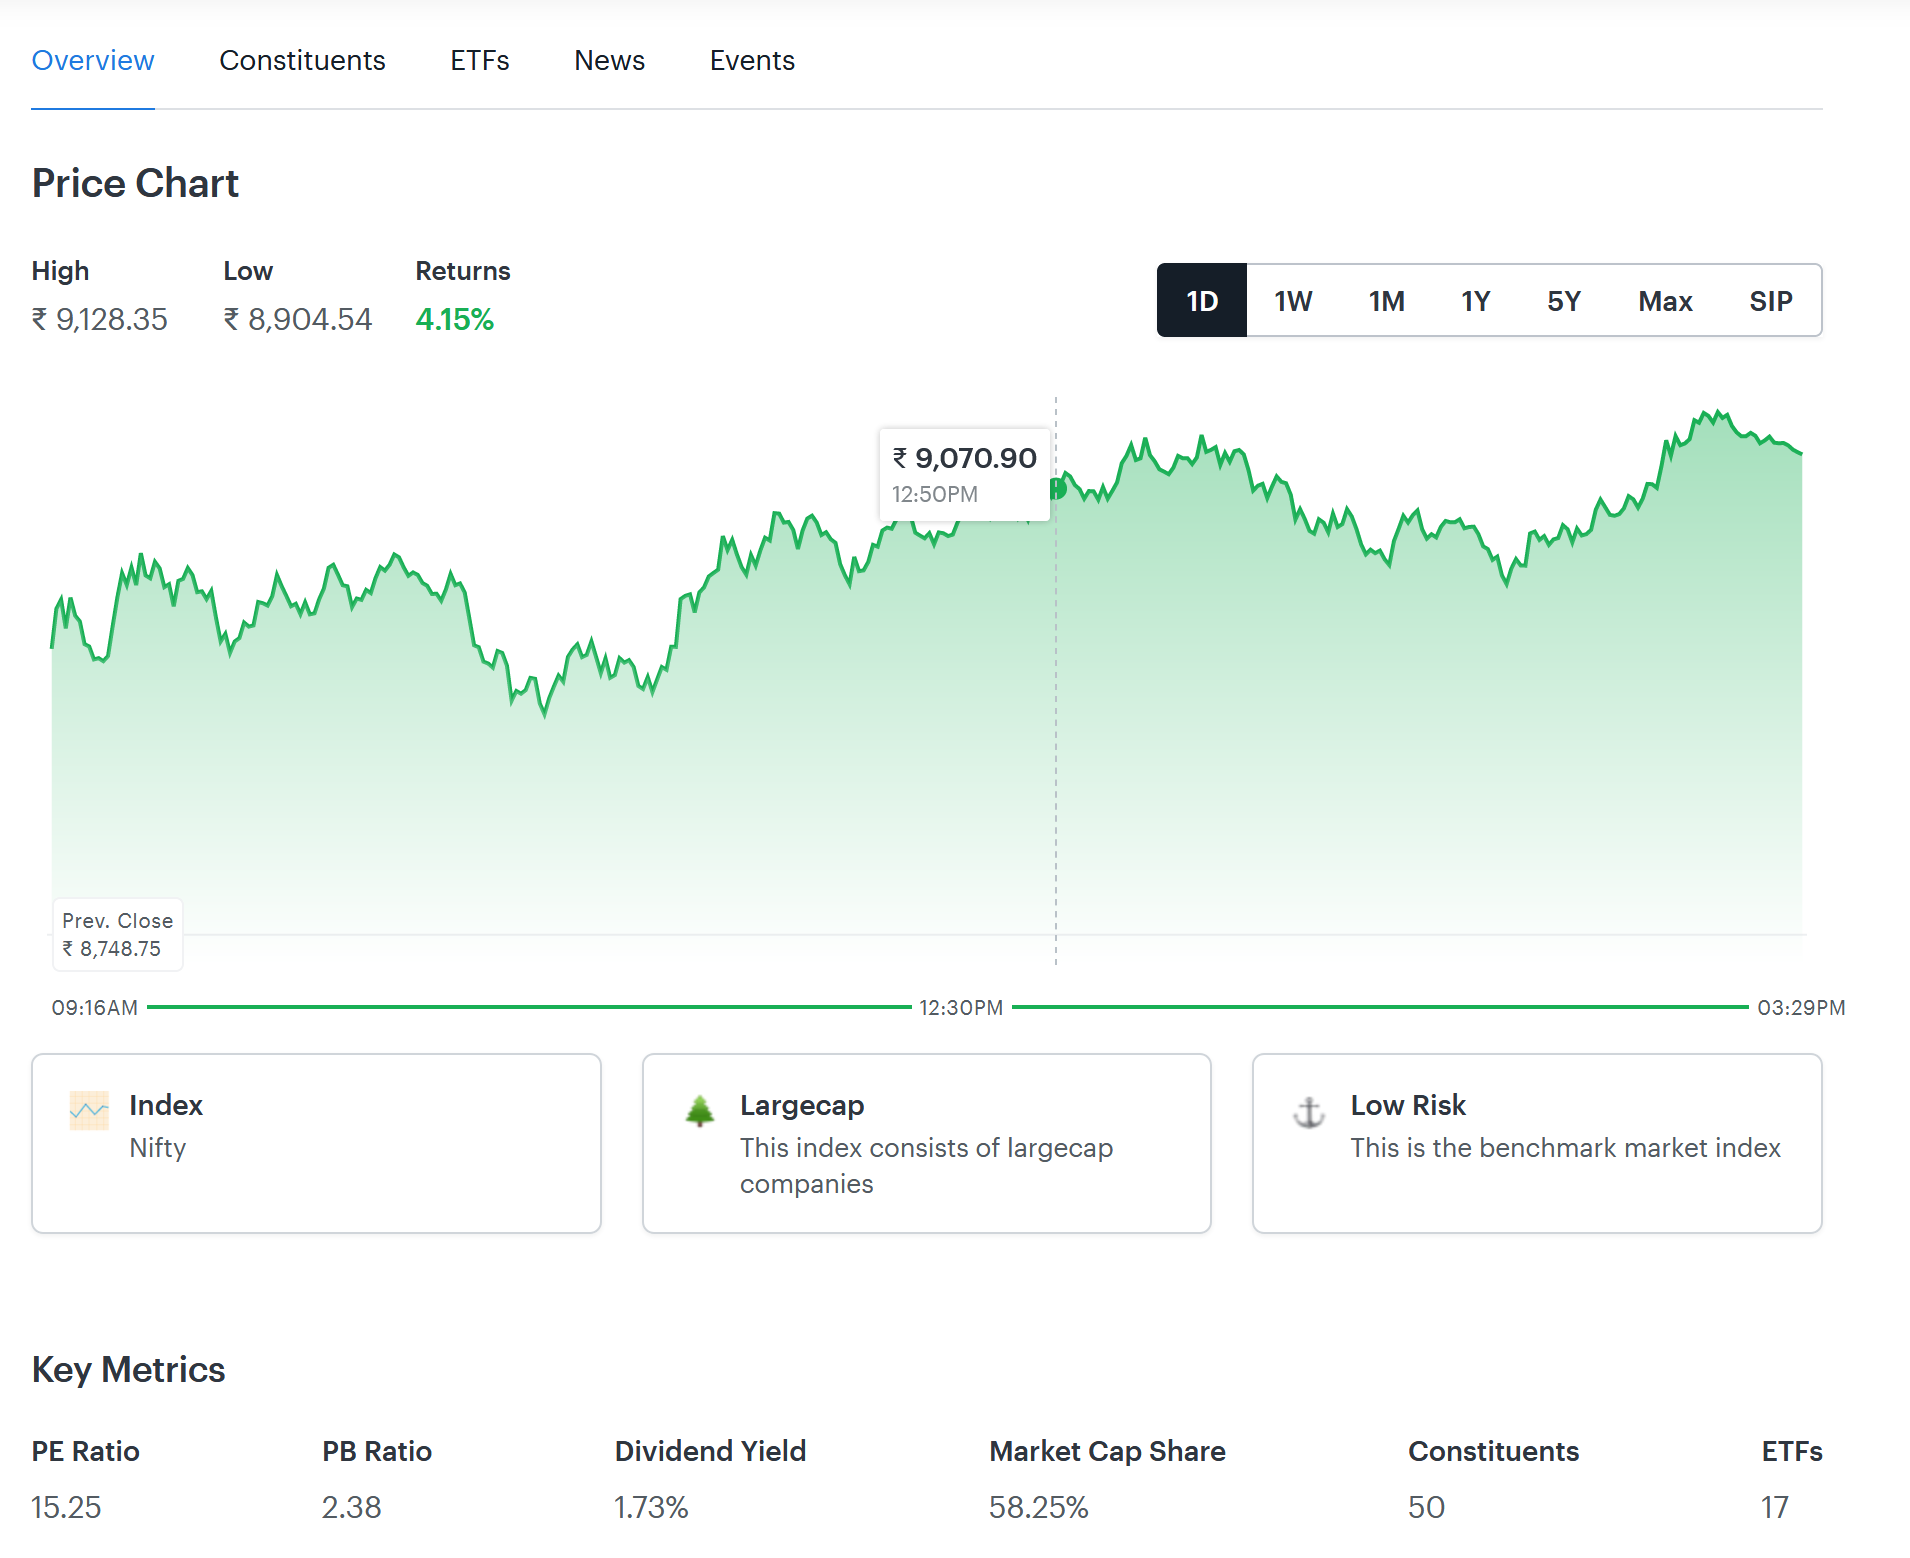
There is a good chance that most (but not all) of the stocks have made their 52 week low during this Corona crash. Both Nifty & Sensex have made a nice pull back of 21.31% and 21.53% from 24th March 52 week lows.

Up by > 21.3% from 52-week-low 1360 37.69%
Up by < 21.3% from 52-week-low 2248 62.31%
Total 3608 100.00%

Numbers from above table are clearly in favor of less businesses participating in this rally.

In fact, there are 804 businesses who have gained less than 10% from their 52 week low which makes up about 22.28% of 3608 businesses. So your 22.28% of businesses have not even rallied half of Nifty or Sensex.

Down-from-52-week-highs

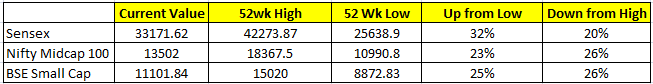
Both Nifty & Sensex are currently down 26.70% and 26.29% from their 52-week-highs.

Down by > 26.70% from 52-week-high 2971 82.34%
Down by < 26.70% from 52-week-high 637 17.66%
Total 3608 100.00%

82.34% of the businesses have fallen more than the market so far.

Nifty and Sensex have rallied BUT underneath individual stocks are still beaten down and there is not much broader participation.

Valuation

Average historical Nifty PE is close to 16 times. Before the market crash, Nifty was trading at about 22 times. Now it’s trading little above 15 times (slightly below the historical average). The lowest PE level that has been seen is ~12 times in bear markets. So if we were to see Nifty bottom close to 12 times which means we will see Nifty close to 6500 levels and this is ~29% away from current level of 9111.90.

Bottom-Line
So let’s quickly review everything that we have seen so far:

  1. Most gains have come from DEFENSIVES which shows participants are still possibly FEARFUL and CAUTIOUS. 7 out of 10 cyclical sectors have underperformed NIFTY/SENSEX by huge margin giving signs that participants are not too sure of economic recovery anytime soon.

  2. 62.31% of the screener businesses have not participated along with current NIFTY/SENSEX rally. And 82.34% of the businesses have fallen more than the market from their 52 week high when compared with NIFTY/SENSEX.

    Nifty and Sensex have rallied BUT underneath individual stocks are still beaten down and there is not much broader participation.

  3. Nifty PE is still far from generally low levels seen in the bear markets.

Based on above findings, my view is that there is a good chance that we are seeing a ‘head fake’ rally.

92 Likes

If we restrict the analysis to EQ only from Bhavcopy , I get these numbers. Screener data can be wrong. At the most, one can include BE. The others are either debt or gold or duds.

Total |1556|

|Down from 52 wk high|1381|89%|
|Up from 52 wk low|1184|76%|

Nifty PE during 2008 bear market is 8 (consolidated)
Now, PE is around 17.5 (consolidated)

How are you arriving at 17.5 ? as 9110 divide by 17.5 gives around 520 rs as Nifty EPS. where as currently Nifty the EPS is approx. 4380440.
and in the current year FY21 it isn’t expected to rise or may shrink depending on what happens to financials / Banking sector which has dominating weight on Index.

if we consider 440 as Nifty EPUS in that case the Nifty PE at 9110 level than Nifty comes to around 20.

please let me know if I am missing anything.
would appreciate

1 Like

Please calculate using consolidate EPS. During 2008, the Nifty standalone EPS is around 12 (You can get it from NSE site). The consolidated PE is around 8. I saw it from a Bloomberg terminal and also remember watching the same figure in one of the TV interviews in CNBC. I will post the link incase I find one from watch history. But I am very sure its not 12 in 2008 (even I thought so till then)

Thanks , so you mean the current Nifty PE for Fy20 is 520 rs on consolidated basis and not 443 rs ?
can you please share the source / link from where you picking up the 520 rs as Nifty EPS as that will help me check , and identify gaps if any and correct it if I am making any errors
Thanks again

As per Zerodha data,current consolidated PE of Nifty 50 is 15.25…means that Consolidated EPS including earnings as of Dec 31,2019 would be approximately 597.50

2 Likes

This one is another poser for the Quants, Quants-influenced in Team VP, just like the original challenge to Abhishek (@basumallick) - to chart out key learnings/take-aways from earlier secular crashes. And many of you have taken forward that quest that Abhishek set out nicely (notably @deevee, @Kuldeep2017, @rupaniamit), most admirably. Think this exercise so far has been quite fruitful for all of us interested.

I am enamoured and emboldened to put up another poser :wink:, that should help us all to get exposed to how I have seen (from the sidelines from 2013) long-cycle veterans play this game, and perhaps equip us to think better about some of these aspects. At the very least this will be an exercise for us to update our general knowledge on earlier secular crashes in Indian Markets, and conditions prevailing then. At the very best, this could prompt us to some great Actionables.

So here goes, without any more ado.
If you will allow me please, let’s try and think more constructively about what we find in the environment today vs what was there immediately preceding.

If we look at it on an overall basis, maybe we could characterise 2011-2020 like this. It was the Globalisation decade. US Crude/Agri Commodity Prices were falling. US Interest rates were falling. And in India, Currency INR progressively got devalued. Overall inflation was rising. Interest rates (RBI Repo) was rising. China dumping of goods kept happening. Heavy Ant-dumping duties in general, were not imposed. And Theme of the decade was “Consumerism”.
[You can come up with your own list, add to or subtract from this, or make an altogether new list; I am just a messenger trying something new, don’t kill me for this :slight_smile: ]

How would we characterise the 1982-1992 decade - leading up to the Harshad Mehta bust. Was it the “License-Raj” decade, and what were the macro characteristics that defined that decade? Similarly 1992-2000 decade (post 1991 reforms) was the decade of the “Internet” - Currency devaluation, Inflation was rising, Interest rates were rising, US Interest rates were falling? 2001-2010 decade was characterised again by cheap debt; INR currency was strong/stable; Interest rates were stable, Inflation was stable; US Crude was rising and US interest rates were Flat?

Without going into nit-picking mode, Idea is to create a simple framework if possible to try and outline this better for us - the way we see many market veterans (we admire) talk about these aspects, in natural way.

So I am looking at the Quant guys to take their work to the logical end. Extending your mapping exercises to decade-long cycles for a start. To map the environment prevailing then onto Winning Sectors/Winning Stocks - in a bid to understand better what could come about for 2021 - onwards.

To crystallise - maybe something like this or better, is what we want to get at?


Long-Cycle-Characteristics.xlsx (42.9 KB)

10 Likes

To do this for India alone, here is how the operating macro environment is tangibly different in 2020 from what it was till 2014 -

Increased push towards financial savings as opposed to physical savings. The period of 2002-2013 was one of people loading up on real estate and gold. Starting 2015 the proportion of household savings coming into financial savings has been steadily increasing. Some data here - HDFC Asset Management Company - #246 by zygo23554

People coming to terms with the fact that the high interest regime maybe a thing of the past One of the things Rajan as the RBI Guv starting talking about after assuming office in 2013 was breaking the back of the inflation expectations narrative. He wanted not just lower inflation but also lower expectations of inflation going forward. Though we have a different RBI Guv today, what Rajan wanted to do has more or less been achieved due to a combination of factors. One can no longer park money in a bank FD and expect to make 8% per annum. Lower rates means lower cost of capital for anyone who is credit worthy

Greater fiscal prudence, more resilient INR and better trade balance The first thing NDA II addressed was fiscal prudence and changing the mix of the Govt spending. The oil crash of 2014 which brought the price down from USD 100 per barrel to USD 60 per barrel was a game changer, as was the fall in gold prices from 2012 onward. End result was better fiscal situation, better trade balance situation and a resilient INR after the 2013 taper tantrum, FX reserves up from USD 280 Bn in 2014 to the current level of USD 475 Bn. Over the past few years the noise has been around an overvalued INR and not the other way around though the USD INR pair at 76 looks way weaker than what reality is

The older employment engines slowing down The mix of employment today is far more different than it was in 2010. Salary growth for the average employee has moderated from double digits to the range of 7-9% per annum. This also works in tandem with point 1 above on financial savings, at high asset prices and lower salary growth/lower visibility on career longevity employees are much more cautious today than they were in 2010

The decade of low Gross Fixed Capital Formation GFCF as a % of GDP was 34% in 2010, since then the number has only trended lower and lower. Private Capex has pretty much seen a lost decade since ROE on business was lower than the 10 year G-Sec yield through the early part of the decade. We have seen the effect of this on industrials and capital goods where things have gone nowhere through the decade. Corporate lenders Vs Retail lenders pretty much sums up the picture too. However, private capex still looks like a mirage

Domestic Consumption becoming the torch bearer of the Indian economy With exports to GDP ratio shrinking from 25% in 2014 to 19% in 2019 (lowest since 2006), the consumption economy became the poster boy of the stock market. See here - India - Exports Of Goods And Services (% Of GDP) - 2024 Data 2025 Forecast 1960-2022 Historical. What changed after 2014? Lower growth of IT and Pharma revenues - two sectors which were incidentally very good employment generators too. No wonder consumer businesses became the most highly valued ones in the Indian stock market

The start stop nature of the economy and the market The period 2003-08 was an anomaly in all ways. We had all engines firing well together - exports, domestic consumption & capex spend, no wonder the growth in EPS averaged 20% per annum during the period. The period post that has been a start stop market where the beast of secular earnings expansion just hasn’t materialized for a long enough period. We have at best had 2-3 segments firing well with the rest lagging big time. In terms of market cycles, we have moved to smaller 5 year cycles where you have 2 bad years, 1-2 average years and one good year.

Given that this is the operating environment today, who stands to benefit/lose in the next decade (not an exhaustive list)?

Clear Beneficiaries

  1. Financialization players - They already have the scale, don’t need incremental capital and will get greater access to the household savings pool which can make multi year growth a reality

  2. Manufacturing companies in India that can make for the world - Lower employee and compliance costs in India combined with a weak rupee can do wonders for these, especially those that are into process manufacturing and have minimal dependence on large scale labour. Need someone to finance your 1000 Cr capex? A bank is more than happy to lend at repo rate + 200 bps since they can mop up retail float at less than 6%. The better ones can borrow in international markets and not worry about an FX blowup since they have a natural hedge in the form of exports.

  3. Consumer Discretionary/Goods/Staples - This economy might continue to grow well given the demographics and aspirational nature of the junta, however the call here is to see if the valuation justifies the growth or not

Negative for -

Real estate, especially residential - Pretty evident if you have read this far

Housing Finance Lenders - Follows from the above

Not an easy exercise, so will need to build over time.

26 Likes

Dear @zygo23554: thanks for this’ll wonderful summary. Can you pls elaborate more on the assertion that INR at 76 to USD is only optically weaker?

RBI tracks and comments about the REER (Real Effective Exchange Rate). This is a composite indicator that drives off how other currencies have moved against the USD over a specific period and how the INR stacks up. The REER can also be tracked over a long period of time.

RBI April 2020 monetary policy commentary - https://www.rbi.org.in/Scripts/PublicationsView.aspxid=19439

See the commentary and graphs under the section “Foreign Exchange Market”

Also you can track the INR REER trend over a longer period of time here - https://www.ceicdata.com/en/indicator/india/real-effective-exchange-rate

See the trend over 10 years where INR has hardly fallen 15% as per REER though the nominal depreciation is over 50% during the same period.

3 Likes
1 Like

Date: 03rd May 2020

GPS of Russell 2000 gave false directions early last week!!!

I usually spend most of research time understanding individual businesses. But these days I spare good portion of my time to understand the pulse of the market since this is my first bear market experience. I do have decent portion of cash allocation in my portfolio which I would like to allocate at “right” time. Well, we all know that attempt to time the market is a futile exercise, but history has shown that when a rally in the market is lead by economic sensitive businesses and broader participation, that rally usually has stronger legs to sustain. We will see how bottom is formed in this bear market. But I have a feeling that bottom will not be created until money goes into cyclical businesses of economic sensitive sectors (from defensives) and then that the initial money keeps attracting new money to sustain the rally.

Documenting this exercise will allow me to come back to it when this bear market is over to check how my brain was evaluating the market pulse.

So with that being said – let’s see how markets moved last week 27th April – 1st May 2020.

US Markets

Let’s Zoom-in and see each day movement of S&P500 and Russell 2000 in the below screenshot:

image

Full week return was flattish. But a lot of things happened underneath. Optimism of slowly opening up of the US economy along with positive news like FDA authorization of emergency use of Gilead drug Remdesivir for Covid-19 patients helped market move smartly for first three days of the week. S&P500 increased 3.62%, but Russell 2000 increased 10.36% during first three days. It was good to see such big divergence by Russell 2000 first time in this big pull back from lows of March 23rd. This big outperformance definitely was good initial sign to build up some hope for sustained rally.

But as bear market rallies usually are, they are sharp on both sides. The following two days of the week, Thu & Fri, all the gains achieved in first three days of the week were sold-off. Russell 2000’s divergence (on down side this time) accelerated by dropping 7.37% compared to 3.7% for S&P500 from Wednesday’s close.

Let’s Zoom-out and see how S&P500 and Russell 2000 have performed so far in 2020.

image

As we can see that S&P500 and Russell 2000 have rallied almost similar percentage from 23rd March lows, but Russell 2000 is still beaten down more than S&P500 from the highs.

US sentiment winds reach developed markets very fast. Hence, it’s very important to keep an eye on the pulse of US markets.

Indian Markets

Let’s see how Sensex have performed compared to Mid0-Cap and Small-Cap indices so far in 2020:

image

As we can see that Midcap & Small-caps have underperformed Sensex by decent margin on both Up fro Lows and Down from Highs. They have risen less and fallen more. At least Russell 2000 rallied equally with S&P500 from Lows.
Inferences from Last Week

  1. Hope for sustained rally was building in US markets, but Hope got sold-off in last 2 days of the week.
  2. Indian broader market participation is still not there.
  3. India has extended the lockdown for two weeks while easing some restrictions.

Bottom-Line

Nibble here and there but don’t be in any rush to deploy the cash – its gonna be a longgggg night!!!

There are zillions of uncertainties still out there. I still don’t know how a lot of things will pan out.

Warren Buffett advised on yesterday’s Berkshire AGM; we better not be too sure of ourselves in this situation.

But I am sure of to keep my eyes and ears open to closely monitor the collective wisdom of the market participants next week.

Happy Investing!

Disc: not a SEBI registered analyst, experiencing first bear market, learning the lessons that market teaches every day, please do your own due-diligence.

13 Likes