Date: 17th May 2020
Are Markets Feeling Fatigued After Big April Rally?
Nifty: 9136.85 Down from Highs: 26.50%
My quest continues to learn how market bottoms globally in this COVID-19 created crisis. I checked few key indicators underneath to check market pulse. Let’s check them out.
NSE Volume & Nifty Comparison
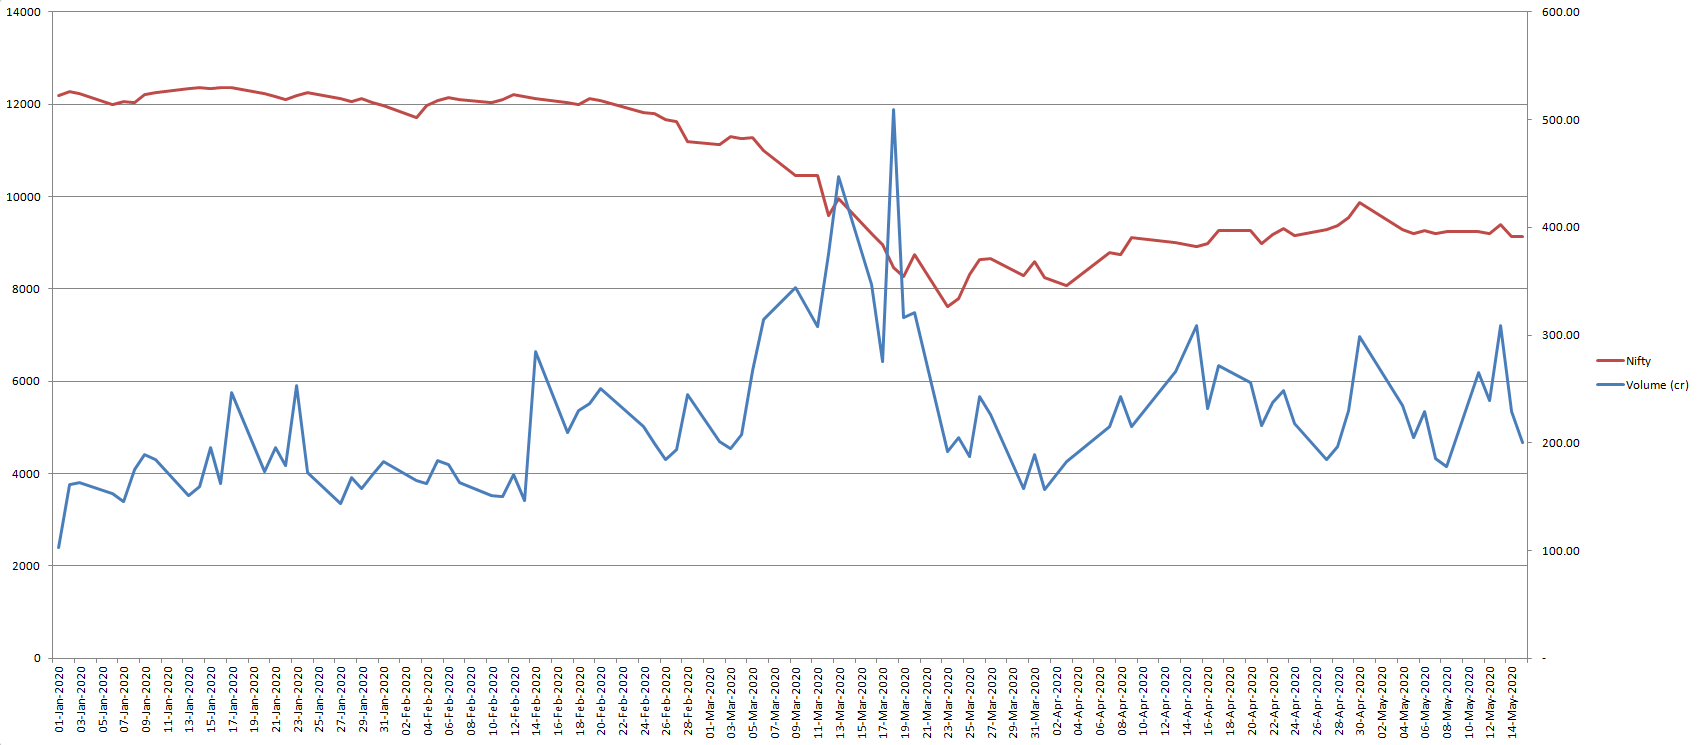
Below screenshot shows NSE Volume comparison with Nifty value from beginning of 2020 till last close of 15th May 2020:
First of all, I want to give credit to @rohil for helping me pull data from NSE site from daily bhav copies and then also with data scrubbing.
We scrubbed the end of day bhav copy data by removing all rows that were not ‘EQ’ series. We got about 1910 stocks with EQ series. EQ series stocks, investor can settle a trade without accepting or giving its delivery.
We then aggregated daily total volume of all EQ series stocks which is blue line in above screen shot.
As we can see in above screenshot, volume first spiked around 9th of March at 345cr levels. Volume reached highest level at 510cr on 18th March during heightened volatility. But to my surprise, volumes dried up at lowest level of Nifty of 7610 on 23rd March. There is good chance market participants were staying away as markets were melting and making 52-week lows. Both markets and volumes are moving in a range since 2nd week of April.
AMFI Data
Below screenshot shows AMFI Equity Net Inflow comparison with Nifty value for last 12 months:
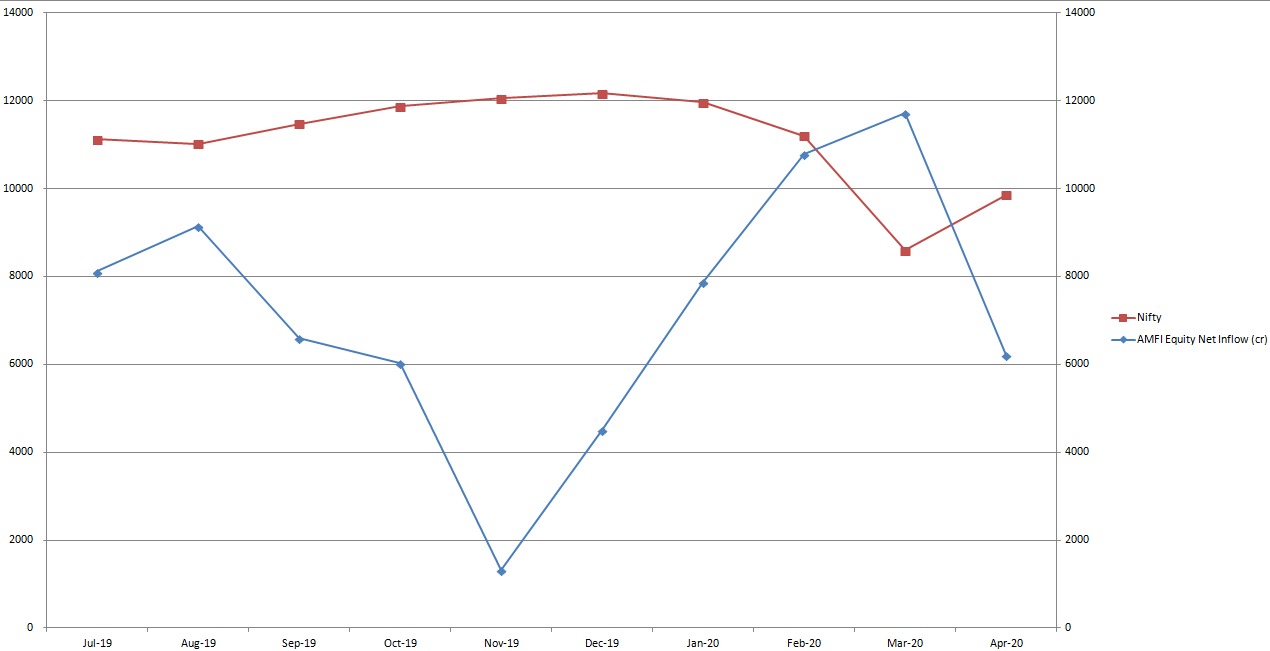
Investors booked profits as markets touched record highs in November 2019. We can see sharp decline in net inflows for that month. Investors pumped-in highest money during March panic driven market, but pulled-back in April as market rallied from March lows.
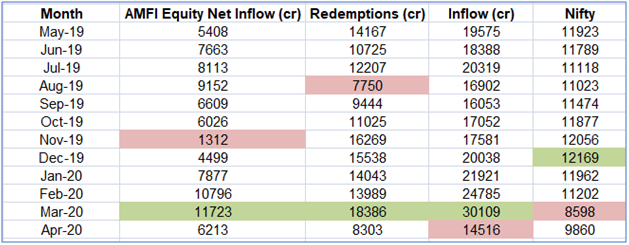
March 2020 saw highest AMFI Equity Net Inflow, Redemptions, and Inflow when there was maximum panic plunging markets to 52-week lows. This indicates, weak players pulled out but smart players put-in more money at lower levels. There was maximum Greed & Fear in the same month but greed outweighing fear. Probably we will see market bottoms when Redemptions come-in but not the new inflows.
April Rally Puzzle
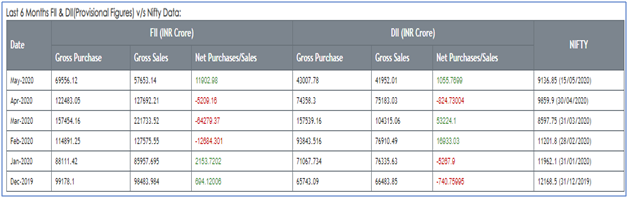
@basumallick dada shared a very interesting development that transpired in the month of April. Both FII & DII were net sellers as can be seen from above screenshot. Nifty rallied ~15% in April without any support from FII & DII is incomprehensible. If anyone has any answers, please feel free to comment.
Both FII & DII have been net buyers so far in May (till 17th May), but Nifty is down about 7.33% for the month. Who is selling other than FII & DII to pull Nifty down by 7.33%?
Bottom-Line
Let’s bring everything that we have seen so far together.
Volume: no significant spike in volume in current rally from March lows. Even package as big as 10% of GDP also didn’t spike any significant volume.
AMFI: Net inflows decreased sharply in April after record new inflows in March. Investors were seeming more cautious in April than March.
FII & DII Data: it’s a puzzle with no direction.
Nifty ended month of April on high note closing at highest level of last 1 month at 9860. Since then it retraced back some ground and have been facing stiff resistance around 9400 area.
It’s difficult to say how the markets will move from here given so much economic uncertainty. Volume & AMFI April data probably indicate markets are fatigued and need significant triggers to move further up from current levels. I feel these are good enough indicators to make me believe that there may be more downs than ups in the near term.
Happy Investing!
Disc: not a SEBI registered analyst, experiencing first bear market, learning the lessons that market teaches every day, please do your own due-diligence.