
A big thank you to @Deenar_Toraskar and @Anish_Moonka for working on Krsnaa with me over the last month or so.
Tender Landscape
Following on from previous posts, one goal in this thread has been to chart out the landscape of tenders that are currently being floated by the government. @Deenar_Toraskar has done fantastic work on finding a number of them.
Key points:
-
The current tender landscape is around 600 Cr. conservatively. These tenders close by the end of the month, and should be awarded in 2023.
-
Rajasthan is the largest tender at 200-300 Cr. Following this is a large pathology contract in Odisha worth around 100 Cr., and a couple of smaller tenders worth 50 Cr. each.
-
Cancellations of tenders and subsequent re-tendering happens all the time for various reasons. We found 3 tenders on this list that are up for re-tendering. One in particular has been in the works since 2020.
-
Therefore even if things are up for re-tendering, it’s fine. There are many on the table at any given moment.
-
There are lots of smaller tenders in the 5-25 Cr. range that individually add up to around 100 Cr.

This is a work-in progress sheet. It will be updated when we find more details.
Assumptions in value: I’ve assumed each CT scanner gives around 3 Cr. of revenue, and each MRI gives around 2.5 Cr. of revenue. Pathology tenders are harder to ballpark, but have been done by reasonably extrapolating from Rajasthan data that we had above, and comparing the number of district hospitals in each contract, and the population of each state.
Tenders won in 2022, to be implemented
-
Largest win has been the operation of 39 CT scanners in Maharasthra, providing around 100 Cr. of revenue.
-
Uttar Pradesh contract is second largest at around 20 Cr.
-
Himachal Pradesh path contract is statewide, but I assume revenue is not very high as HP is not a populous state.

From a very recent interview, it’s clear that HP path isn’t fully implemented yet:

Centrewise CT Scan Data
-
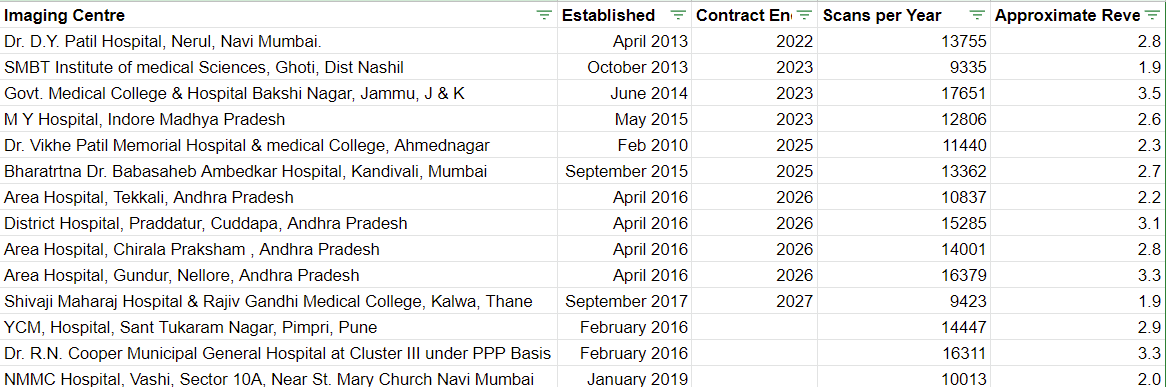
I have found Krsnaa’s yearly throughput for some existing CT scan centres, along with dates of when contracts end.
-
The median number of tests done per year is around 13,500. At Rs. 2000 per test, this comes out to around 2.7 Cr. of revenue per CT machine, and around 36 scans per day. (Further points to my assumption on CT revenues being in line.)
Krsnaa Teleradiology Ramp Up
Case study: Maharashtra
-
Krsnaa set up the teleradiology centres in Maharashtra just as the pandemic hit, in Q1FY21.
-
I have found district level data on the number of scans conducted, and categorised them quarterly.
-
Krsnaa went from conducting 40,000 x-rays per quarter to around 300,000 in the span of 8 quarters.
-
Since inception, centre did around 1.2 million tests, reporting 99.02% of all tests within the required turn around time.
Here’s the data visually:
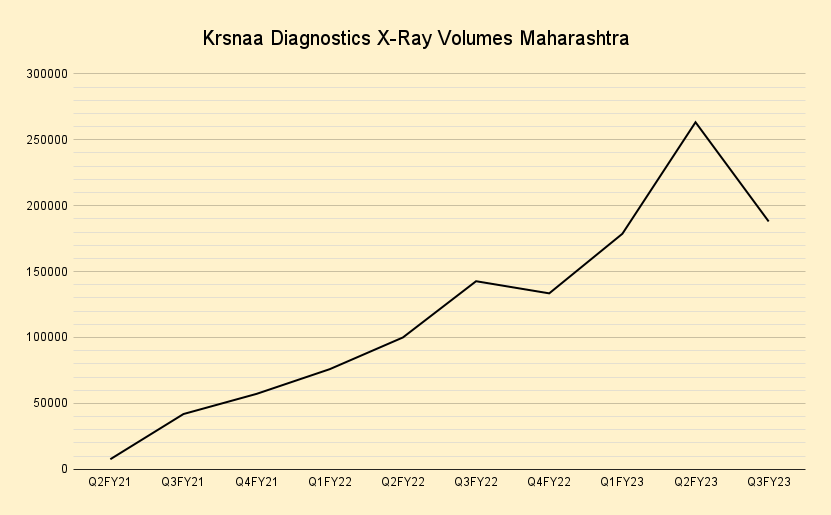
- Note Q3FY23 data is current, as of 3rd December 2022, and therefore the quarter looks weak. At this run rate, quarter will end at around 300,000 tests.
| District | Q2FY21 | Q3FY21 | Q4FY21 | Q1FY22 | Q2FY22 | Q3FY22 | Q4FY22 | Q1FY23 | Q2FY23 | Q3FY23 |
|---|---|---|---|---|---|---|---|---|---|---|
| Total | 7604 | 41901 | 57211 | 75959 | 100016 | 142688 | 133476 | 178694 | 263327 | 188033 |
| AHMEDNAGAR | 8 | 888 | 1050 | 1400 | 2238 | 2524 | 2484 | 3569 | 4633 | 2936 |
| AKOLA | 1 | 1013 | 1170 | 1700 | 3621 | 4359 | 3341 | 3680 | 7943 | 3755 |
| AMRAWATI | 5 | 1677 | 3139 | 3624 | 5587 | 6776 | 6259 | 8113 | 11078 | 6161 |
| AURANGABAD | 3 | 3190 | 2662 | 2336 | 3724 | 3992 | 3929 | 5984 | 9504 | 6597 |
| BEED | 7 | 225 | 576 | 686 | 1569 | 3307 | 3346 | 5502 | 8254 | 5706 |
| BHANDARA | 19 | 36 | 265 | 537 | 1486 | 4213 | 1622 | 1858 | 2799 | 2262 |
| BULDHANA | 9 | 475 | 984 | 1128 | 2410 | 2690 | 3101 | 2926 | 7397 | 6212 |
| CHANDRAPUR | 313 | 1981 | 906 | 1423 | 3372 | 6763 | 4817 | 7206 | 9023 | 6212 |
| DHULE | 1 | 206 | 427 | 433 | 1275 | 1847 | 2276 | 2983 | 3394 | 2388 |
| GADCHIROLI | 305 | 653 | 1287 | 2180 | 2934 | 4169 | 3129 | 3650 | 7209 | 6053 |
| GONDIA | 118 | 439 | 543 | 594 | 1629 | 2960 | 2015 | 2796 | 3120 | 2153 |
| HINGOLI | 6 | 383 | 472 | 724 | 783 | 1429 | 1198 | 1484 | 5009 | 3515 |
| JALGAON | 16 | 850 | 1034 | 981 | 1324 | 1457 | 1249 | 2054 | 3299 | 2594 |
| JALNA | 2 | 3732 | 2114 | 2433 | 2248 | 4228 | 3730 | 4997 | 8089 | 6561 |
| KOLHAPUR | 11 | 3670 | 3707 | 3717 | 4231 | 7593 | 7208 | 8984 | 14078 | 9853 |
| LATUR | 2 | 895 | 1626 | 2451 | 3928 | 4923 | 3918 | 6005 | 8498 | 4011 |
| NAGPUR | 2 | 461 | 885 | 904 | 1862 | 4154 | 4006 | 5334 | 6894 | 4310 |
| NANDED | 126 | 997 | 1578 | 1698 | 2016 | 4354 | 4100 | 4854 | 6853 | 4589 |
| NANDURBAR | 19 | 121 | 1040 | 844 | 1410 | 2012 | 1512 | 1458 | 1885 | 2250 |
| NASHIK | 1738 | 2519 | 3051 | 3200 | 6791 | 8151 | 8888 | 11931 | 16079 | 13522 |
| OSMANABAD | 4 | 513 | 907 | 1799 | 2745 | 4346 | 2581 | 3796 | 7122 | 5551 |
| PALGHAR | 2 | 133 | 869 | 752 | 1190 | 2842 | 3374 | 3859 | 5625 | 4433 |
| PARBHANI | 2 | 66 | 341 | 1930 | 998 | 2153 | 1728 | 2336 | 4095 | 3069 |
| PUNE | 18 | 2257 | 4232 | 6337 | 5518 | 7236 | 9512 | 13262 | 18708 | 12823 |
| RAIGAD | 1227 | 1557 | 3205 | 3852 | 3662 | 4197 | 3271 | 4270 | 6125 | 4934 |
| RATNAGIRI | 2009 | 1834 | 2020 | 2572 | 1752 | 1674 | 1846 | 2441 | 3554 | 3167 |
| SANGLI | 0 | 1060 | 843 | 2508 | 2524 | 5587 | 4341 | 8060 | 13611 | 4940 |
| SATARA | 2 | 988 | 1753 | 4109 | 4184 | 3838 | 3210 | 6634 | 11946 | 9685 |
| SINDHUDURG | 1243 | 3514 | 3925 | 4985 | 4439 | 4426 | 5350 | 5400 | 6968 | 5632 |
| SOLAPUR | 3 | 571 | 700 | 410 | 870 | 2872 | 3711 | 6324 | 8593 | 6337 |
| THANE | 345 | 3116 | 6056 | 6917 | 7692 | 9162 | 10677 | 12341 | 13985 | 11872 |
| WARDHA | 36 | 898 | 2025 | 2723 | 4962 | 6404 | 4649 | 5927 | 7563 | 5907 |
| WASHIM | 1 | 703 | 718 | 1907 | 2723 | 2896 | 3300 | 3996 | 4641 | 3680 |
| YAVATMAL | 1 | 280 | 1101 | 2165 | 2319 | 3154 | 3798 | 4680 | 5753 | 4363 |
- I have found teleradiology data for 8 states, will compile and upload when I work on this again.
All the data we have is compiled at the following sheet:
https://docs.google.com/spreadsheets/d/1nHcO4Xe5n_y4dBRt-VGC--wASo3XqZkmv75qnRACPAY/edit?usp=sharing
Disclosure: Invested, Krsnaa forms 10% of my portfolio.