Kelly Criterion Capital Allocator (Model): A Mathematical Approach to Capital Allocation

Hi Valuepickrs,

Dinesh Sairam here once again, with… you guessed it… another excel model. This time, it’s not so much realted to Valuing stocks, but towards the elusive concept of Capital Allocation.

Kelly Criterion

The idea behind the model is completely owed to Dr. J. L. Kelly Jr., the author behind the famous paper “A New Interpretation of Information Rate”, which gave us an interesting way to think about bets in a wagering game. In short, ‘Kelly Criterion’ is a formula which calculates how much of one’s wealth can be put down in a bet in order to maximize the rate of return.

Over the last few weeks, I happened to go through the paper, while also accessing a few other websites on the topic. So, today, I decided to make an excel model based on ‘Kelly Criterion’, that can be used as a Capital Allocation Framework for investors.

The Model

Feel free to download the model using this link: Kelly Criterion Capital Allocator.xlsx (15.8 KB)

In case you have a hard time finding out the ‘Expected Returns’ on your investments, you may also need my other model to make things easier: Practical Thought Valuation Model.xlsx (14.8 KB)

This is how the ‘Kelly Criterion Capital Allocator’ looks like inside:

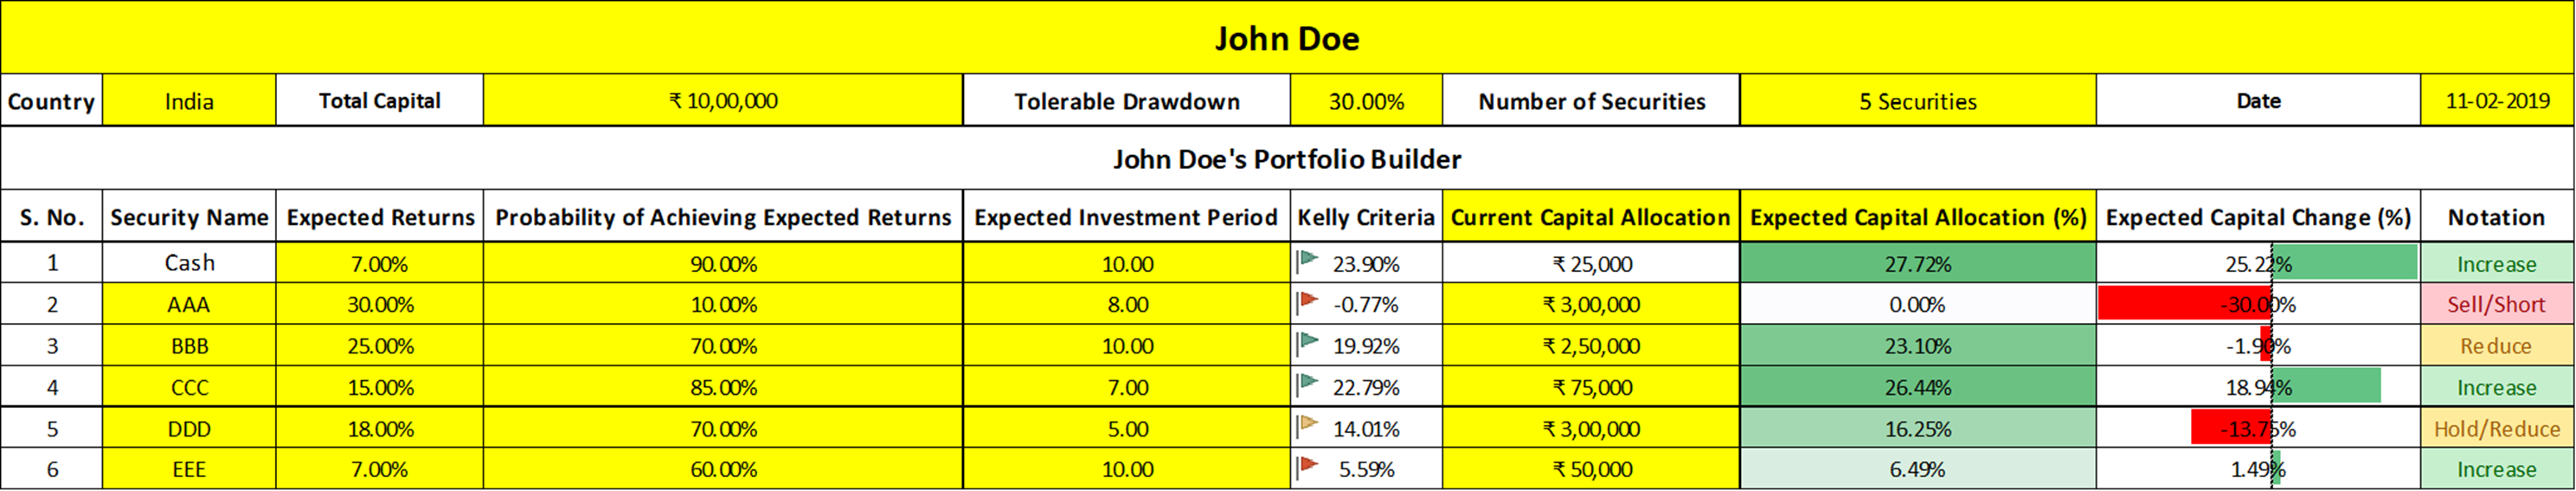
(The details I have entered currently are just fillers)

Notes

The model is pretty much self-explanatory. But let me leave a few notes on how to use it / how it works:

  1. Editing/Changing: Edit/Change ONLY the cells highlighted in yellow. Editing anything else in the model may cause it to malfunction or break permanently.
  2. Transitioning: You can enter ‘Current Capital Allocation’ as a Percentage or Number. But while transitioning between the two, you may see weird calculations happen i.e. If you entered ‘Rs. 10,000’ in the first column of ‘Current Capital Allocation’ and then transitioned to ‘Current Capital Allocation (%)’, the excel will likely convert it directly to 10,00,000% or so. The easy fix is to just re-enter the figures appropriately.
  3. Errors: The most common error I can think of is you enter figures that don’t add up. Ex: Entering ‘Rs, 10,000’ as the total Capital value, but then the sum of each security’s value as more than Rs. 10,000 and so on. The fix is to not to do such mistakes.
  4. Interpretation: The ‘Kelly Criteria’ column shows how much you can bet individually on each security. ‘Expected Capital Allocation’, of course, re-allocates the bets at the Portfolio level.
  5. Sharing: Like most of my models, there are no restrictions in sharing this one around. But I only request that you do not remove/hide the attribution written below. We owe at least this much to Dr. J. L. Kelly Jr.

References

Of course, ‘Kelly Criterion’ has both pros and cons. For an easier understanding, kindly refer to Wikipedia or FinBox.

P.S. The Theory of Capital Allocation

If you’re usually fed up by looking at numbers alone, fret not. The theory of Capital Allocation has been discussed at length in VP already. I suggest you visit the following thread, which is nothing short of a must-read if you use this forum regularly. If you can make an association between the theory and the numbers behind Capital Allocation, that would be amazing.

Please do use the model and post the results. Any and every criticism will be taken at face value. We’re here to learn and what better way than through a constructive dialogue? :slight_smile:

8 Likes

Kelly criterion is a good theoretical exercise. However, it rarely works in real life in markets and practically no successful trader or investor uses it. The main reason is that Kelly write this formula for games of chance where the win/loss ratio is computable and over a large number of iterations the probability of winning can also be guessed at. In investing, neither can be determined with any reasonable accuracy.

The better way to look at portfolio allocation is to have a simple thumb rule based system. Something similar to large institutions. For example, max allocation to not exceed 10% at cost. Min allocation to be 3%. Max sector allocation to be less than say 30% etc.

We need to understand that excel models don’t necessarily lead to better outcomes, specially when dealing with items for which data is indeterminate. Sometimes, simple things done in a disciplined manner is Much more effective.

15 Likes

In “Market wizard” and other books in that series written by the same author, some of the extremely successful traders and investors, use the 1pc rule
They operate on stop loss, without extremely being devoted to charts
Each stop loss is 1pc on your portfolio. If it were to trigger, you’d lose 1pc
This gives you almost unlimited chances to protect your capital as if you lose 1pc the next 1pc is a lower bet as it’s 1pc of 99 and you also have a clarity of mind to exit and look objectively at the market for your next investment
In the end we are all playing a game, what matters most during ups and downs is that you manage to stay in the game
If you get wiped out or down 30-40pc it’s difficult to get back
You know it’s a game when you know that even if you multiply your investment to 100crore and over like in cases of big bulls, you still want to be in it and not exit and enjoy your life
Rakesh jhunjunwala for instance exited as soon as dhfl went down without waiting it to go more down or adding on the way down

1 Like

The stop loss should be one percent of your net worth, not portfolio, as your equity exposure may vary with market condition. Also this rule should not be used to determine where to put your stop loss. Rather the stop loss should be determined by deciding where the market should not go, if your assumptions are right. Once the stop loss has been determined, the position size is obtained from one percent rule.

I am not trying to be pedantic but giving broad ideas
My net worth if you want to correctly put it also includes non portfolio assets like properties, bank balances which I don’t intend on converting to equities
What I meant is the total size of my equity, roughly 1pc will be the exposure on it hitting 10pc below where most congestion (buying/selling) is on a volume chart. My assumption being not many people take a loss so once the charts are around major congestion, it’s unlikely they will go down unless many people are seeing something I am not
Besides if I see something wrong with my analysis or new adverse information coming about the stock then I get out irrespective of where I am

I am not trying to be pedantic either. The one percent rule protects you when you are wrong, but it also limits your profit when you are right. So if your total equity exposure is just 20-30% (which is true for me given the current market situation), one percent risk on portfolio basis will be too small to make any significant contribution towards your net worth.

One has to be clear about the timeframe of trading or investing. 1% stop loss for traders is fine but may be too small for an investor with a longer horizon. Ultimately, a stop loss needs to accomodate many factors like volatility of the stock and the market, technical support & resistance zones and also the ability to bear losses emotionally as well as at a portfolio level. So, one needs to have a simple yet practical approach for placing a stop loss.

2 Likes

We are not suggesting 1% stop loss, rather we are suggesting keeping only 1% of net worth at risk. To take an example, say your net worth was one lakh, you have an opportunity priced at 100, and you decide to keep a stop loss of 10%, that is of 10 points per share. Since you can risk atmost 1% on your net worth, that is 1000/-, you can buy atmost 100 shares, which is upto 10% of your networth. That is large enough for an investor, though you may want deeper stop loss if your timeframe in larger, or larger exposure if you like having concentrated portfolio, in which case I agree with relaxing the one percent rule appropriately.
That said, all other factors which help determine the stop loss can still be applied while following the one percent rule.

You are assuming I’ll exit when I am in 1pc profit
I didn’t say that. I only said I’ll exit on stop loss, supported by average or high volume but the profits are not to be exited
Just the stop loss keeps rising at every resistance than converts into a support

I think subjectivity and personal behavior does play a larger role. A person who is able to successfully control his/her emotions during turbulent times might benefit from the thumb rule of sorts that you’ve shared. For others, rule based method might only help to reduce ambiguous decision making. If Kelly Criterion / any other quant based methodology works, then I think its good as long as your are able to define it clearly, account for scenarios and stick to it. Thats where most folks say that there is no right / wrong way in investment methodology.

Of course, I do not intend to suggest that this model function as the be-all-and-end-all of Capital Allocation. I read the paper and happened to think that it could be as helpful as a finger in the right direction towards a better Capital Allocation Framework. The trick is in integrating the theory and the numerical logic.

The assumption in Kelly Criterion is of having an edge. Also, one has to give a numerical value to that edge. Is there a possibility at all in our markets? Maybe we could have a range?