
Yes, please share the correct data? my apologies if I have posted the wrong one.
This NOTE does NOT delve into KEI Industries specifically but provides an Insightful Sectoral overview of ALL the 20 listed Power Cable companies in India.
![]()
Power Cables are to Electricity, what Roads are to Automobiles.
If we’re going to hit the 5$ Trillion GDP mark, we’re going to need a hell lot more Energy/power/electricity!
Wires & cables being the carriers of Electricity, are fundamental to our growth goals as a nation ![]() So, In this note, we’ll conduct a mostly Quantitative Analysis of 20 Listed Power Cable companies in India.
So, In this note, we’ll conduct a mostly Quantitative Analysis of 20 Listed Power Cable companies in India.
Some (not all) of the Ratios we will be using are :
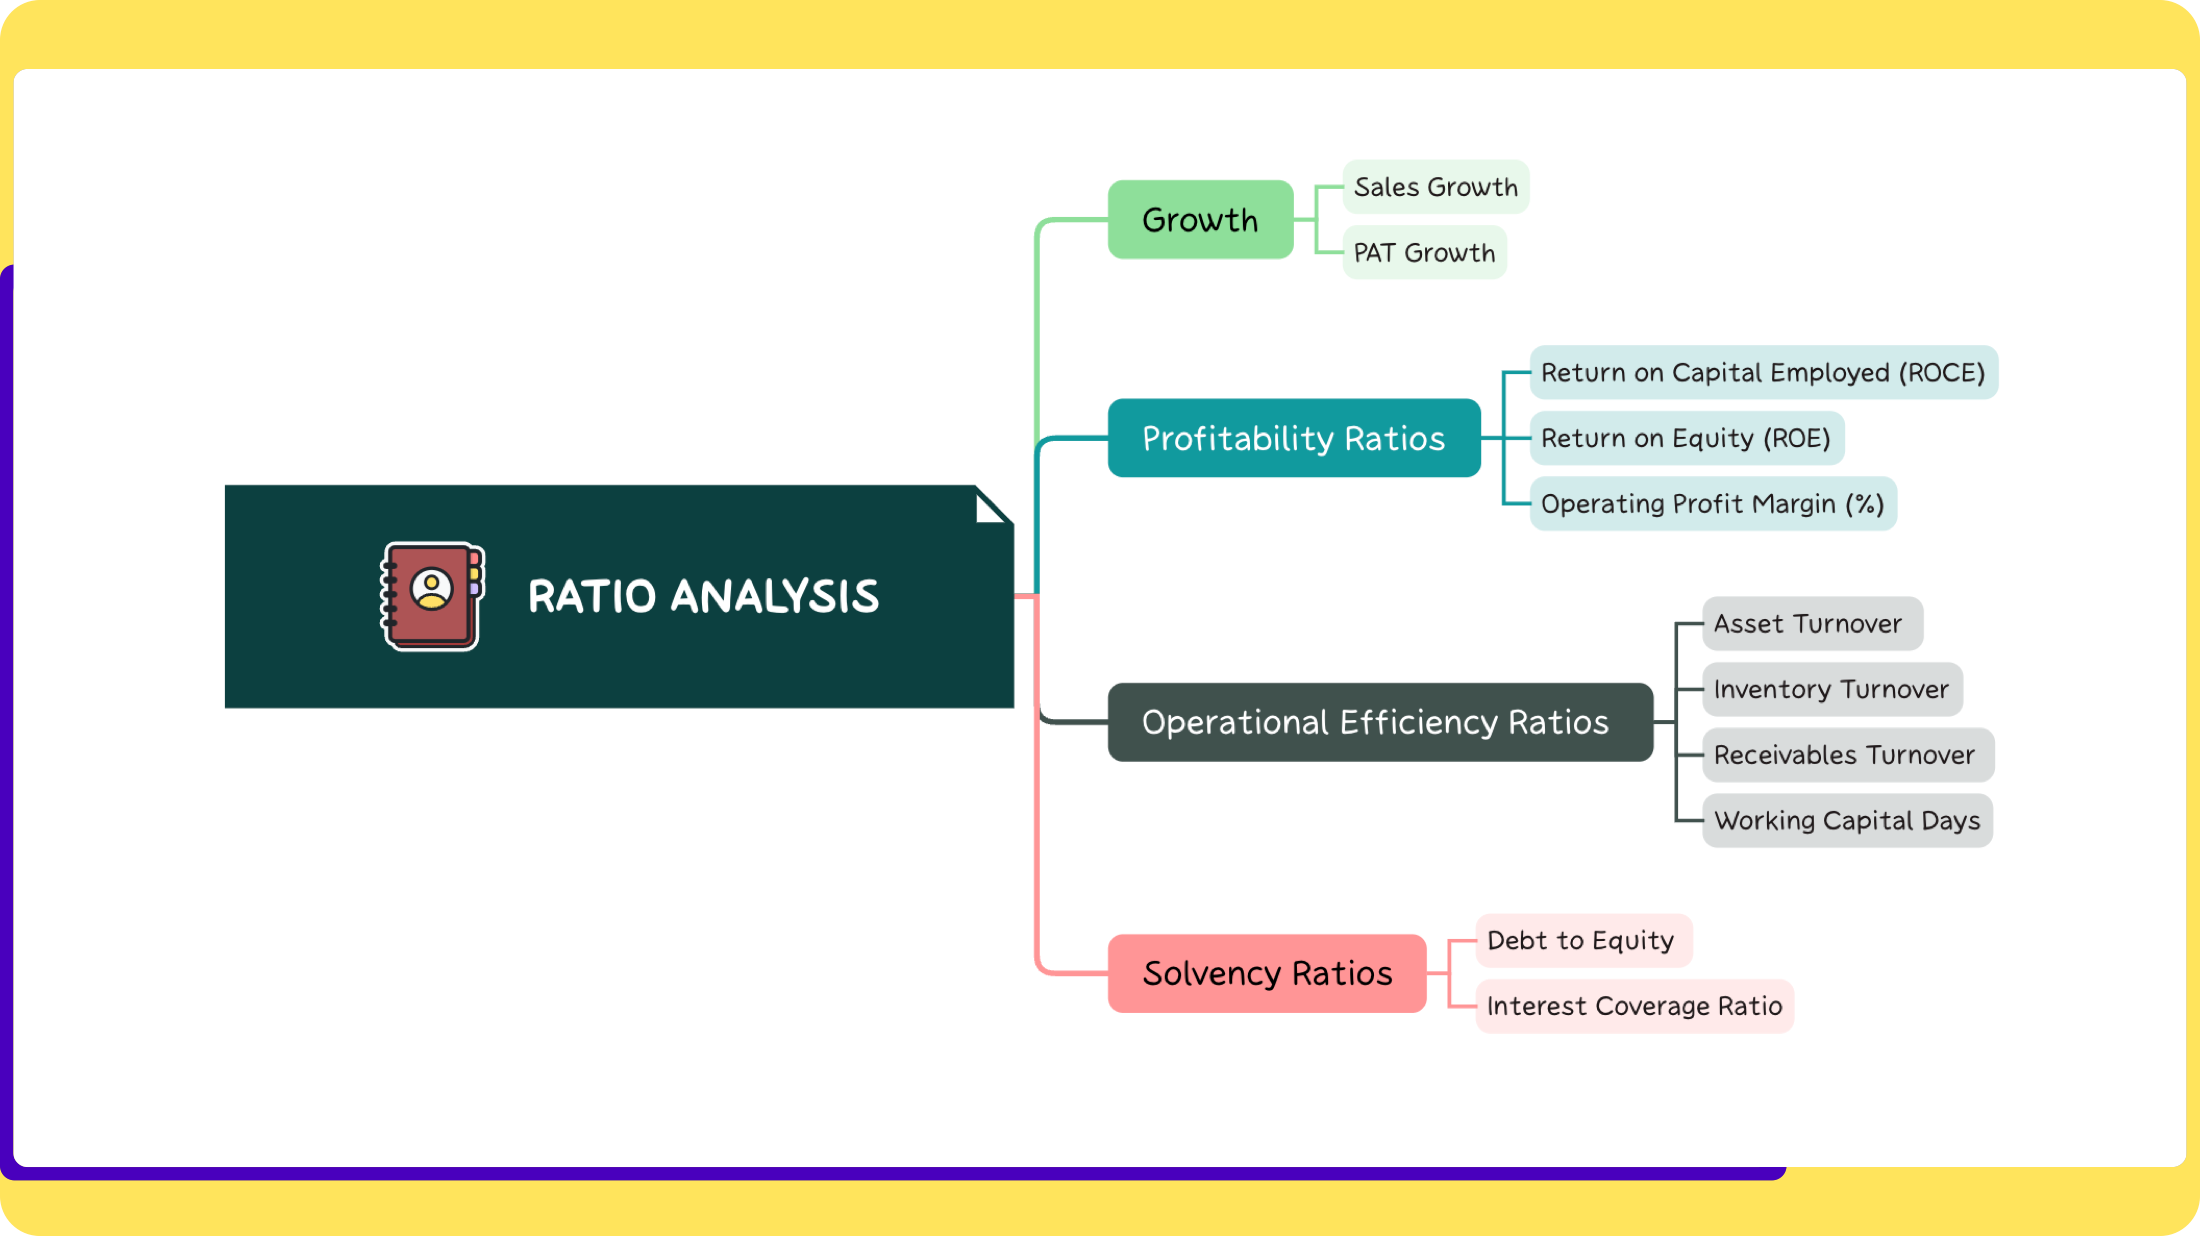
Also, just some ultra-basics: Power cables are usually categorised according to the voltage of the current they can carry.
They are categorised into Low voltage (< 1000 Volts), Medium ( 1 - 36 KV) & High Voltage (36KV+).
Their respective use across the Power Value Chain are illustrated below

With that basic background, Let’s Go! ![]()
- Market cap distribution: Only 4 (20%) of Companies have a Market Cap of 10,000 Cr+, which is unsurprising. Even between those 4 largest companies, the variance in M.Cap is huge (Pareto’s 80/20 principle)
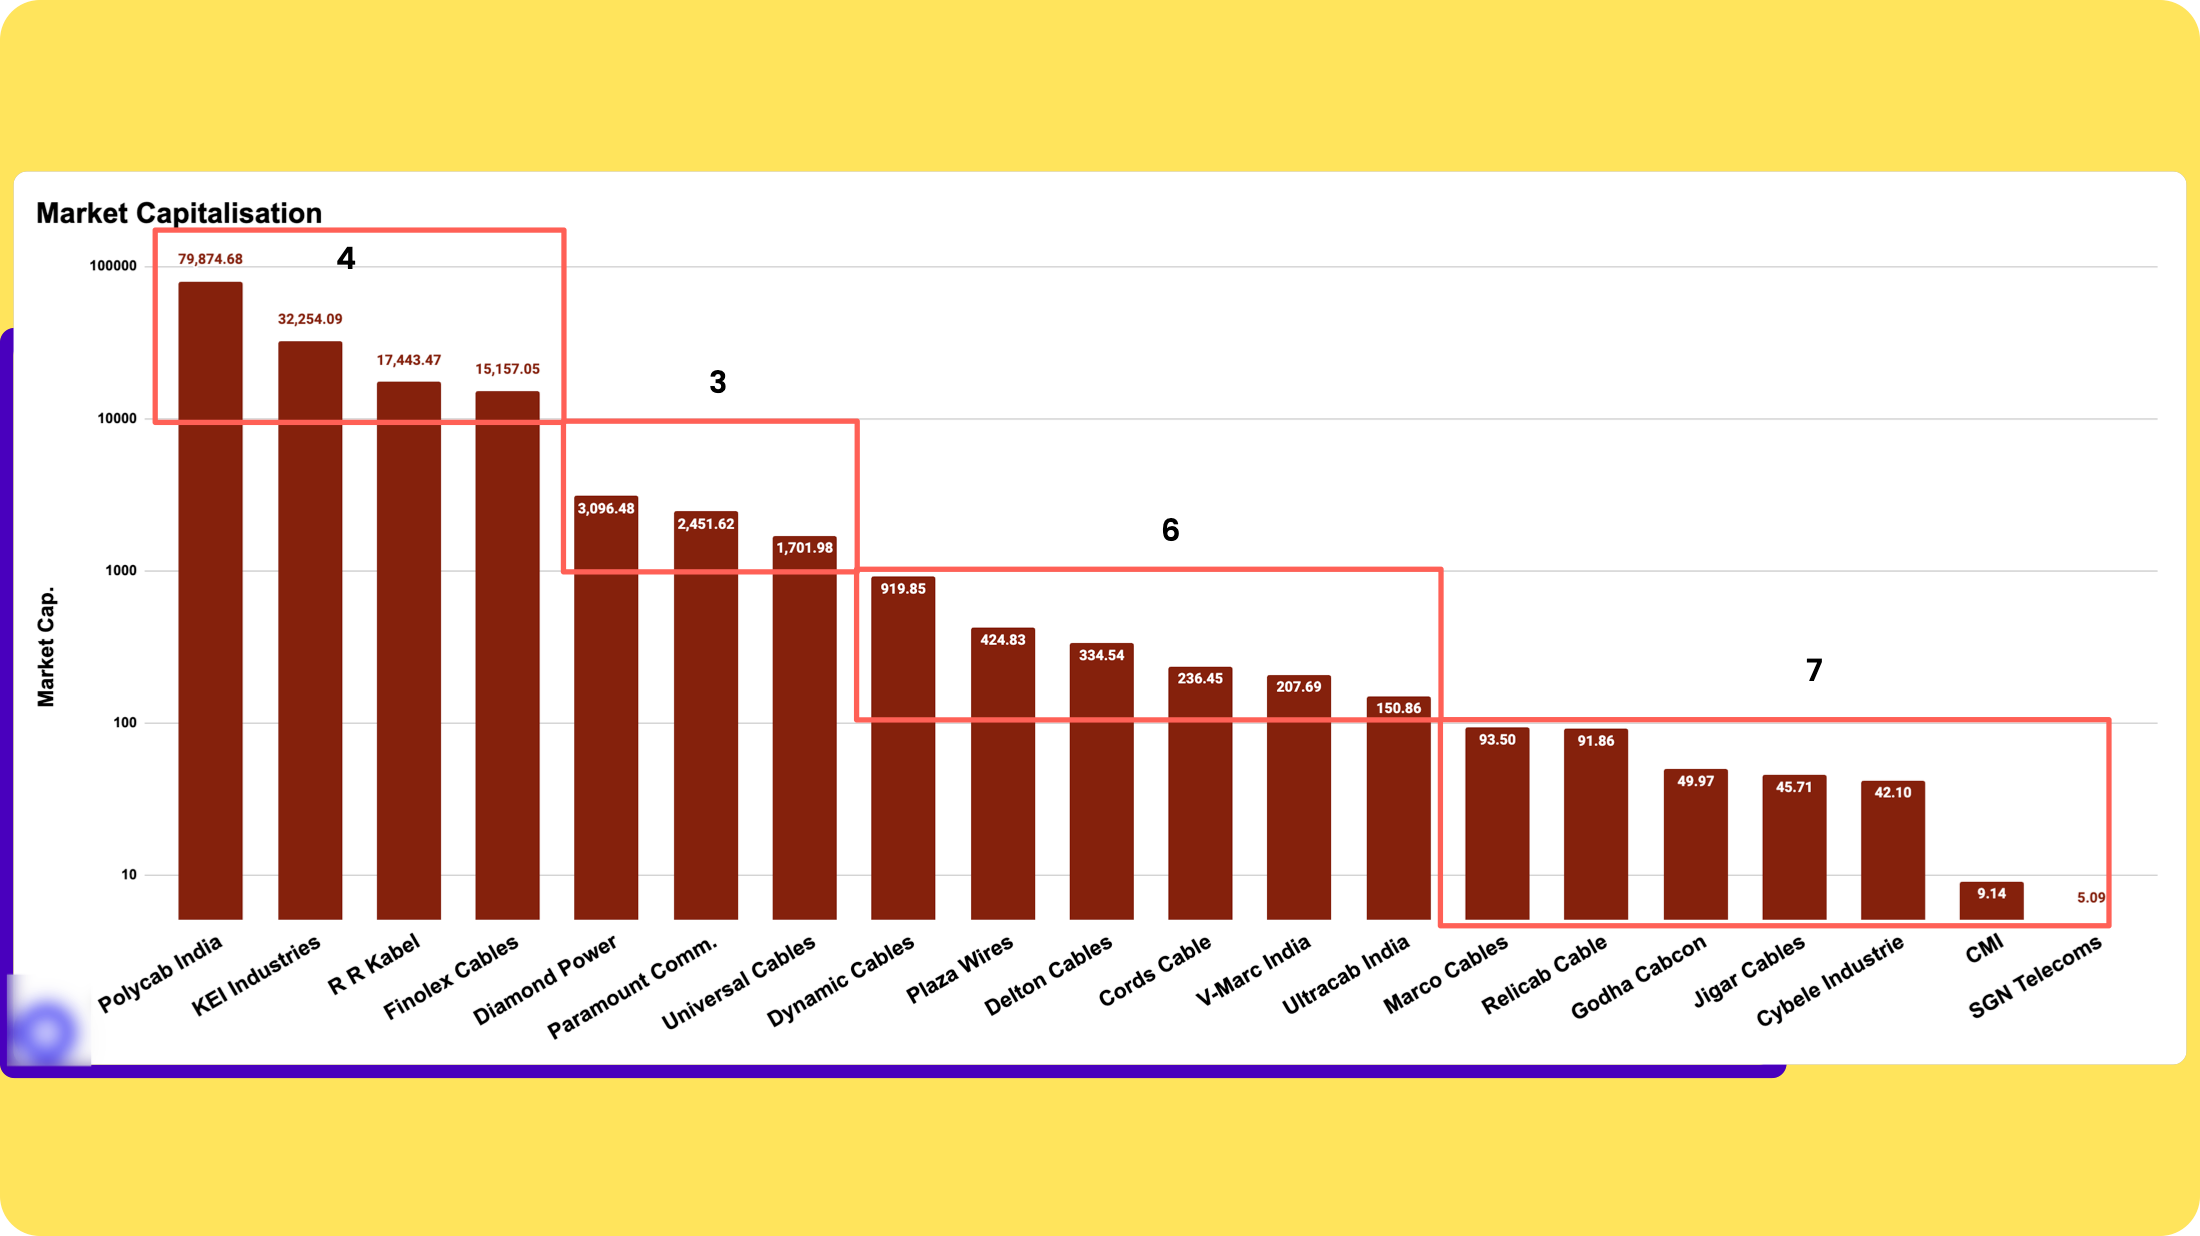
Log scale (Data as of 5th April 2024)
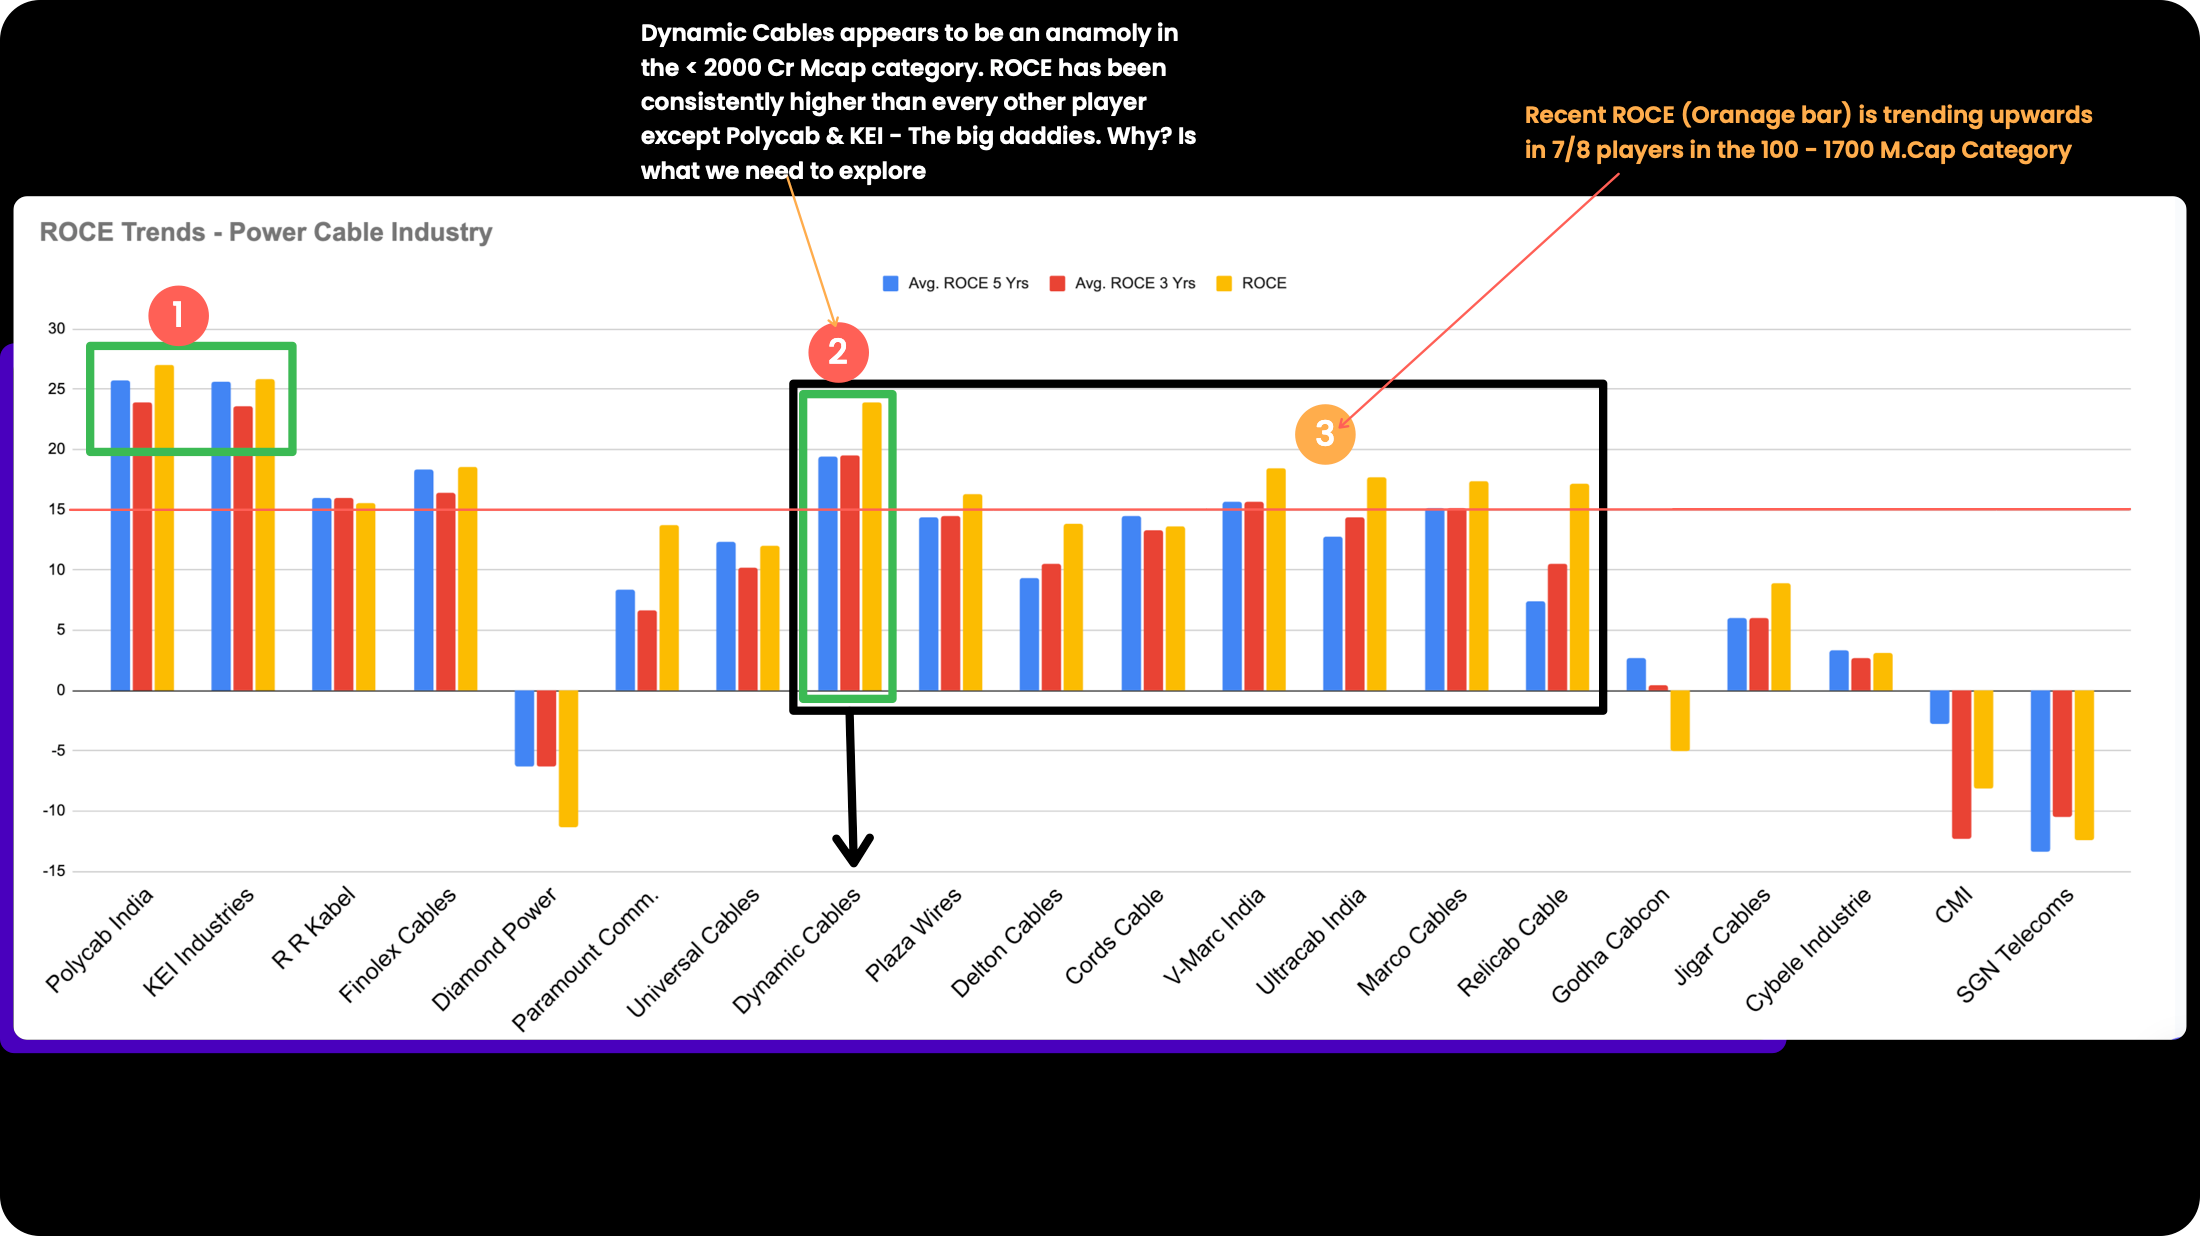
- Does Size Matter? : Data (ROCE last 5 years) suggests that Size matters for the Industry. Larger size begets more efficiencies and economies of scale. There are 3 noteworthy points in the Historical ROCE chart below.
Source: screener.in data | Left to right: Highest Market Cap to lowest.
-
‘Size Matters’! This is evident from the chart below which shows Polycab & KEI seem to have consistently high ROCE, most likely because of their larger size (NOTE: Size should ideally be measured in Gross block terms no M.cap)
-
Dynamic Cables is an anomaly in that it has consistently (last 5 years ROCE) maintained high ROCE vs 18 other peers.
-
The sector is experiencing is positive uptrend (Improving ROCE). Not surprising given the increased spending on the Power/Real Estate/Infra Sectors.
-
Some of the differences in ROCE amongst players may be explained by the Business Models i.e. their B2B vs B2C mix, their product mix etc. That analysis would be a logical next step i.e Performing Deep dive into specific companies
3. Smaller companies have higher Debt & lower Interest Coverage
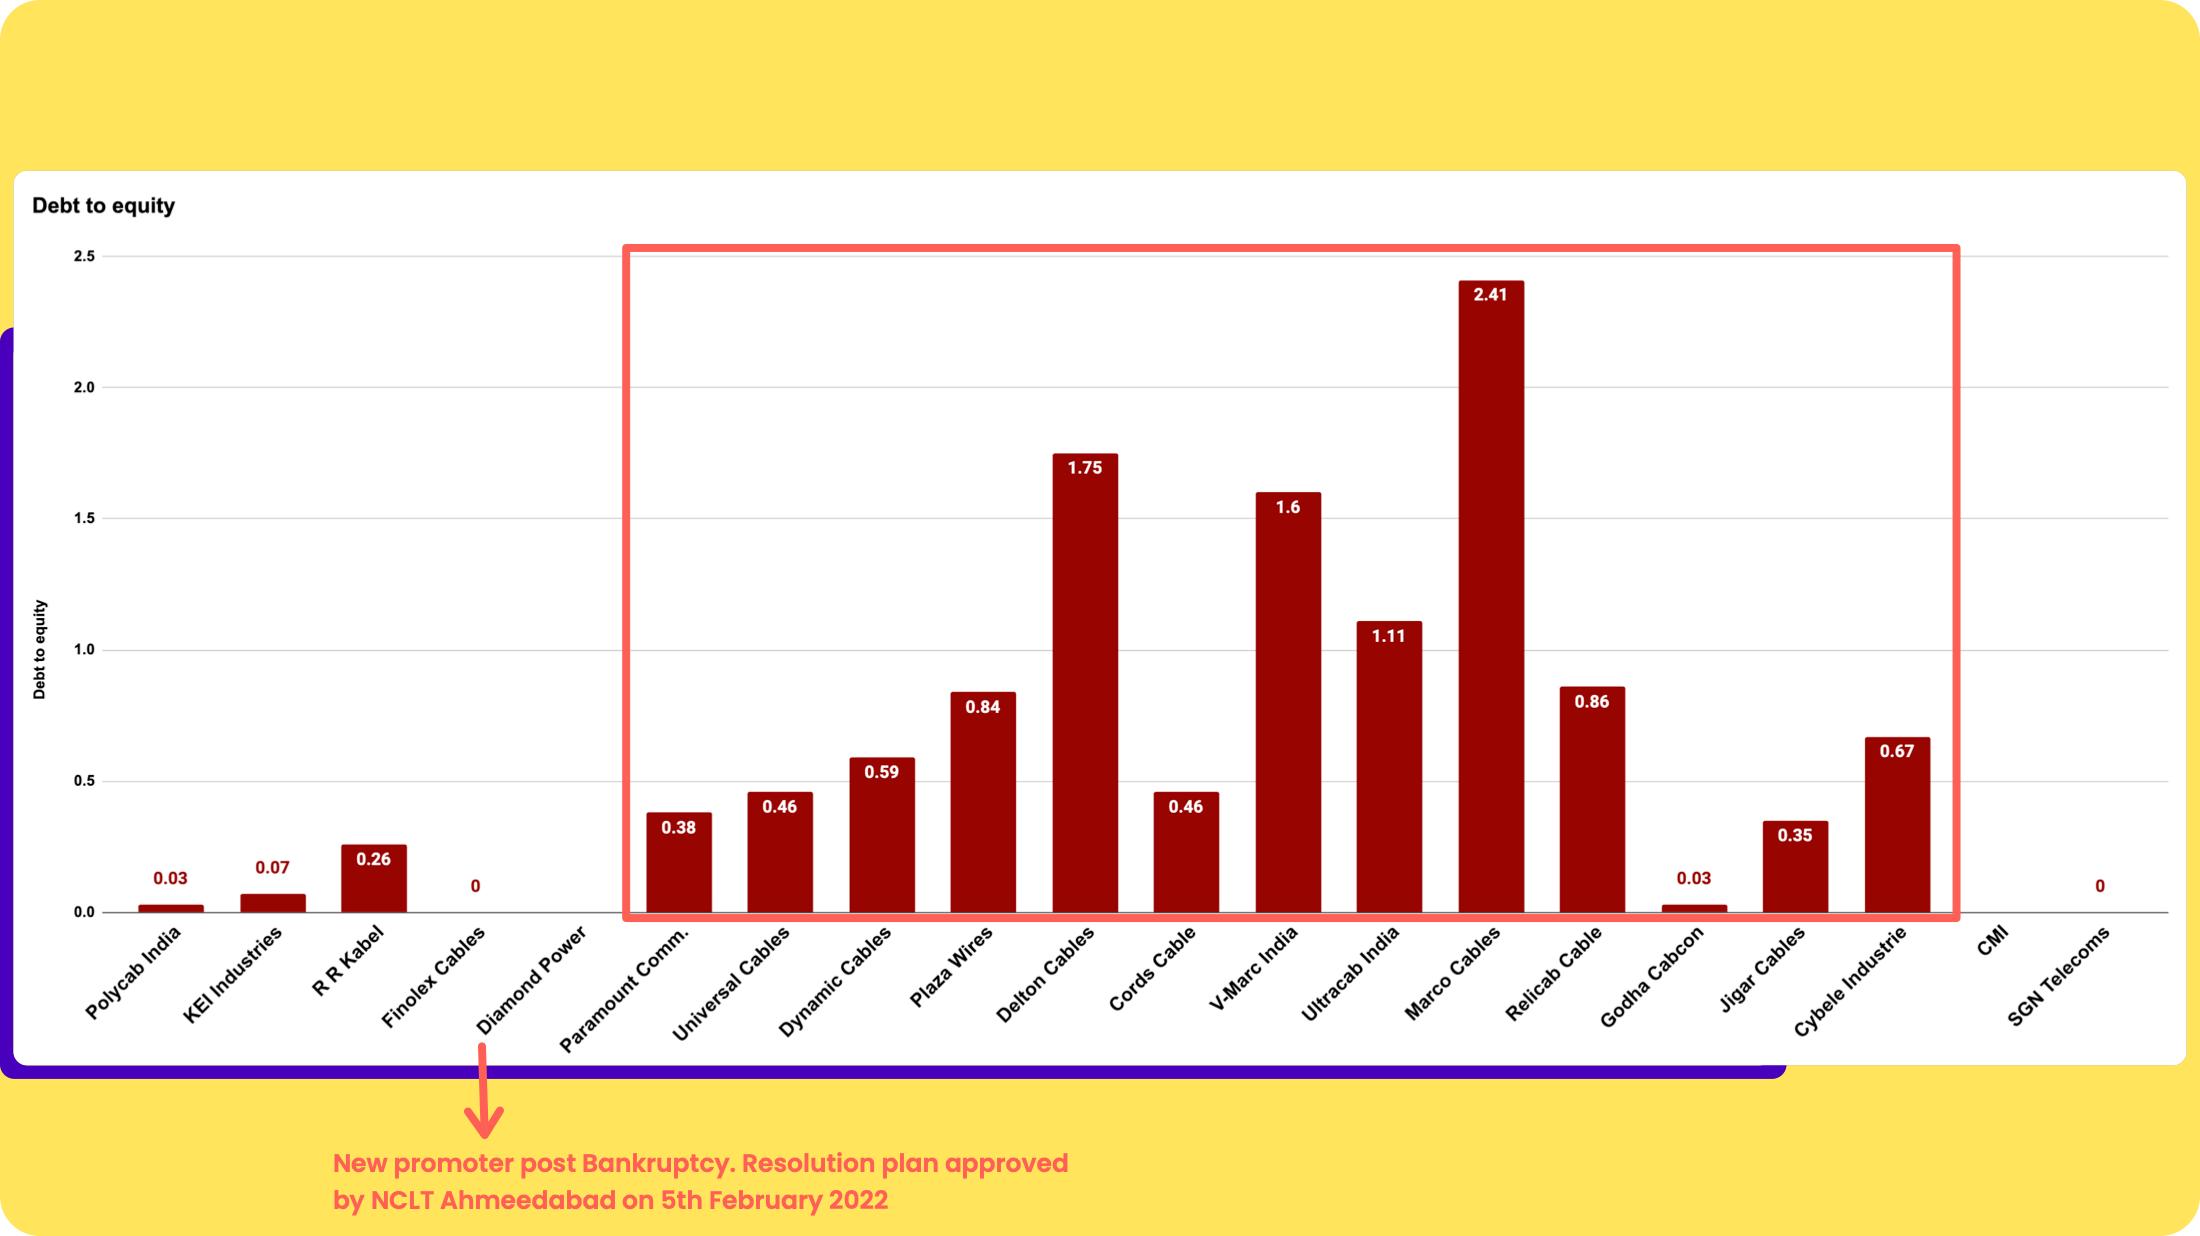
Left to Right: Highest Market Cap to Lowest Market Cap companies in the sector.
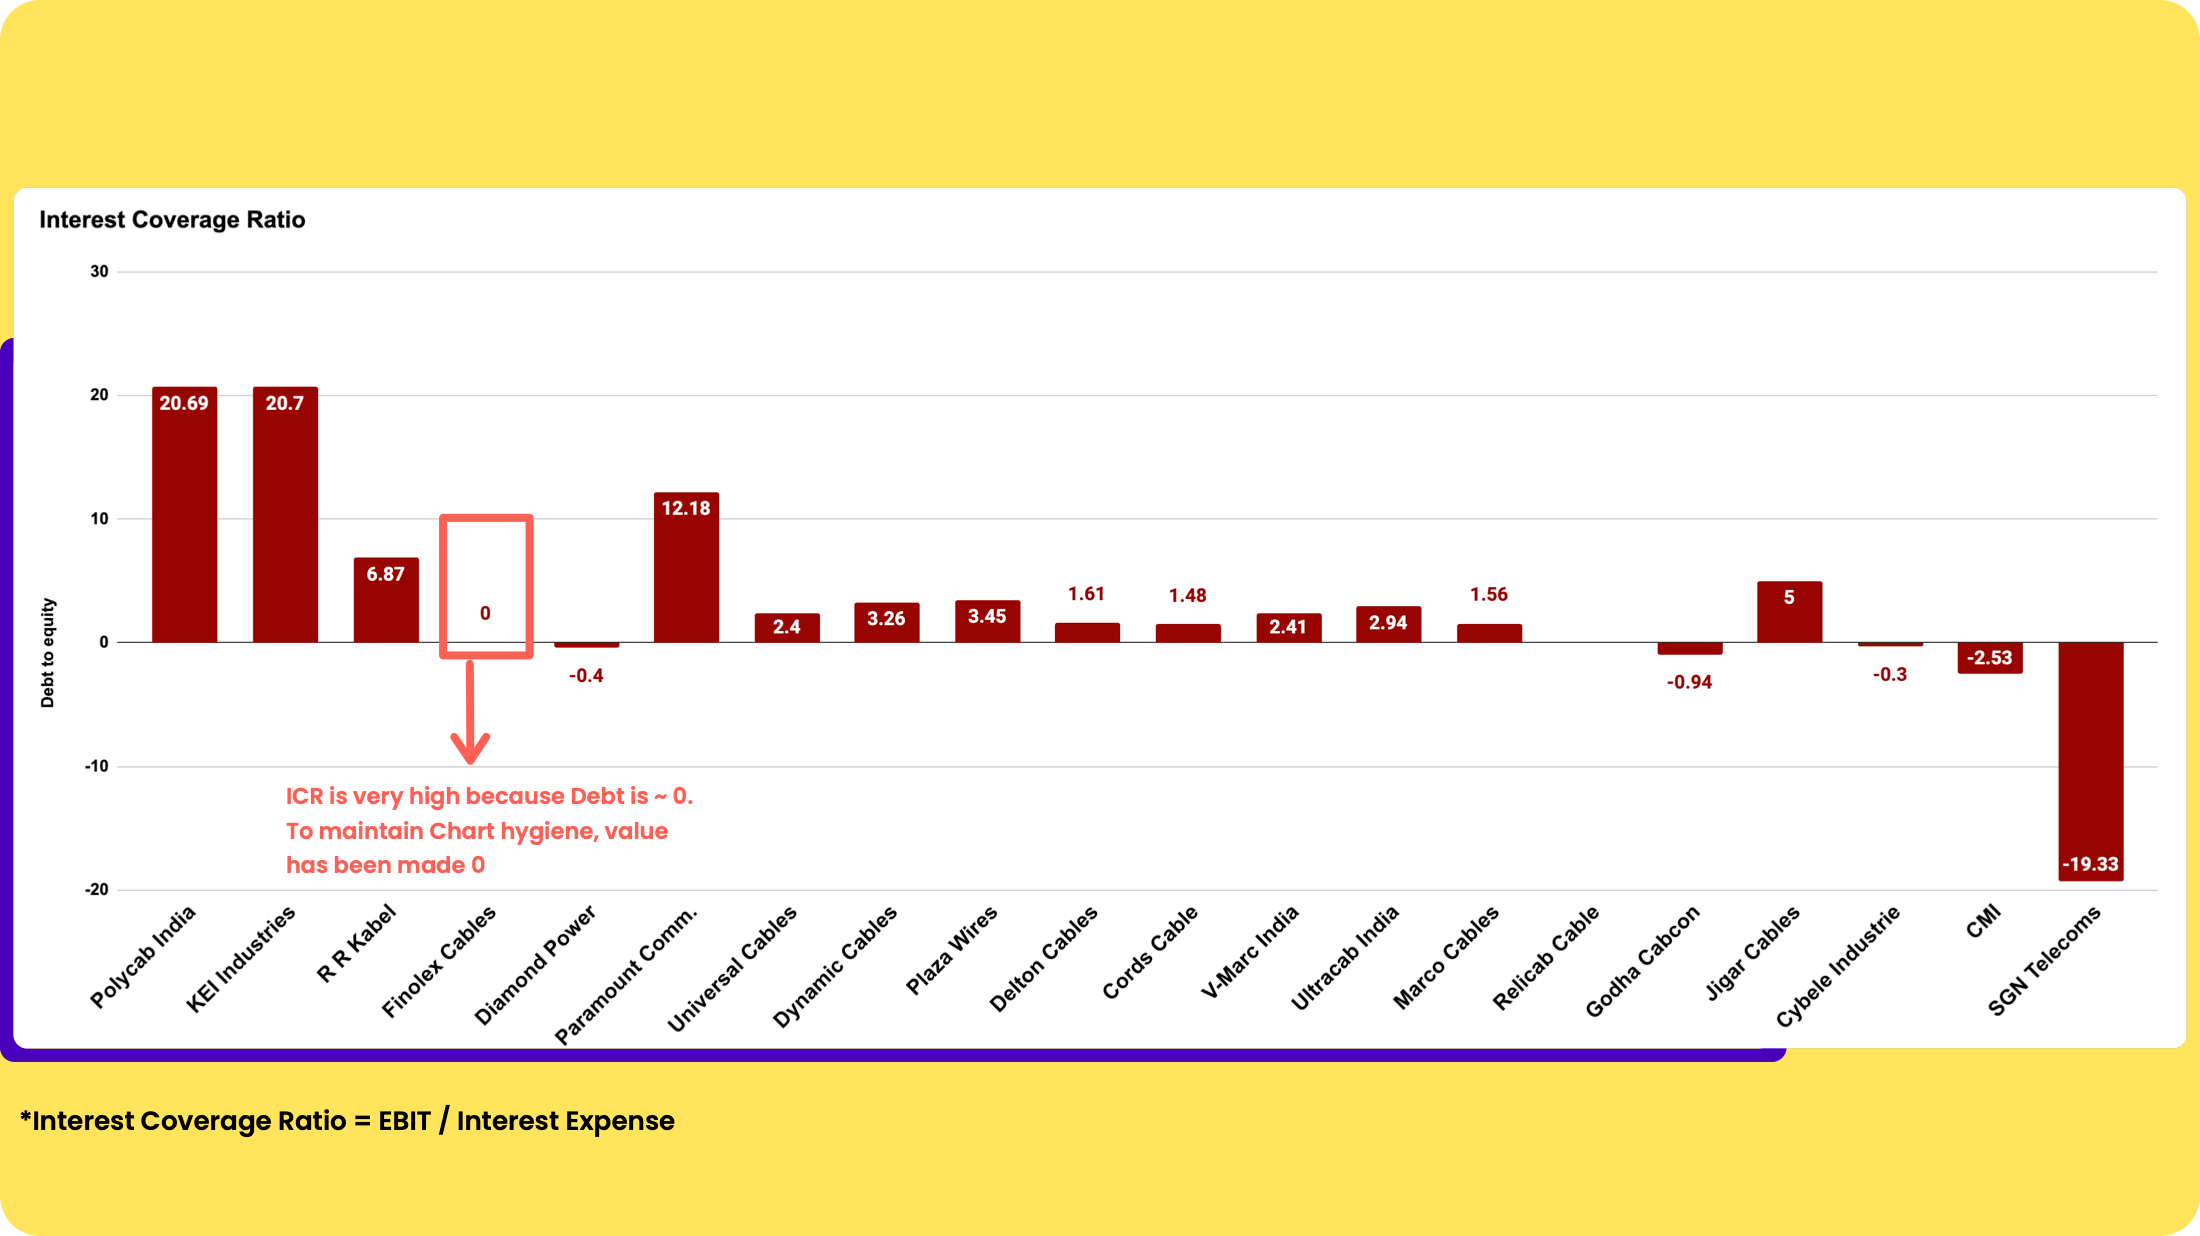
![]() The higher debt for smaller companies is mostly working capital Debt.
The higher debt for smaller companies is mostly working capital Debt.
Working capital days (No. of days to convert working capital to sales) for smaller companies tend to be higher (unsurprisingly). Higher WC days would lead to higher Working capital debt (measured as % of WC to Sales)

- Asset Turnover
Larger players tend to have higher Asset Turnover (Sales / Assets) which means they’re able to squeeze out more rupees in sales from every rupee of assets held.
There are also positive and negative anomalies amongst the pack, as shown below.
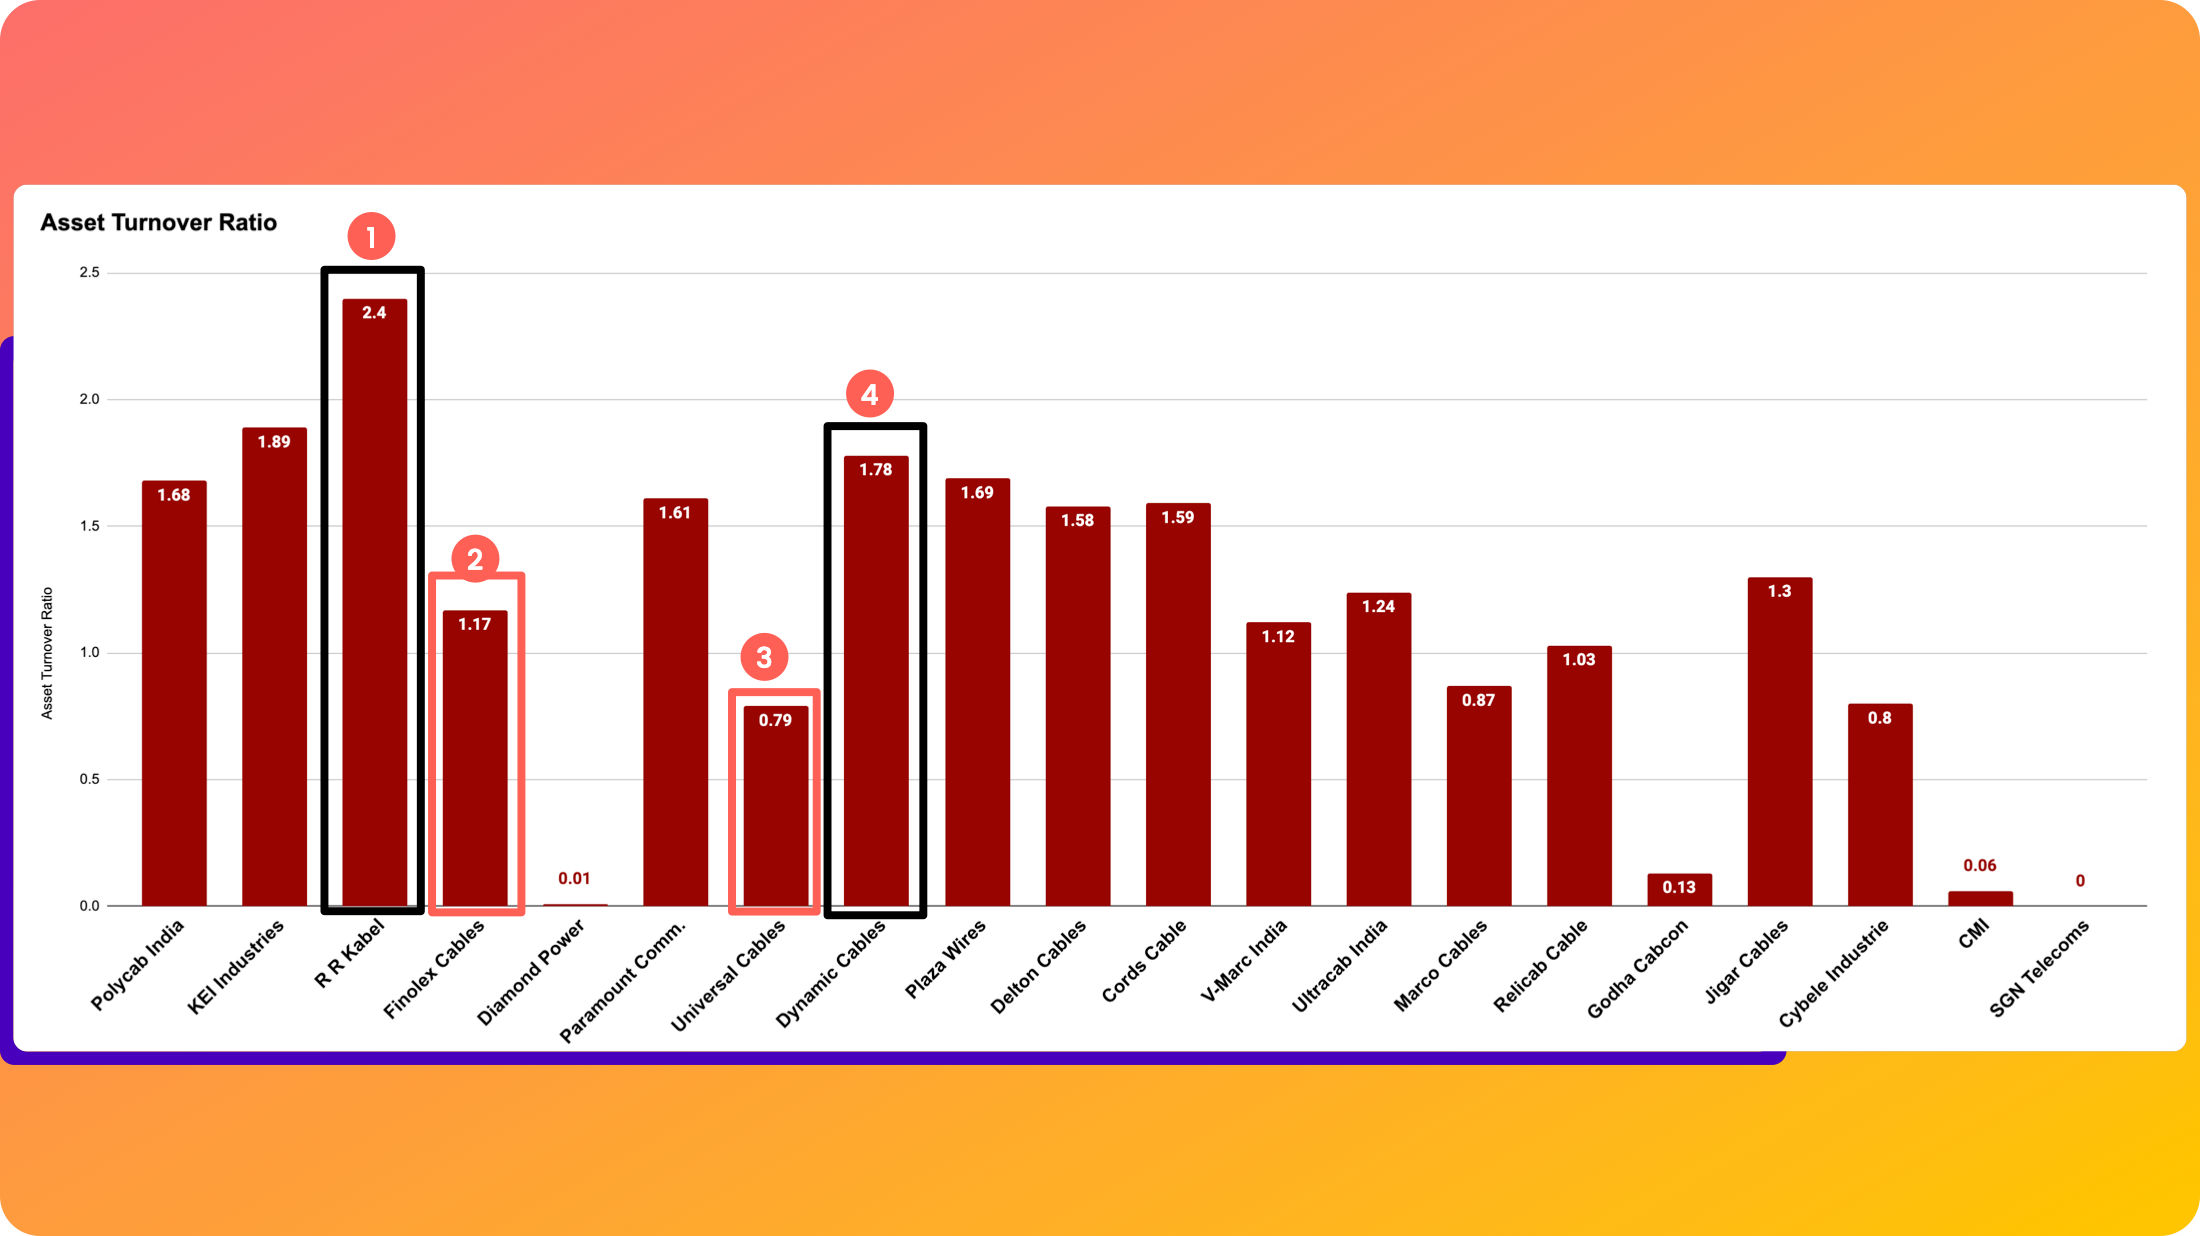
source: Screener.in Data |
RR Kable and Dynamic Cables are examples of positive anomalies.
Finolex and Universal cables are examples of negative anomalies.
At least amongst the top 4 players, FMEG could be the reason why RR Kabel has a notably higher Asset Turnover.
RR Kabel derives 11% of its Revenues from the FMEG Segment - Fans, lights, switches etc whereas Polycab derives ~8% of its Revenue (9MFY24) from FMEG, Finolex (< 5% Revenue from FMEG) whereas KEI is NOT present in FMEG at all.
- Operating Profit Margin (%) [EBIT / SALES]

Operating profit Margin (%)
Dynamic cables and KEI Industries have the most consistent margins across timeframes and Ultracab & Relicab (< 200 Cr M.Cap) have shown the sharpest improvements in OPM (%).
Finolex’s shrinking margins could be a sign of shrinking pricing power (assuming it has some, to begin with) or poor operating expenses management etc.
Whatever the root cause, shrinking margins make markets unhappy. This may be one (of the many) reasons why Finolex trades at a significantly lower PEx (< 26X) vs peers.
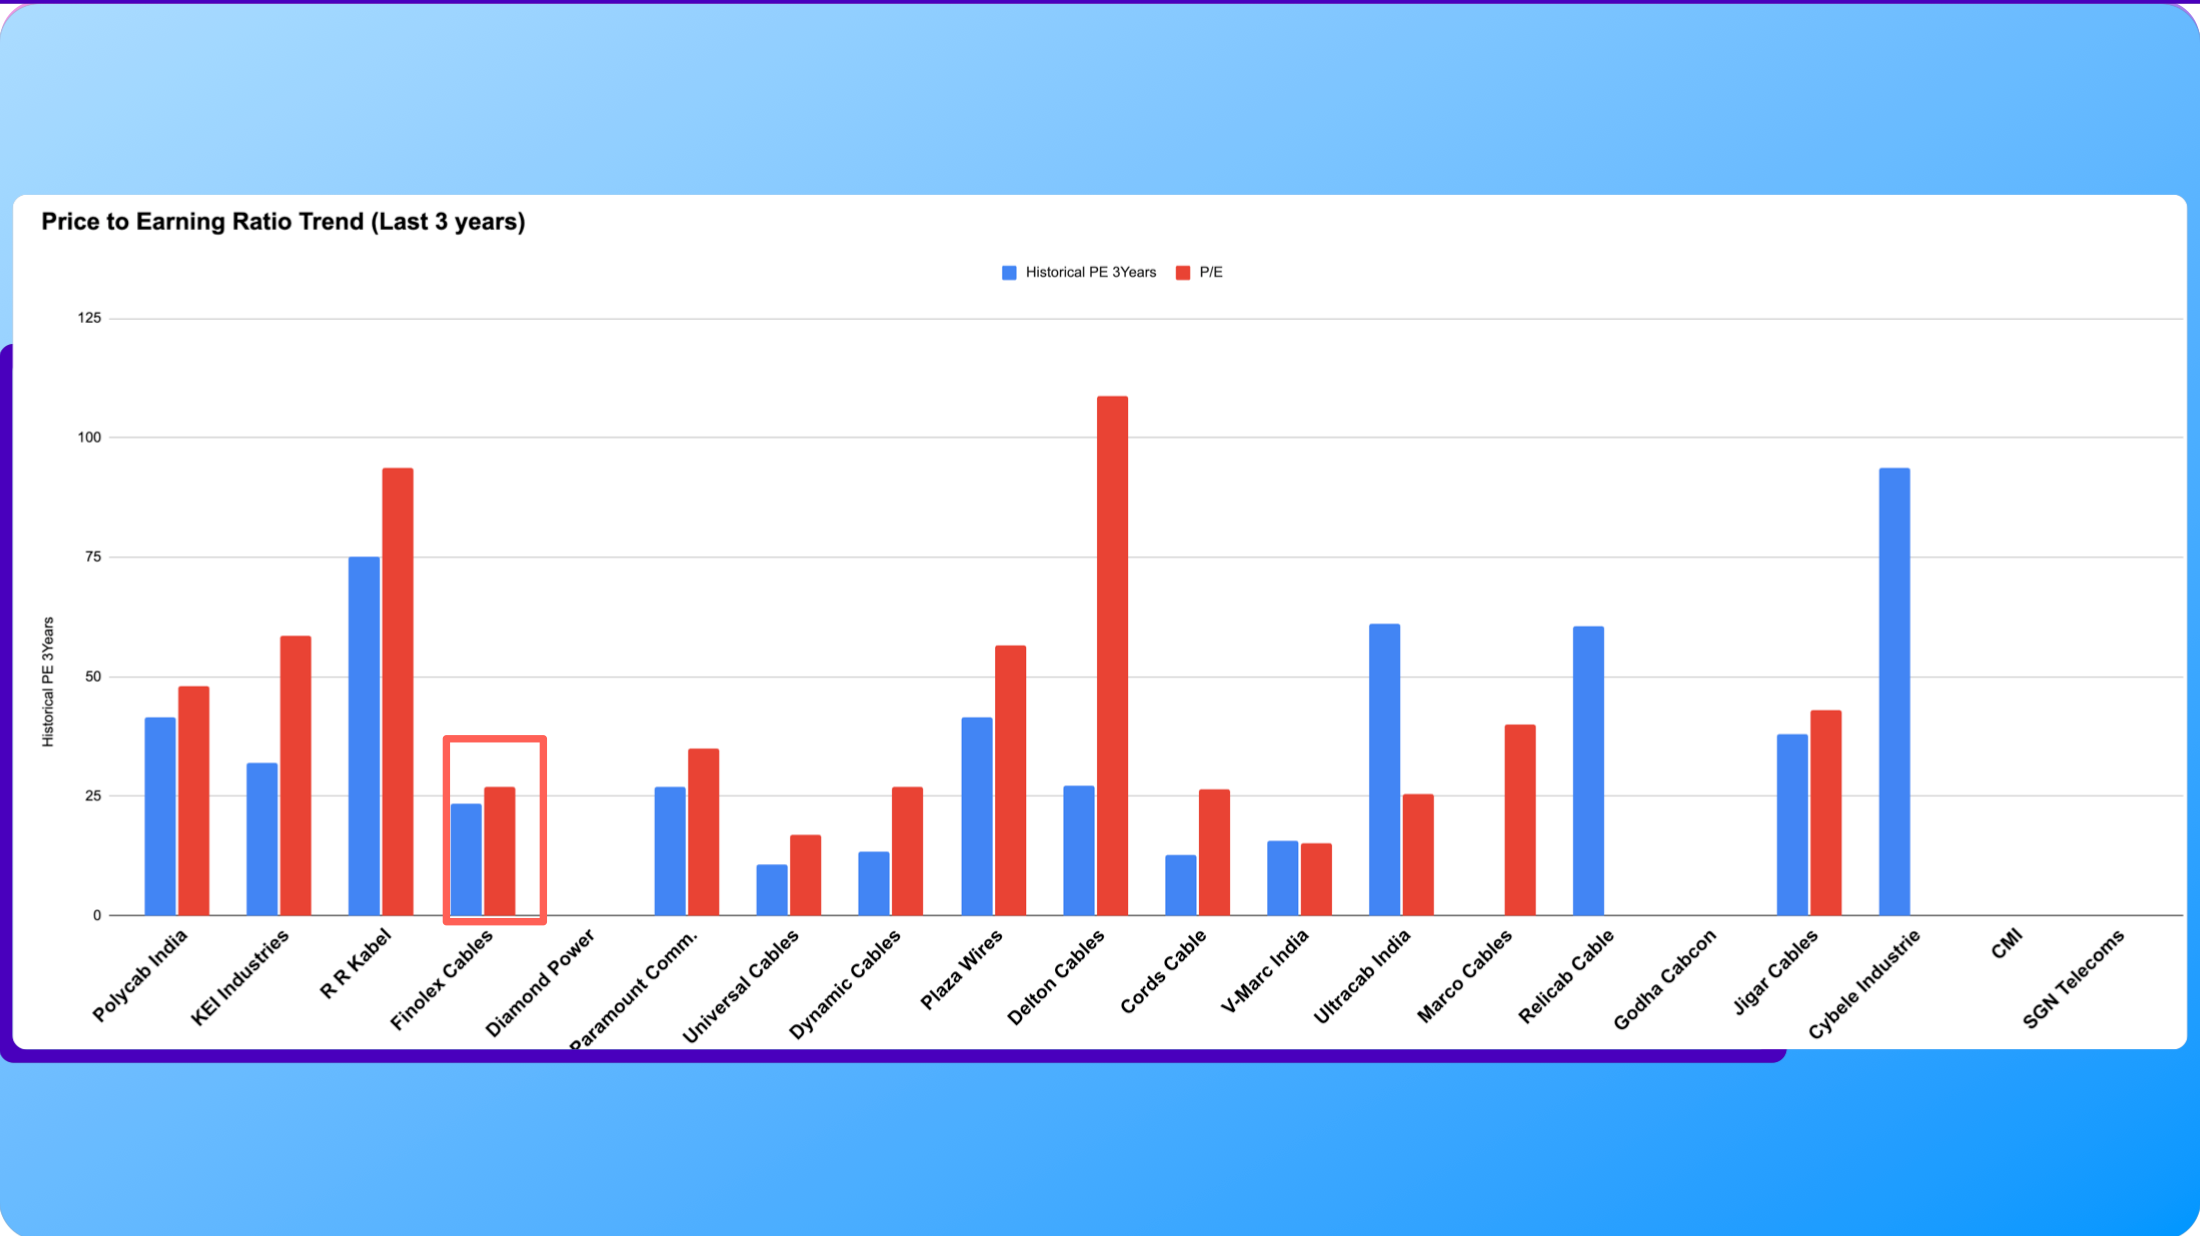
The above chart also displays one of the hallmarks of Wealth creation in the stock markets: P/E Re-rating. And when it rains, it pours!
Every single (almost) co’ in the sector has undergone significant re-rating (Exceptions: V-Marc & Ultracab) and judging by the the multiples, it’s unlikely there is room for further expansion, at least for most companies in our cohort.
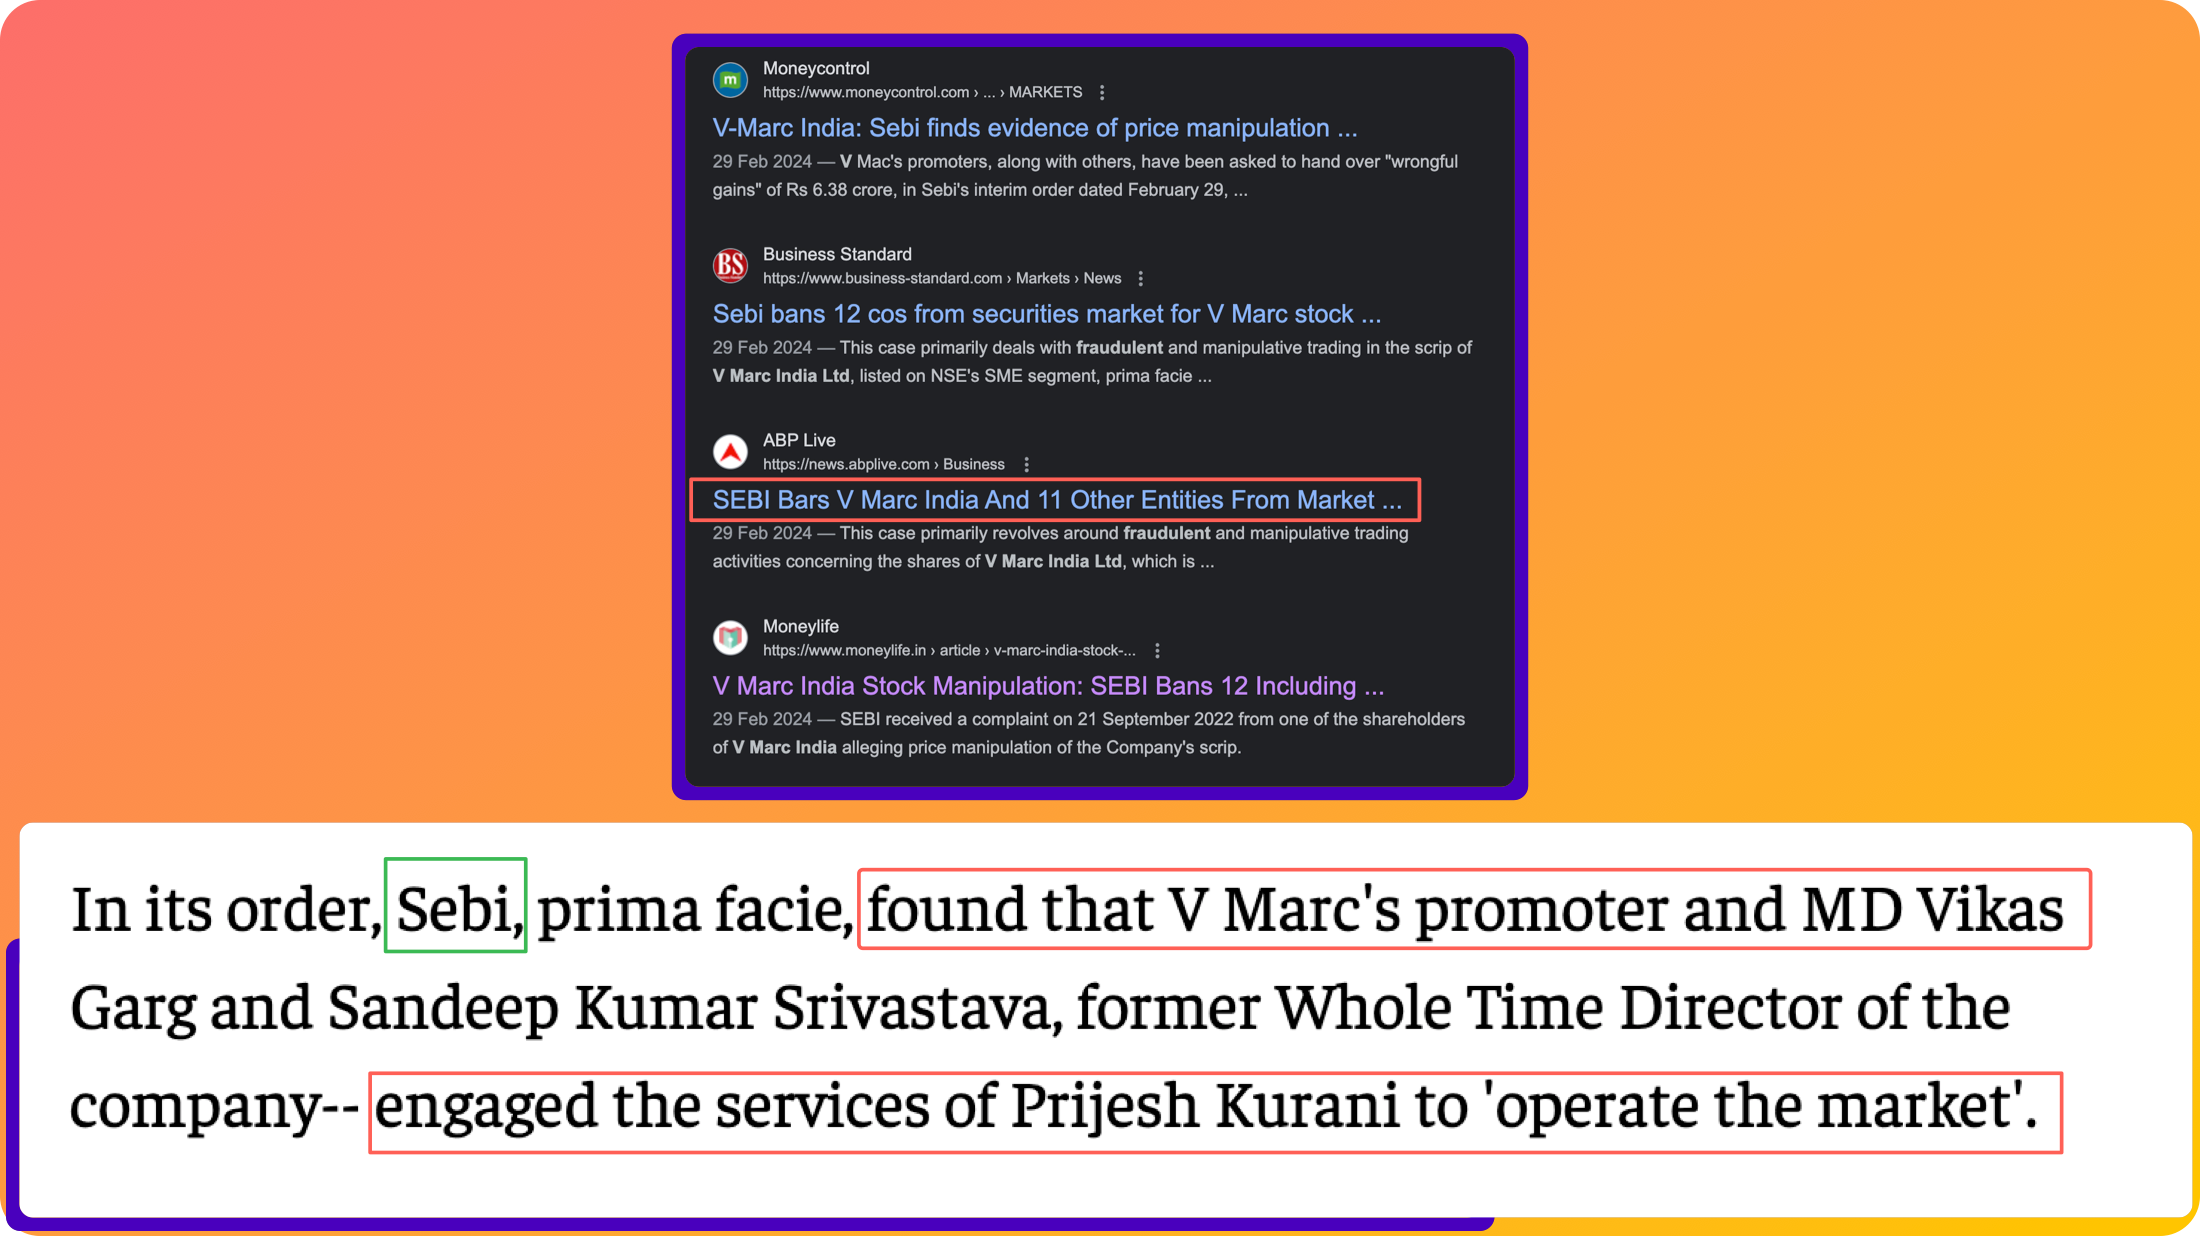
As for Why V-Marc India trades at such a low valuation? It’s just Fraud baby! ![]()
- Sales / EPS Growth
Finally, the growth metrics. Firstly, the last 3 years Avg growth may not be the best metric for visualising/judging the recent change in Sales/EPS, however, using the data below there are 2 key observations we would like to comment on.
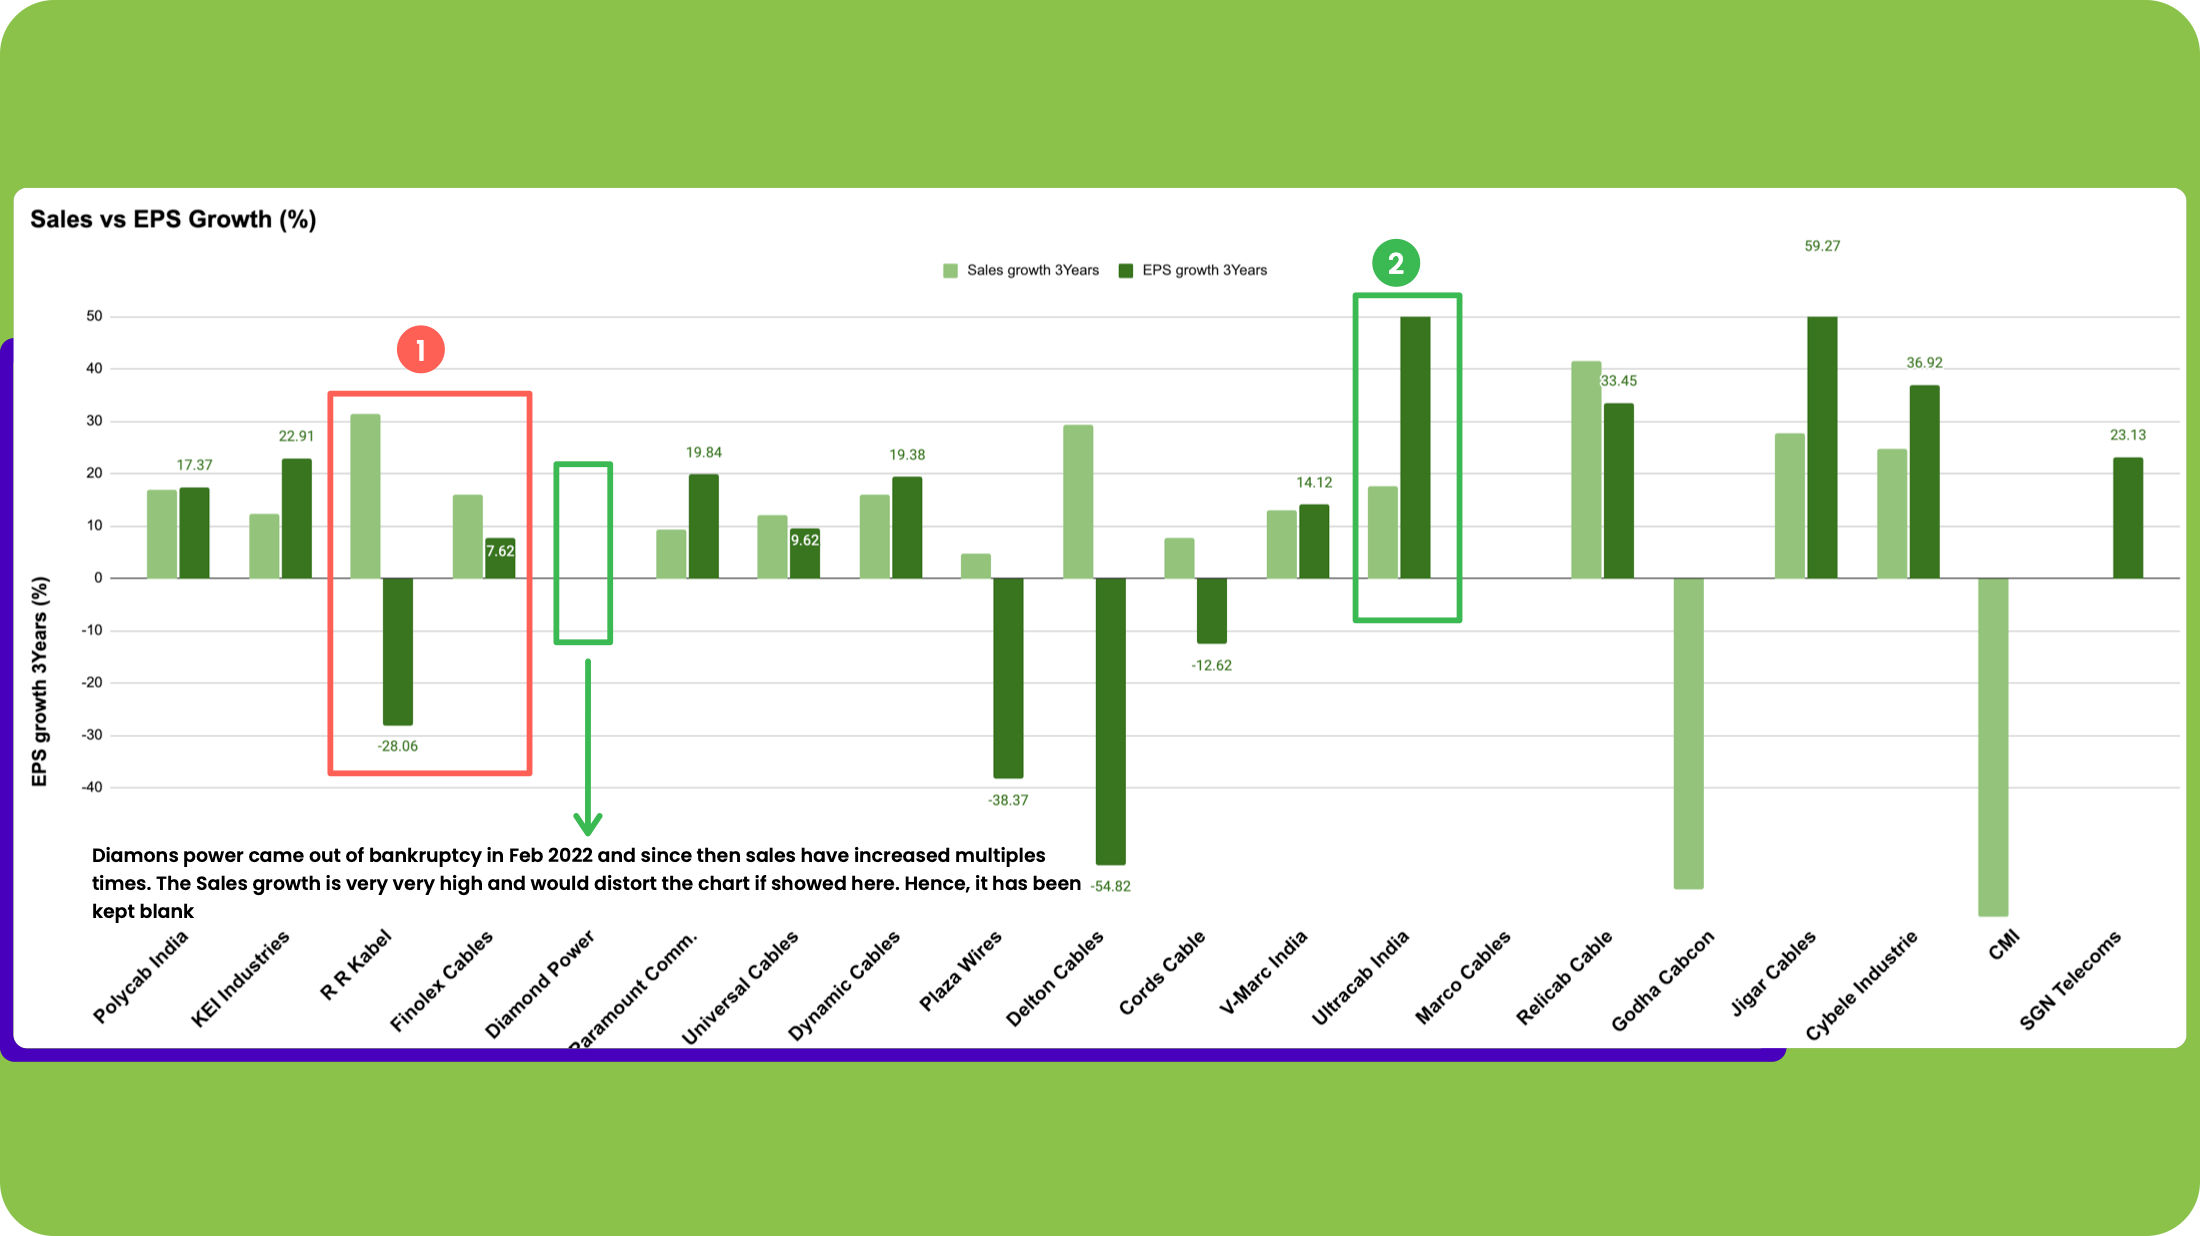
![]() RR Kabel and Finolex have not been able to grow EPS as fast as Sales (why? Worth exploring in the next step: co’ wise research)
RR Kabel and Finolex have not been able to grow EPS as fast as Sales (why? Worth exploring in the next step: co’ wise research)
![]() Ultracab has shown EPS growth much significantly higher than Sales (including Jigar cables & Cybele Industries)
Ultracab has shown EPS growth much significantly higher than Sales (including Jigar cables & Cybele Industries)
- 1 Year stock price Returns
Want to guess which stocks gave the highest returns in the last 1 year? (Not that it has any predictive value). Here’s the jaw-dropping data :
![]() 7 / 20 Stocks gave a 100% + Return
7 / 20 Stocks gave a 100% + Return
![]() 9/20 Stocks gave an 80%+ Return
9/20 Stocks gave an 80%+ Return
This reminds of some Key lessons we can learn/re-learn from the stock price behaviour of stocks/sectors :
![]() If you get the sector right, the probability of making satisfactory returns goes up!
If you get the sector right, the probability of making satisfactory returns goes up!
![]() When a Sector Turns, the best stocks in the sector rise at first and as the cycle continues, the relatively worse (sometimes smaller) players tend to do better than even the best companies (returns wise) because of the delta-from Shit to hit!
When a Sector Turns, the best stocks in the sector rise at first and as the cycle continues, the relatively worse (sometimes smaller) players tend to do better than even the best companies (returns wise) because of the delta-from Shit to hit!

Delton Cable surely has my attention and curiosity. The question is: Is it another pump or Dump or is it a special business? Should we find out more?
Tell me in the poll below because a logical next step in my opinion (you can share yours in the comments) is doing a deep dive on any 3, under 2000 Cr Market Cap companies and I need your help to decide ![]() which ones.
which ones.
Just name your Top pick ![]() Go !!
Go !!
- Universal Cables
- Paramount Communications
- Dynamic Cables
- Finolex Cables
- Ultracab
0
voters
Hope this was insightful, would love to hear your thoughts
Rahul
![]()
8 Likes
Great analysis but couple of things:
1- I see Havell’s name missing. They are 3rd largest player after Polycab and KEI
2- This analysis can and should be applied to any sector where you see fragmented competitive landscape. Larger players will always have advantage due to their scale and quality of management talent (low cost debt, leverage over suppliers, bargaining power with buyers, lower per unit fixed cost etc). Smaller players in majority of the cases will not have the same advantages and as a result their financial and operating metrics will lag their larger peers.
Most retail investors prefer small caps player due to low base effects, under-ownership and expectations for business turnaround which leads to highly rewarding stock price appreciation. Larger cap companies on the other hand are considered to be well-discovered, well-owned and with very limited upside on operational/valuation/financial metric and market share gain, which means low but steady returns. A company with 5% market share can easily increase it by 50-60% while the one with 50% market share will find it difficult to grow by 10-15%.
That said, one can sleep peacefully with larger cap players knowing that there are very less chances they will go out of business. Same, however, can’t be said about smaller companies (no matter how good they may appear on financial/operational metrics).
So beyond the metrics, one should also consider their time horizon, return expectations, and risk appetite while making decisions on which stocks they want to pick.
7 Likes
Kei Industries - A Good example of how PE-Rating has happened over last 2 years
• A Great Sector
• Strong Tailwinds
• Good Track Record of Company 's Financials
• A Consistent Performer !!
2 Likes
Can anyone throw light on following questions on KEI -
-
What is competitive advantage for players like KEI in global market? Essentially what is the export opportunity for the company?
-
EHV seems like technological differentiation that company have. Who are the main customers here?
-
Does any player in this Indian sector do customise manufacturing?
2 Likes
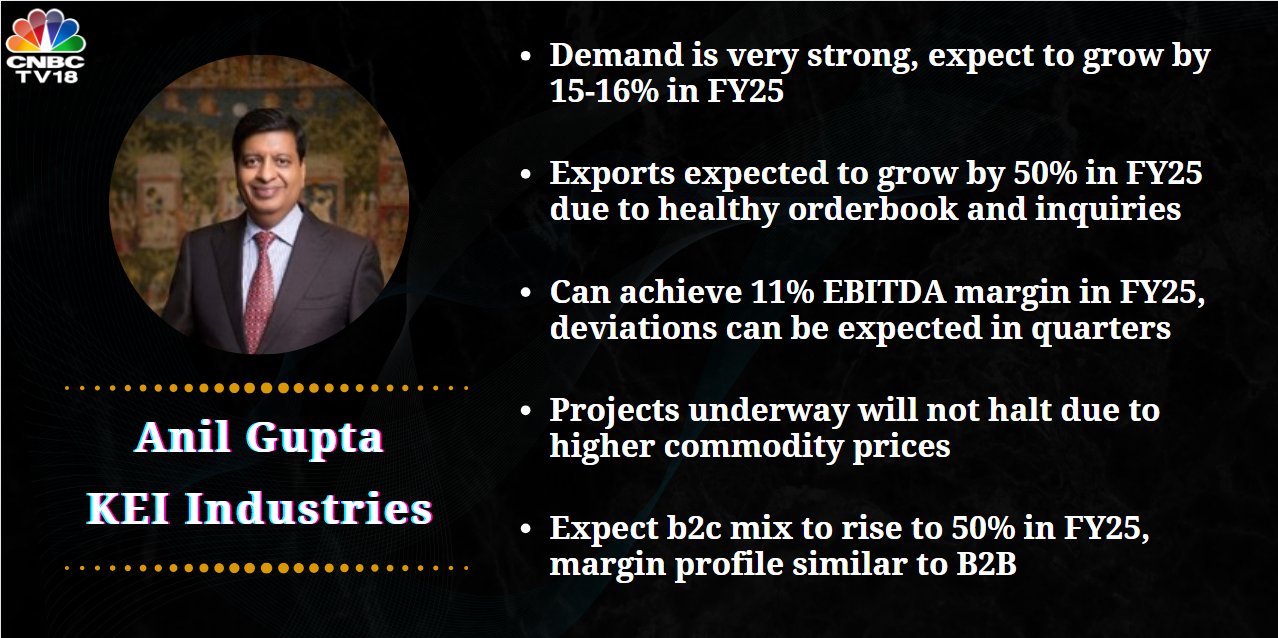
EBITDA margin is 10.5%, expecting 11% for FY 25
Net Profit grown 22% YOY to 168.4 Cr
B2C business is picking up (46% to 50% increase expected for FY25) - helps in cash flow due to faster order execution
4 Likes
How much percentage of business KEI gets from Govt orders? From Central as well as State? And how much of their high tension cables are for power and railway business? This will help in understand , how much it will be affected by Govt change or Govt policy changes?
Hi Mudit,
They generated around 16% from HT cables in FY24 and 7 odd % from EHV which would primarily linked to the power capex. The rest of the business would be LT, HW/WW, Exports. I think they had capacity constraints which is why exports was not as strong. So if India assuming was to slowdown in power capex then they should be able to at least capture somewhat of the slowdown by supplying to the US which is also upgrading their grid. Middle-East would be the other opportunity.
1 Like
Yeah Thanks. My concern was due to significant upside in polycab share price and compared to that KEI has not recovered by similar magnitude. So may be market is making clear distinction between polycab and KEI here.
KEI fell alot lower than Polycab on 4th June so that is why there was nothing to rebound from whereas Polycab suffered much more pain in the downturn of the market
2 Likes
I fail to understand what justifies a PE of ~70 for a company giving a sales guidance of 16-17% (Optimistic case ~20%) and similar PAT growth. I really like how the company has grown over the last 5 years and management attitude. But can anyone provide guidance on exit framework strategies here. All my reading says we should never sell a winner, but what if the PE is off the charts and any, even slightly, disappointing result can cause a meaningful correction in future. Looking for guidance here.
Disc. Invested since a long time
You are majorly paying for:
- A management that is known for keeping their promises. Mr. Anil Gupta gives very measured responses in all the interviews.
- The infra push happening in India. I am also including power reforms. Till the company has growth visibility, people would be wiling to pay up for the stock. The company is also expanding their current capacity which is indicative of the future growth prospects.
- If my information is correct, KEI is the only player or one of the two, which is providing EHV cable(s) having capacity of upto 440 KV. Many players are providing cables of upto 220 KV capacity, but not 440 KV. Smart cities require these type of cables for provisioning of electricity. This is also an export contributor.
As far as exit criteria is concerned, I have not came across any mathematical framework that would provide a timely exit. Classic example would be that of Asian Paints which has always commanded premium inspite of sluggish growth in the recent years.
The only exit criteria that I consider as a reasonably well contoured is stage analysis and thus, be on the look out for movement from stage 2 to 3, implemented via a trailing stop loss adjusted on a weekly basis. Basis for exit criteria is the real life experience of fundamentals always trailing technicals. Experienced this phenomenon in Gujarat Fluorochemicals, Alkyl Amines and IEX.
3 Likes
One of the exit strategy is the whole sector doing unwell or the utilisation capacity is 100% and sales are flat and management won’t do capex…
But that seems highly unlikely.Cables and wires are proxy to Railways, Industries,power sectors till next 10 years.
Valid question @Raghav_Gupta. KEI has an A class management, good growth visibility for next few years, solid moat in UHV cables and industry having tailwinds. Perfect storm (+ve one) to prop up PE. Look at the entire industry - Polycab, KEI, Universal, Finolex - all of them have been related in the last 18-24 months. Sales and Profit growth CAGR for last 3Y > 5Y > 10Y for all of them which clearly indicates the sector is in tailwinds.
I agree with @Parakh on using some technical indicators to choose an exit. Only way to sleep peacefully if you have a high allocation of your portfolio to cables sector.
1 Like
Hi…I got this stage analysis of going into stage 3 from current stage 2…But
trailing stop loss adjusted on weekly basis,kindly elaborate
Book: Stan Weinstein’s Secrets For Profiting in Bull and Bear Markets
Chapter: 6
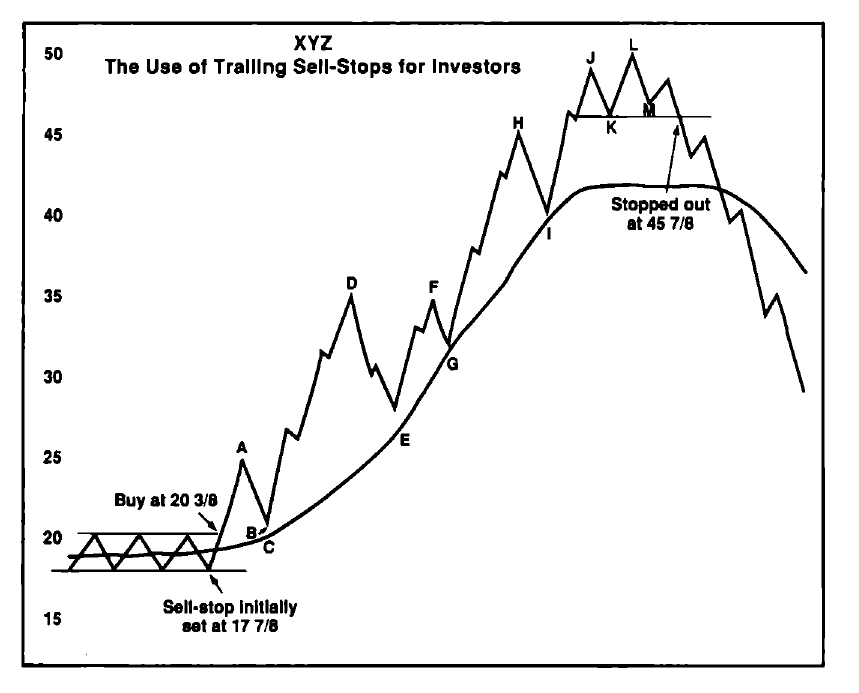
Relevant concept: A stock is said to move from stage 2 to stage 3 when the current market price moves below 150 DEMA (per Stan Weinstein) (200 DEMA in more contemporary literature). Since strong stocks seldom cross this threshold, you can put a stop at this threshold, which if crossed, closes the position at profit. As the stock climbs up on the price chart, the sell stop needs to be accordingly needs to be moved up, just below the 200 DEMA. This needs to be done on a regular basis. It can be weekly or max fortnightly. As and when the stock would enter stage 3 (and it can happen on low volume), you will be safely exited. Here’s a pictorial representation of the same (From Stan’s book):
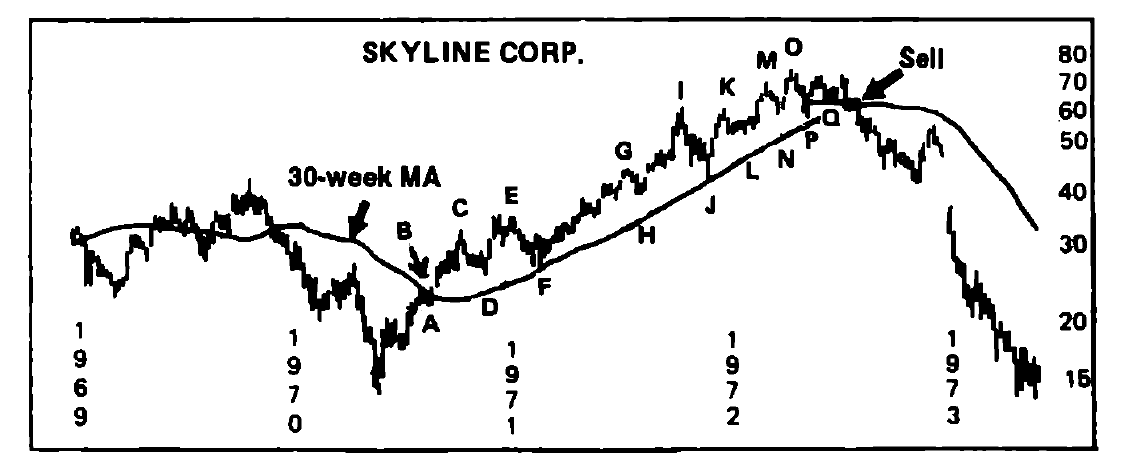
The dark line is 150 DEMA
I use a variation of this exit system in my fresh buys, with the aim of capital preservation. Once a stock has given me around 15% profit, I usually place a safety GTT, Rs. 2 above my breakeven price. That way I remain protected from volatility, like we saw on June 4, 2024. Yes, it can sometimes throw you off of positions which may quickly recover, but it will almost always preserve your initial capital.
@Parakh You are right…But many times stocks move so fast, specially momentum stocks…that they are more than 30% above its 30 weekly EMA ( 150 D Ema), in that case even if you apply trailing stop losses just below 30 week EMA, you may end up giving more than 30% of your gains…Can you finetune this trailing stop loss better to keep the gains?
So there’s something called base count.
In stage 2, a stock climbs up the price action then experiences some profit booking which pulls the price down. The price pull back is between 15% to 35% percent, following which the price then comes back to prior levels and climbs further from there. This would create a cup like structure.
A climb of a minimum of 25% from there and a repeat of the aforementioned scenario create a base. Going by the description we now have 2 bases.
When we have 4-5 such bases, it is said that the stock becomes exhausted and prone to breakdown. This is when you need to become cautious. I searched, but:
- Stan Weinstein does not mention anything about base count, but does mention eyeballing the chart in general to check if a stock is in late stage 2. Here’s a pictorial representation:
- William O’ Neil does not mention anything about base counting in his book - HOW TO MAKE MONEY IN STOCKS, but his firm William O’ Neil India’s product - MarketSmith has an article on base counting - Base Counting.
- Mark Minirvini in his book - Trade Like a Stock Market Wizard does mention about base counting in chapter 5 on page 80 but does not elaborate on how to do it. Here’s an image of base counting per Mark:
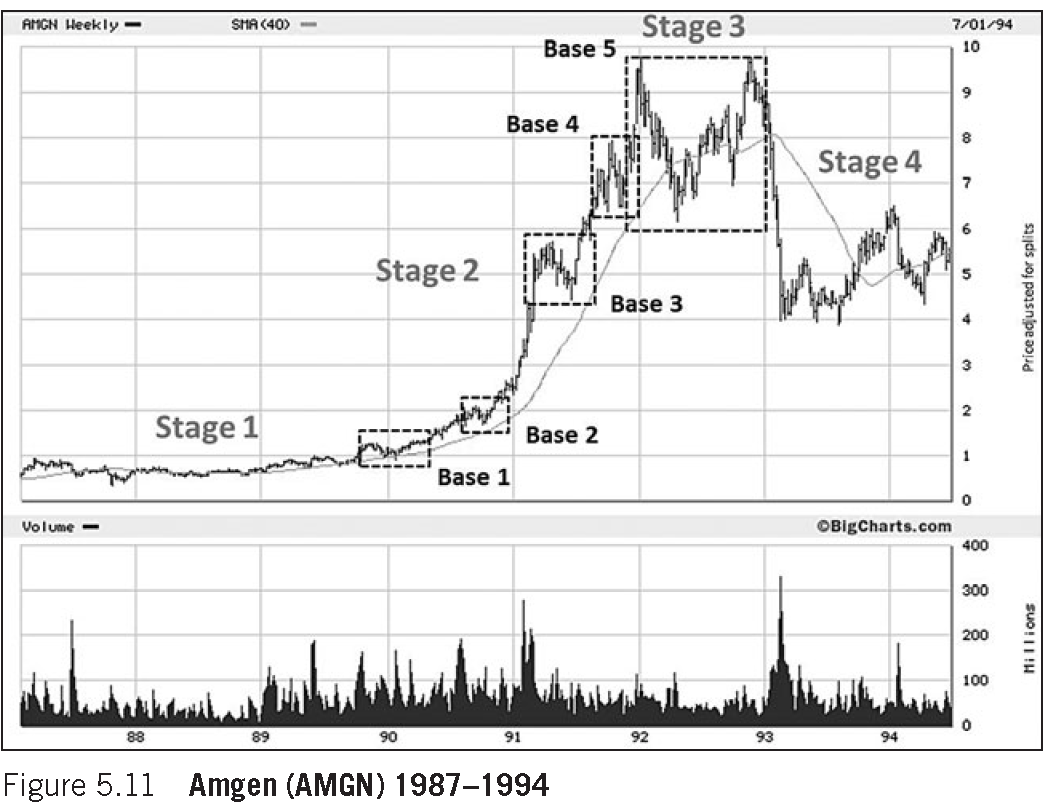
So, all in all, per my knowledge, your best bet at the moment when it comes to putting sell stop orders is concerned is, to count bases per MarketSmith article, while taking sector rotation into account.
2 Likes
@Parakh Frankly, I have read all the 3 books and above mentioned base count. But base count appears arbitrary and not something concrete. Any two investors cannot agree about perfect base formation and base counts , that too on different time frames, To each his own and different interpretation can be made by different people. Its just like an investor trying to fit a particular chart pattern , where it doesnot exist. It starts becoming more subjective.
So is it better to put some objective quantitative stop loss like 15% from recent top or CMP, because then it would be objective and common for all …Nobody can interpret it in individualistic way??
For example …In case of KEI, from November 2020, how many bases have formed, can we come to the same number till today?
1 Like
@Mudit.Kushalvardhan I understand what you are saying. I admit that there’s no clear answer other than putting the sell stop order just below 150 or 200 DEMA. Different authors have escaped providing a clear explanation on how to conduct a base count making it subjective.
But, I am also not able to see a common agreement to a sell stop order, say, 15% below CMP. How can we make others agree to our viewpoint, as that appears to be subjective as well.
Sorry, but I do not have an authoritative answer to your query.
2 Likes