
How do you do this analysis of ur portfolio v/s Nifty 100 ? I mean which tool do you use?
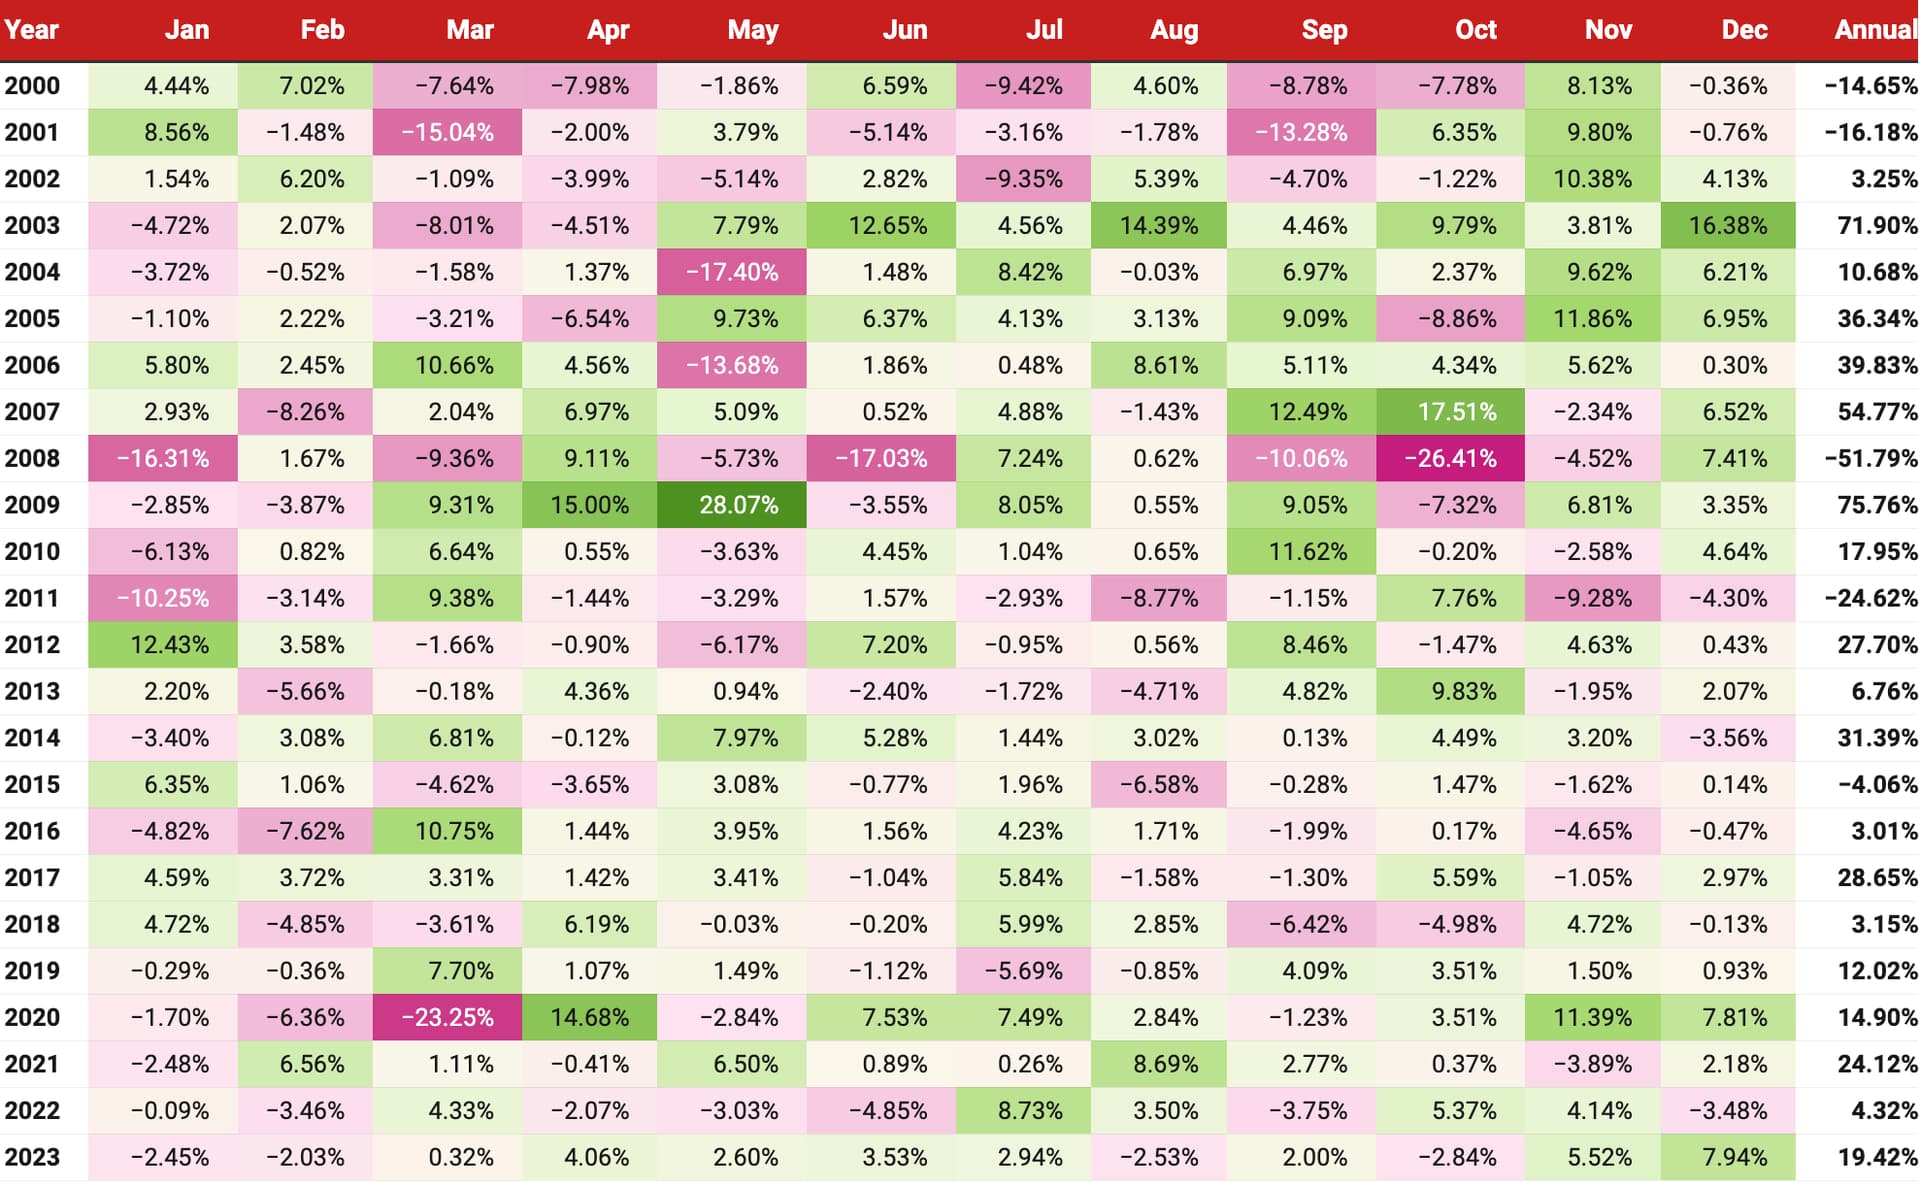
I keep a tab on my monthly portfolio returns (historical) like a heatmap. Here’s a sample below:

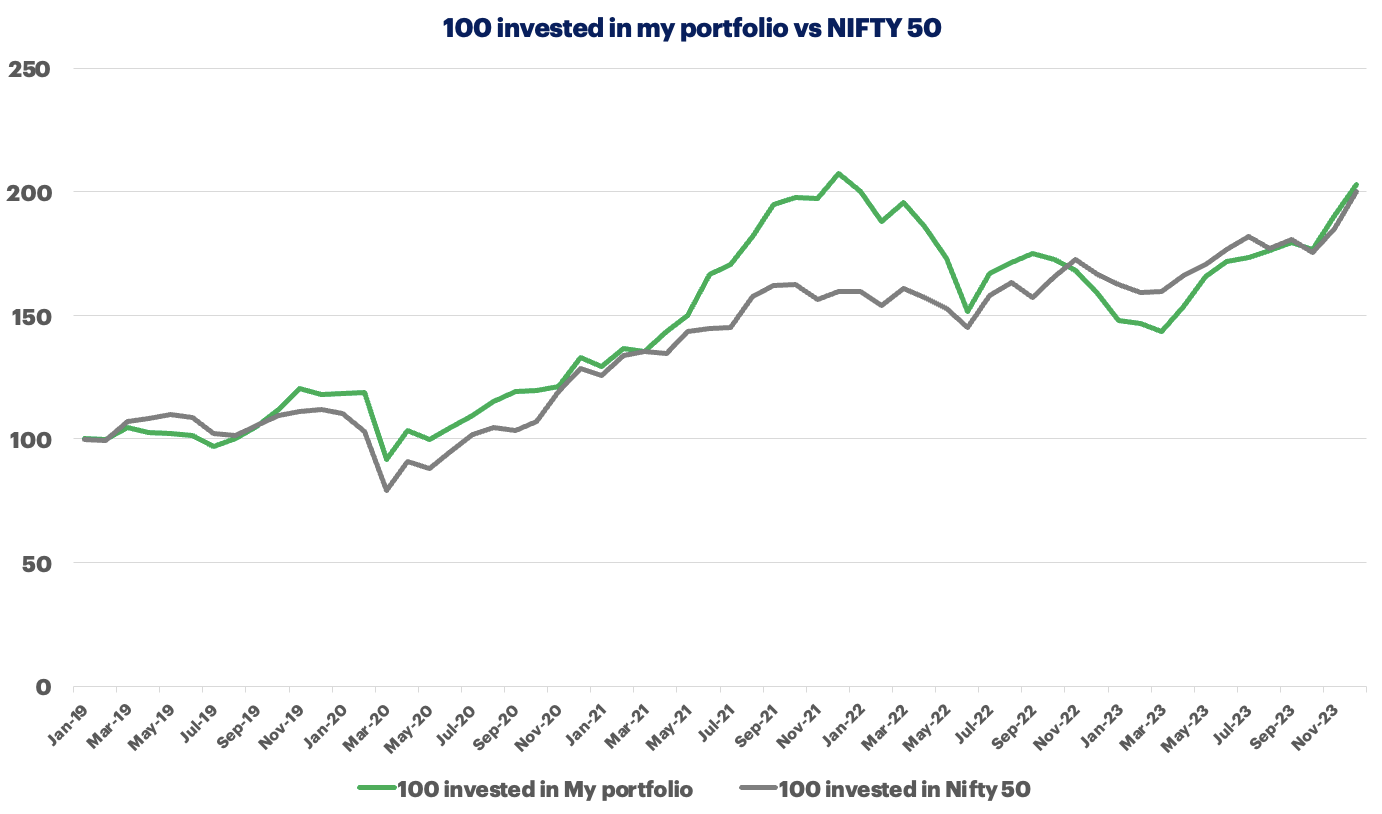
Then you track similar NIFTY50 and NIFTY500 or any other benchmark index and plot it in a line graph to give you the desired result.
Here’s a sample NIFTY50 return I got from PrimeInvestor:
I use premium Value Research Online (VRO) to extract my monthly returns (although accuracy is questionable) since I use Tijori (premium) as well which has a higher returns profile (not sure why - am investigating more on this).
So I used the lower CAGR returns for the graph (keeping the expectations low) to paint the picture.
PS - the NIFTY50 heatmap is very interesting if you see which months performed positively over the last 23 years and which didn’t. Something to ponder and keep our expectations in check.
Hope this is helpful ![]()
2 Likes
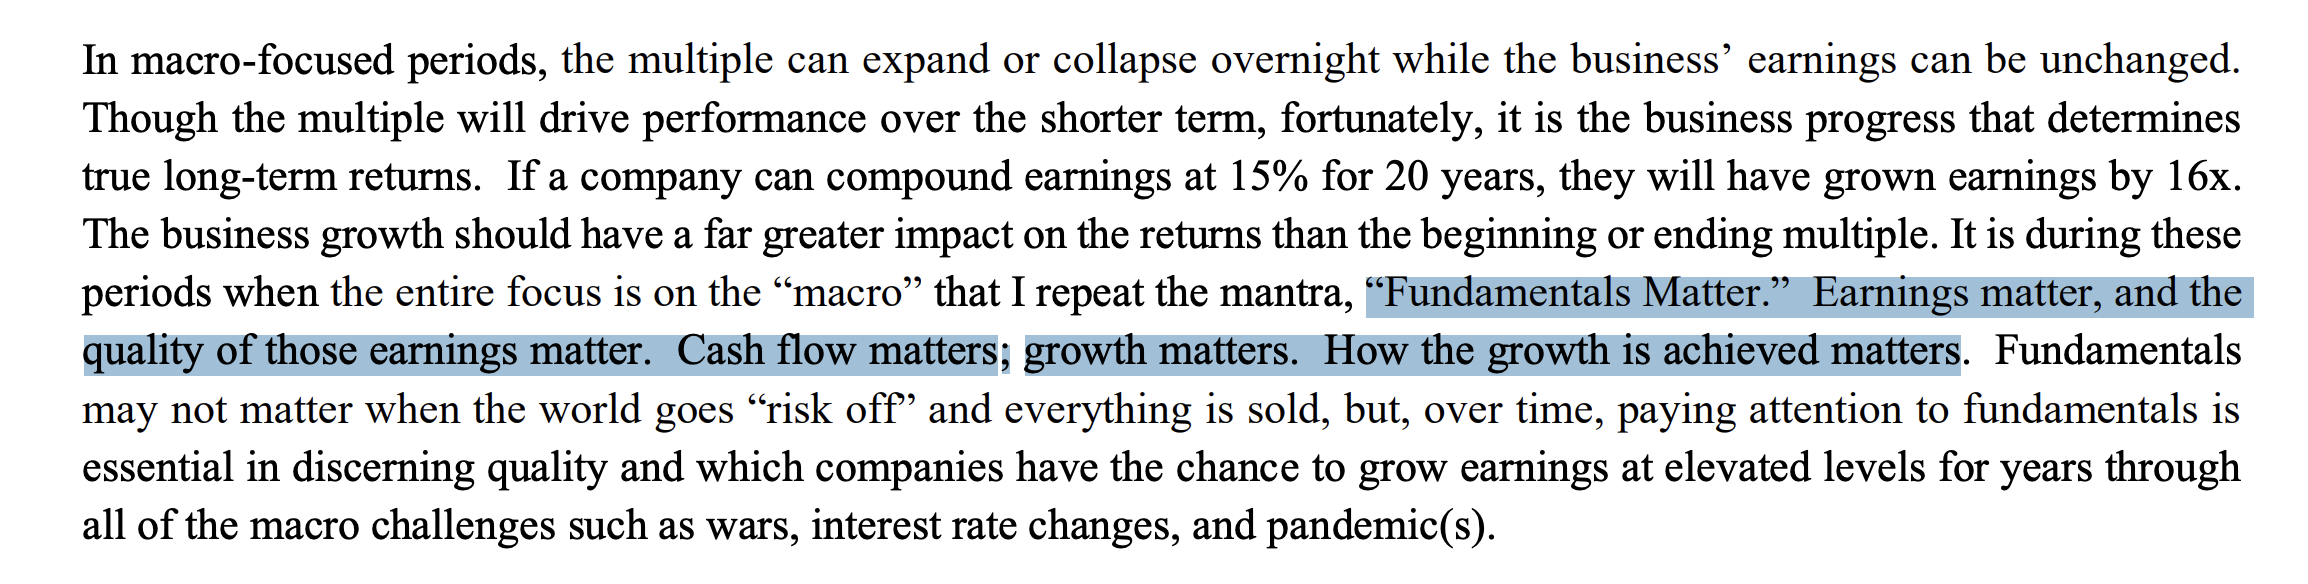
Insightful excerpt on portfolio construction and position sizing by renowned investor, Rajashekhar Iyer

1 Like
The question is what are the individual contributors to Total Shareholders Returns? Here’s a quick snapshot of the drivers of TRS for the S&P 500 from 2012 till 2021 (source)

Total Shareholder Return = Dividend Yield + Earnings Growth + Multiple Expansion
A concerning trend that we can immediately recognize is that P/E multiple expansion (i.e. the stock price rising faster than the underlying earnings) drove a significant proportion (41.6%) of the returns.
This is problematic as winning simply because the other person is willing to pay more is not a sustainable strategy. However, that seems to be the cards we have been dealt.
1 Like
So goofy, i am trying to understand in a simple term. does this mean, 41% amongst return is simply a speculation ? (pls correct me if i am wrong.)
1 Like
to simplify, YES!
PE in general is the hive expectations baked into CMP. although that’s reductive in nature, however it won’t be unfair to say that PE isn’t in our hands in short/medium term - thus speculative.
1 Like
Date: 31st January 2024 portfolio update
Quick update on my portfolio - continue to follow buy and hold strategy since deep down we all know it’s not what we do randomly that will produce long-term returns; it’s what we do consistently. So then question is what can be done consistently over long periods of time.
After many mistakes and paying high tuition fees, now I prefer to buy and hold quality franchises within reasonable valuation with growth triggers which can last for years (ideally) which top-quality management can harness to build either a moat or pivot swiftly while sustaining growth trajectory.
Below are the 5 core ideas I believe which helps me to find consistency in my thought process and actions subsequently
-
at a fundamental level, earnings drive share prices over time (as an exercise check how convergent or divergent is CMP from 5y/10y profit/eps growth rate)
-
only quality businesses can deliver earnings consistently in the volatile world we live in. my personal NEEV framework (consistent revenue growth, expanding OPM, higher reinvestment rate and shareholder friendly promoters) has helped in in this regard. quality is defined by key characteristics allowing businesses to grow sales and EPS at above-average rates and will continue to do so into the foreseeable future. That’s because of their generally high returns on capital and their ability to reinvest retained earnings at attractive rates and into large addressable market
-
our only job is to find such businesses within one’s own circle of competence which can deliver earnings for a very long time. this process helps me to remain interested, passionate to learn and build conviction to hold over time. due to this, I avoid real estate, banking, pharma (newly added to my anti-portfolio list) etc etc
-
find and buy them at reasonable valuation to it’s peers and industry to enjoy margin of safety. e.g. current PE (non-debt laden cos) or EV/EBITDA (debt laden cos) or P/B (financials) lower than 5yr or 10yr median
-
hold them forever (ideally) and do nothing. we need conviction to hold them forever. conviction will only come if we understand the businesses’ products, customers, suppliers (use porter’s 5-forces model). it’s a slow and incremental process (at least for me)
Here’s my current portfolio:
| Stock name | Weight % | Avg P/E | Profit / Loss % | IRR % | Action |
|---|---|---|---|---|---|
| MOST 100 ETF | 9.4 | 20.7 | 43% | 30.3% | |
| TITAN | 8.4 | 49.4 | 101% | 29.4% | |
| TIPS LIMITED | 8.3 | 20.6 | 122% | 72.3% | |
| BANK BEES ETF | 7.7 | 13.8 | 24% | 16.7% | |
| TATA INVEST CORP * | 7.4 | 29.0 | 202% | 166.6% | |
| BAJAJ FINANCE | 7.4 | 22.5 | 35% | 13.2% | |
| IRCTC | 6.8 | 28.0 | 164% | 59.0% | |
| COAL INDIA * | 5.4 | 5.3 | 69% | 125.1% | |
| ASIAN PAINTS | 4.8 | 47.1 | 11% | 9.3% | |
| NARAYANA HEALTH * | 4.7 | 25.1 | 44% | 84.4% | |
| INDIAMART | 4.6 | 51.7 | 3% | 34.5% | |
| PIDILITE | 4.4 | 57.2 | 32% | 14.1% | |
| TATA ELXSI | 4.0 | 34.0 | 75% | 58.4% | |
| DIXON | 4.0 | 50.2 | 127% | 93.5% | |
| VARUN BEVERAGES * | 3.9 | 47.8 | 73% | 59.7% | |
| IEX | 3.2 | 15.1 | 156% | 17.6% | |
| AMARA RAJA * | 2.6 | 13.3 | 31% | 89.7% | Added more |
| WONDERLA * | 1.8 | 29.8 | -3% | - | Newly added |
| PHANTOM VFX * | 1.3 | 28.3 | 23% | 37.6% |
*(asterisk) signifies <1 yr holding period.
100 invested in my portfolio vs Nifty 50 index
Investments in Jan 2024
- WONDERLA - Company has similar traits to Narayana (long term mgmt, secular growth trends, steady compounder). Also simple business to understand with manageable monitorable growth triggers (footfalls, new park additions, increase in ARPU) and excellent financial metrics with management showcasing conservative approach to growth over long term.
Exits in Jan 2024
- KRSNAA - 100% exit. While much of the triggers are yet to play out (which I am sure it will), but wanted to concentrate my healthcare investments ONLY in Narayana Healthcare. also was finding it difficult to track and measure the B2G contracts effectively
- SATIA INDUSTRIES - 100% exit. Business has given a muted performance over holding period. Also, paper is a cyclical industry and during this phase price of paper increased which put pressure on price perception. In future, CMP will go up (opportunity loss perhaps) but happy to commit type 2 error than type 1
Finally here’s my investment thesis for WONDERLA: (this is my 1st investment thesis I am sharing publicly. please help me if possible. want to do better job of this in the future, so that others can also benefit)
Business model:
WONDERLA is one of the largest Amusement Park Chains in India. It presently has 3 operational parks located at Kochi, Bengaluru and Hyderabad and 1 resort in Bengaluru. They are launching 2 new parks - one in Odisha (2024) and Chennai (hopefully by 2025).
The parks offers 2 type of attractions - land rides and water rides for 8-10 hrs (whole day) for typically family and corprates who are ready to travel 1-1.5 hrs from city to outskirts.
The primary revenue source of the company is through entry ticket fee with further sub-divisions between normal and fastrack tickets (2x cost of normal). Each park has various restaurants spread across the park which contributes around 30% of the overall revenues — rest comes from ticket sales (70%). Sources of revenues for the parks are entry fees, food & beverages (F&B), retail products, sponsorship and advertisements, resorts and other miscellaneous rentals.
Peak season for parks is the March to June and October to December months. Kids are the major target segment of amusement parks and school vacations and festivals like Diwali and Christmas are when kids would visit the parks. ARPU for Q2 FY24 increased by 9% to INR 1,440 (expecting ARPU to grow in line with inflation plus an additional 5-6%). Attracts over 3 million visitors every year (expecting footfall growth of 5-6% per year in the future).
Indian amusement park industry: The first amusement park in India was Appu Ghar opened in 1984 in Delhi. The Indian amusement park industry is 5000-6000Cr (approx) and there are 150 amusement parks in the country (Wonderla has around 10% market share) – although slightly old data. The annual footfall for the industry is 58-60 million. This is expected to grow 10-15% in the next 5 years. Parks like Wonderla, Essel World and Nicco park (been there multiple times) fall into the large park category.
Major drivers for amusement parks in India are demographic advantages
- 28.5% of the population lies in the age group of 0-15 years
- 63.40% in the 15-59 and 8.10% >60 years.
Primary investment rationale:
- rising income levels
- increase spending on tourism and leisure activities
- rising urbanization are the other factors that will lead to more people visiting amusement parks
sidenote: in 2016, I was chatting with a sr personnel from TenCent and discussing gaming and TenCent’s various media properties. I still remember, he mentioned “when people become rich, they tend towards hedonism”
What I like about the business:
- High entry barriers (in terms of buying upfront land and rides) - MOAT
- In-house manufacturing of rides (to keep costs as low as possible, visibile from the fact the Wonderla spending around Rs 350cr all inclusive to start a new park)
- multiple levers to grow revenues
- hike in ticket prices with inflation
- non-ticket revenues (F&B, over-night stay in their own resort like in BLR)
- increasing capacity utilization of the land holding in each park
- operating leverage (every percentage increase in revenue, there is scope for 2.5 times increase in profits)
- Leadership and first mover advantage as it’s promoter driven
- Unorganized to organized
- Longevity due to management’s conservation style of operating
- Negative working capital business model
What I don’t like about the business:
- One of the two core ingredients of the business is real-estate which isn’t my area of interest and is subject to regulations and litigations like Wonderla faces in HYD.
Trackable growth drivers: - Monitor the following key parameters every quarter:
- Increase in Footfalls
- Performance of New Parks
- Increase in Replacement Capex
- Hike in ticket price
- ARPU
Risk factors:
- Accidents on premise
- Land litigation (e.g. Hyderabad)
- Capital intensive nature of the business (if any park fails to garner interest, then opportunity loss of 2-3 yrs perhaps)
Valuation expectations (Jan 2024)
currently business is valued at ~30x PE which is 30% higher than 5y median PE of 23x but just below 10y media PE of 32 (so ideally this should be a 10y hold to extract value given business is simple and has imminent growth triggers).
So I am today valuing the business NTM with 20% earnings growth, then PE falls to around 24x. ideally would have loved the buy the business <20x PE but given business current and future growth triggers, I doubt if we can get it in the near future. Highest PE, business had touched is 65x PE in 2017, then COVID struck.
Sources:
- Wonderla Holidays
- https://www.youtube.com/watch?v=Q7313vRmViE
- Wonderla Holidays Ltd: Fundamental Analysis - Dr Vijay Malik
- Fundamental Analysis of Wonderla Holidays Limited
Disclaimer: I am not a financial advisor and nor a SEBI registered advisor. The content shared here is only for learning purposes. So please use your discretion to make any buy/sell decision and not use the above as a recommendation.
12 Likes
Once in a while, I come across investor letters which gives me brainfood to think. Today, I came across yet another one from Greenhaven Road Capital.
Here are a few excerpts I liked:

This point has been circling on my mind lately. The cacophony of narrative that we get to hear (not just from politicians whose primary job is to sell hopium) but also from many marquee market participants about India becoming a $5 tn / $10 tn / $30 tn economy over the next decades when projections few quarters down the line is difficult, if not downright impossible in today’s world.
So in such times, we as fundamental investors need to follow the evidence…
Finally, we should not forget that tomorrow’s results are being baked today. For larger companies, it will take 2/3 years, while for smaller units, 1-1.5 yrs.
So it becomes all the more important for fundamental investors like us to learn as much about the companies we own, the narratives that mgmt teams are sharing, and execution prowess demonstrated YoY (if not QoQ) to enjoy long-term compounding stories.
Do share such insightful investor letters if you’ve come across… ![]()
2 Likes
Let’s speak about Paytm as an opportunity or better to avoid it as a falling knife. Much has been said here in this VP thread…
- Date: 17th Feb 2024
- Valuation: Rs 21,677 cr
- Price/Book value: 1.75x
- 3y revenue growth: 24.6%
- 3y EPS growth: 24.5%
Paytm has quickly become a special situation opportunity - is it a blessing in disguise or an absolute avoid is the question?
In such cases, I always find exploring the narrative vs evidence useful to create multiple scenarios. let’s explore…
Scenario 1: PPB is not rescued, but a third party steps in to settle the UPI transactions. In this case, the wallet business for Paytm is entirely lost. Here, the impact on EBITDA could be Rs 300-500 crore as per the management. Some analysts feel this will hurt its ability to draw on an otherwise large customer base to up-sell its financial products. Others feel Paytm should be able to build the lost base back over time, even though it will have to live with the immediate financial jolt. This is because its rivals like BharatPe and PhonePe too have a similar structure – they do not own a bank like Paytm does.
- Impact: Paytm might lose its edge of having a bank underneath and become very much like PhonePe; then the bet is on management execution
- Action - tracking position; say 1% of portfolio
Scenario 2: PPB is rescued by other banks, both wallets business and UPI transactions are saved. In this case, the impact on EBITDA could be lower than Rs 300-500 crore. The loss of time and opportunity cost till a bank steps in to rescue both parts will impact the company.
- Impact: If other banks buy-out PPBL, then over-time CAN Paytm will retain much of the edge than it’s peers? Not sure, but worth exploring
- Action - staggered position sizing
Scenario 3: No other banks step in to salvage the situation, not even the UPI part. Paytm’s core proposition will be impacted. As users switch platforms, this can potentially threaten Paytm’s existence.
- Impact: Terminal value can be at risk
- Action - absolute avoid for me
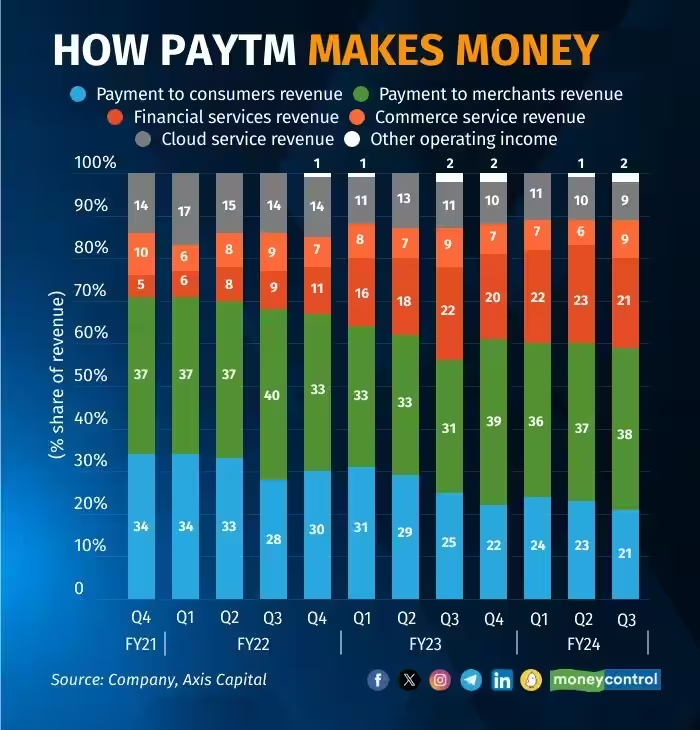
Here’s how Paytm makes money and its subsequent split across segments:
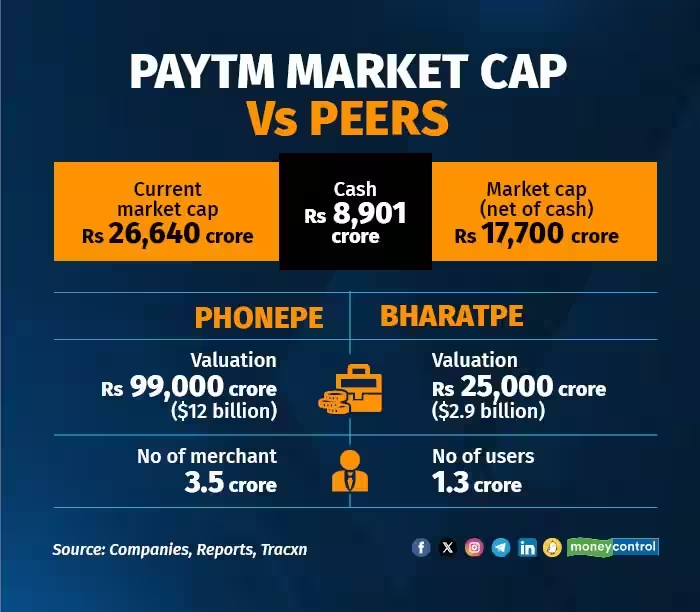
Here’s how Paytm’s m-cap vs other pvt players:
Possibilities:
-
Finds a new sponsor bank (wallet business can be saved) - the impact is minimized (Axis seems to have responded)
-
PPBL is sold to some big banks (ICICI, Axis, HDFC), then the competitive advantage of Patym could be retained (wait and watch)
What to keep an eye on:
-
Case 1: Any bank coming to rescue as a “sponsor bank” for scenario 1 to play out?
-
Case 2: Any bank showing interest in buying out PPBL?
-
Case 3: RBI giving an extension to the 29th Feb deadline could be an indicator (happened as extended till March 15th from Feb 29th)
@rpattabi @ValueV any thoughts?
PS - wrote this note early this week. realized some of the above are getting executed. hence sharing my pvt notes publicly to draw more eyes/criticism (hopefully constructive from the community). also not on Paytm’s main thread, so this discussion which has many speculative points remains here.
Disclaimer: No position. Also, I am not a financial advisor nor a SEBI registered advisor. The content shared here is only for learning purposes. So please use your discretion to make any buy/sell decision and not use the above as a recommendation.
3 Likes
I think it is safe to assume that scenario 1 is likely. I don’t consider rescue of PPBL at all, as RBI action seems to ensure that nothing will be left of PPBL. RBI is asking PPBL customers to move to other banks. There is no direction given for these accounts to be migrated to other banks. Also, I vaguely remember that payment bank license is not transferrable.
Do you see any value remaining in PPBL?
as a standalone entity, perhaps no (historically payments bank wasn’t one of the greatest ideas to begin with during Raghuram Rajan’s era) due to its truncated ability vis-a-vis any other commercial banks. then regime change post demon didn’t help!
however, PPBL as a sponsor bank powering PPSL as its only client who brought 30+ cr consumers (UPI handles) and 6cr merchants (providing settlement destination to easy on/off rails for txns) has definitive value.
so if other commercial banks takeover (acquisition) or simply change or mgmt (like yes bank) whose primary motivation or CASA accounts, then there’s something there imho. also big banks can bring their regulatory / compliance frameworks which RBI loves (again yes bank as an example).
so let’s wait and watch. if scenario 2 plays, I’ll have more confidence in the future narrative of PPSL (public entity), than scenario 1 since seamless execution risks still remains, however scenario 3 is out or the picture in the immediate future.
1 Like
As more or less confirmed by RBI in FAQ, scenario 1 should play out. I am almost sure that there is no salvation for paytm payment bank as tbh there is not much this bank doing other than acting as PSP for paytm and it was good idea as PayTM had reach ppl so ppl can take advantage of having account putting 2 lacs in FD (this is done in partnership in this case it was Indusind bank) in rural areas and it can’t lend so not much use of CASA. what is use of payment bank if you do not allow play it with different business modal like India post payment bank. To be sure, PayTM gave reasons for this action in terms of KYC loopholes. My gut feeling is also saying that disbursement number of PayTM somewhat made regulator uncomfortable and if you see since 2020 there are many new regulation, earlier RBI used to focus on deposits safety and aspects thereon but now it want to have A-Z tracking of 1 rupee that can’t be done without tracking payment provider so they had asked for PA license, PPI license and if you search online you will get number of new rules/regulations were launched - traditional banks operate in boundary so there is not much chance of accident so it will hurt most fintech player who play on edge but that’s what make boundary expansion - I do not think Bank can play role of innovator. UPI and Payment bank both was launched when Mr. Rajan was governor so you can get sense how it impact the industry who are the head of regulator. I can go on but I think i should stop now ![]() otherwise it will bore readers.
otherwise it will bore readers.
About PayTM specific, no option but to wait. At least we have light at end of tunnel as UPI will keep working.
Thanks!
Disc. Holding Paytm so may be biased.
1 Like
Date: 29th Feb 2024 portfolio update
Short update: I did nothing (mostly). Just wait and watch.
Actions in Feb 2024: Averaged in COAL INDIA, given there’s valuation comfort for me. Also, certain expected growth triggers like a nod from govt regarding coal gasification (thanks to @1957 for giving depth to this topic), the company bagging RE projects, looks interested in getting involved in critical mineral exploration (e.g. in AUS).
Here’s my current portfolio:
| Stock name | Weight % | Avg P/E | Profit / Loss | IRR | Action |
|---|---|---|---|---|---|
| TATA INVEST CORP | 9.8 | 27.5 | 329% | 189% | |
| MOST 100 ETF | 9.1 | 19.8 | 50% | 32% | |
| TIPS LIMITED | 9.0 | 20.6 | 161% | 82% | |
| TITAN | 7.9 | 47.2 | 105% | 29% | |
| BANK BEES ETF | 7.3 | 13.4 | 27% | 18% | |
| BAJAJ FINANCE | 6.5 | 22.5 | 29% | 11% | |
| COAL INDIA | 6.5 | 5.7 | 65% | 135% | Added more |
| IRCTC | 6.0 | 26.9 | 151% | 56% | |
| INDIAMART | 4.5 | 51.7 | 8% | 36% | |
| NARAYANA HEALTH * | 4.4 | 24.0 | 45% | 71% | |
| PIDILITE | 4.4 | 57.2 | 42% | 16% | |
| DIXON | 4.3 | 43.9 | 167% | 95% | |
| ASIAN PAINTS | 4.2 | 47.1 | 7% | 8% | |
| VARUN BEVERAGES * | 4.0 | 46.5 | 97% | 66% | |
| TATA ELXSI | 3.8 | 34.0 | 78% | 58% | |
| IEX | 3.0 | 15.1 | 162% | 18% | |
| AMARA RAJA * | 2.3 | 14.0 | 25% | 58% | |
| WONDERLA * | 1.8 | 30.0 | 4% | 31% | |
| PHANTOM VFX * | 1.3 | 24.3 | 34% | 46% |
*(asterisk) signifies <1 yr holding period.
Here’s the return profile to date:
| Return % | 1M | 3M | 6M | 1Y | 3Y | 5Y |
|---|---|---|---|---|---|---|
| MY PORTFOLIO | 5.8% | 14.8% | 22.7% | 53.0% | 19.1% | 23.1% |
| NIFTY 50 | 2.8% | 10.3% | 13.8% | 26.5% | 14.3% | 15.2% |
| NIFTY 500 | 3.4% | 13.0% | 18.9% | 38.8% | 17.7% | 17.6% |
Note: 1/3/6M is in absolute while the 1/3/5Y is annualized
Disclaimer: I am neither a financial nor a SEBI registered advisor. The content shared here is only for learning purposes. So please use your discretion to make any buy/sell decision and not use the above as a recommendation.
3 Likes
I am on the other side of the spectrum. I bought TICL a little over a year ago and sitting on ~5x return whereas my return expectation was 17-20% (HoldCo Return = Underlying Portfolio Return + Dividend Yield ± HoldCo Discount). So fundamentally I got 9/10 year returns in a year.
I think I got lucky and due to some bad luck. Now when that bad luck strikes is anyone’s guess.
Although there are a few triggers which market participants are giving certain weightage (less or more, time will tell):
- Upcoming NSE IPO (date is not announced yet)
- Upcoming TATA capital IPO (expected date is in 2025)
- Upcoming TATA Sons IPO (date is not announced yet)
Maybe a few more unexpected +ve triggers on the upside perhaps. maybe!
My current rationale from the portfolio level is to trim the position (soon) from purely reducing concentration risk. However, I think it’s prudent to hold since there’s nothing that fundamentally has changed i.e. it’s still an optimal way to index the TATA group of companies (my primary thesis) which still pays around 80% of earnings as dividends (a bird in the hand is worth two in the bush).
But definitely, CMP is over the top and due for some correction (as I mentioned I am due for some bad luck anytime).
Please correct me if I made any wrong assumptions above. Happy to learn and course correct.
Disc : Invested from early 2023 levels (position size here). No transactions in the last 30 days.
2 Likes
Great to see the rise of Tata Investment Corp from no. 10 position in your first shared portfolio to no. 1 now!
What’s the relevance of P/E for financial or holding companies like Tata Invest or Bajaj Finance?
it’s a fair question. here’s my response:
Bajaj Finance: P/B is a more accurate value measurement for a debt-laden finCo. But I use P/E here to keep track at a portfolio level (since I don’t own any other direct finCo) whereas during my analysis I also look at P/B.
Tata Investment Corp: TICL operates almost like a mutual fund (prima facie, wanted to index TATA group of companies and TICL then gave me a decent margin of safety) and has large non-strategic holdings. More so, it is registered under the category of IC while being an NBFC i.e. doesn’t take debt to grow.
Hence P/B might not be an accurate view of value considering its underlying holdings are primarily non-financial companies. However, discount to book is a key metric that I continue to track using this spreadsheet public in VP.
Overall, your question is pertinent but for ease of highlighting entry valuation in the portfolio, I publish individual portco P/E ratios. Hope this answers your question.
Disclaimer: I am neither a financial nor a SEBI registered advisor. The content shared here is only for learning purposes. So please use your discretion to make any buy/sell decision and not use the above as a recommendation.
1 Like
Yes it does, thanks for clarifying.
Date: 1st April 2024
Short update: I did nothing (mostly). Just wait and watch.
Actions in March 2024: Averaged in PHANTOM VFX.
Here’s my latest portfolio :
| Stock name | Weight % | Avg P/E | Profit / Loss % | IRR % | Action |
|---|---|---|---|---|---|
| MOST 100 ETF | 9.8 | 19.4 | 52% | 32% | |
| TIPS LIMITED | 8.4 | 20.6 | 140% | 73% | |
| TITAN | 8.2 | 47.2 | 107% | 29% | |
| TATA INVEST CORP | 7.7 | 27.5 | 234% | 162% | |
| BANK BEES ETF | 7.4 | 13.3 | 27% | 17% | |
| BAJAJ FINANCE | 7.3 | 22.5 | 42% | 14% | |
| COAL INDIA | 6.4 | 5.7 | 59% | 110% | |
| IRCTC | 6.1 | 26.9 | 159% | 55% | |
| PIDILITE | 4.9 | 57.2 | 57% | 19% | |
| DIXON | 4.7 | 43.9 | 184% | 96% | |
| INDIAMART | 4.5 | 51.7 | 7% | 35% | |
| NARAYANA HEALTH * | 4.3 | 24.0 | 41% | 57% | |
| ASIAN PAINTS | 4.3 | 47.1 | 7% | 8% | |
| VARUN BEVERAGES * | 4.0 | 46.5 | 90% | 61% | |
| TATA ELXSI | 3.9 | 34.0 | 79% | 57% | |
| IEX | 2.7 | 15.1 | 133% | 14% | |
| AMARA RAJA * | 2.1 | 16.0 | 12% | 24% | |
| WONDERLA * | 1.9 | 27.2 | 10% | 61% | |
| PHANTOM VFX * | 1.7 | 30.0 | 8% | 16% | Added more |
*(asterisk) signifies <1 yr holding period.
Here’s the return profile till 31st March 2024:
| Return till date | 1M | 3M | 6M | 1Y | 3Y | 5Y | Since inception |
|---|---|---|---|---|---|---|---|
| MY PORTFOLIO | 0.6% | 6.5% | 19.4% | 57.1% | 19.5% | 22.2% | 21.6% |
| NIFTY 50 | 0.5% | 2.9% | 13.2% | 31.1% | 15.1% | 14.4% | 13.5% |
| NIFTY 500 | -0.4% | 4.7% | 16.6% | 41.7% | 18.2% | 16.5% | 15.2% |
Note: 1/3/6M is in absolutes while the 1/3/5Y/SI is annualized. Inception date is 10th Nov 2016.
100 invested in my portfolio:

Few other pointers for FY24:
- FY24 portfolio churn rate: 11% (expected to it to stay <10% - so kind of a miss)
- FY24 average portfolio beta: 0.96 (expected it to stay around 0.8)
- Trailing 12-month avg. portfolio PE: 30.3
Disclaimer: I am neither a financial nor a SEBI registered advisor. The content shared here is only for learning purposes. So please use your discretion to make any buy/sell decision and not use the above as a recommendation.
4 Likes
Portfolio update:
Date 1st May 2024
Short update: Did nothing (mostly). Continuing to buy, hold & track while focusing on portfolio longevity and respecting mean reversion and probability.
Action(s) in April 2024: Added BAJAJ FINANCE.
Rationale: Looks like market participants expect the company to grow at 30% YoY (historical average) while the company has started growing at 20% YoY – hence there’s been time correction from mid-2021 onwards. However, re-entering at 5.5 P/BV is below 10y historical average. Hence respecting mean reversion, bought 10% of the existing allocation.
Here’s my latest portfolio :
| Stock name | Weight | Avg P/E | Total P/L | IRR | Action |
|---|---|---|---|---|---|
| MOST 100 ETF | 8.6% | 20.1 | 49% | 28% | |
| TIPS LIMITED | 7.9% | 20.6 | 163% | 69% | |
| TATA INVEST CORP | 7.7% | 27.5 | 257% | 159% | |
| BANK BEES ETF | 7.2% | 12.9 | 33% | 19% | |
| TITAN | 7.2% | 47.2 | 111% | 26% | |
| BAJAJ FINANCE | 7.1% | 22.2 | 37% | 13% | Added more |
| IRCTC | 6.4% | 26.9 | 247% | 57% | |
| COAL INDIA | 6.3% | 5.7 | 74% | 105% | |
| DIXON | 4.9% | 43.9 | 463% | 97% | |
| PIDILITE | 4.6% | 57.2 | 72% | 19% | |
| INDIAMART | 4.2% | 51.7 | 49% | 33% | |
| ASIAN PAINTS | 4.1% | 47.1 | 23% | 8% | |
| NARAYANA HEALTH | 4.1% | 24.0 | 41% | 50% | |
| VARUN BEVERAGES | 3.9% | 46.5 | 103% | 62% | |
| TATA ELXSI | 3.3% | 34.2 | 155% | 52% | |
| CASH | 3.2% | - | |||
| IEX | 3.0% | 15.1 | 122% | 18% | |
| AMARA RAJA * | 2.9% | 11.6 | 63% | 106% | |
| PHANTOM VFX * | 1.8% | 27.2 | 10% | 37% | |
| WONDERLA * | 1.8% | 30.0 | 18% | 31% |
*(asterisk) signifies <1 yr holding period.
Note: have started adding my overall cash position.
Here’s the return profile till 30th April 2024:
| Return till 30/04/2024 | 1M | 3M | 6M | 1Y | 3Y | 5Y | Since inception |
|---|---|---|---|---|---|---|---|
| PORTFOLIO | 2.8% | 8.0% | 24.2% | 48.7% | 17.7% | 22.7% | 21.8% |
| NIFTY 50 | 0.6% | 3.7% | 18.5% | 24.7% | 16.0% | 14.0% | 14.4% |
| NIFTY 500 | 2.9% | 6.2% | 25.0% | 37.5% | 19.7% | 16.7% | 15.6% |
Note: 1/3/6M is in absolutes while the 1/3/5Y/SI is annualized. The inception date is 10th Nov 2016.
Disclaimer : I am neither a financial nor a SEBI registered advisor. The content shared here is only for learning purposes. So please use your discretion to make any buy/sell decision and not use the above as a recommendation.
3 Likes