
Another bad quarter for INOX, result summary is below
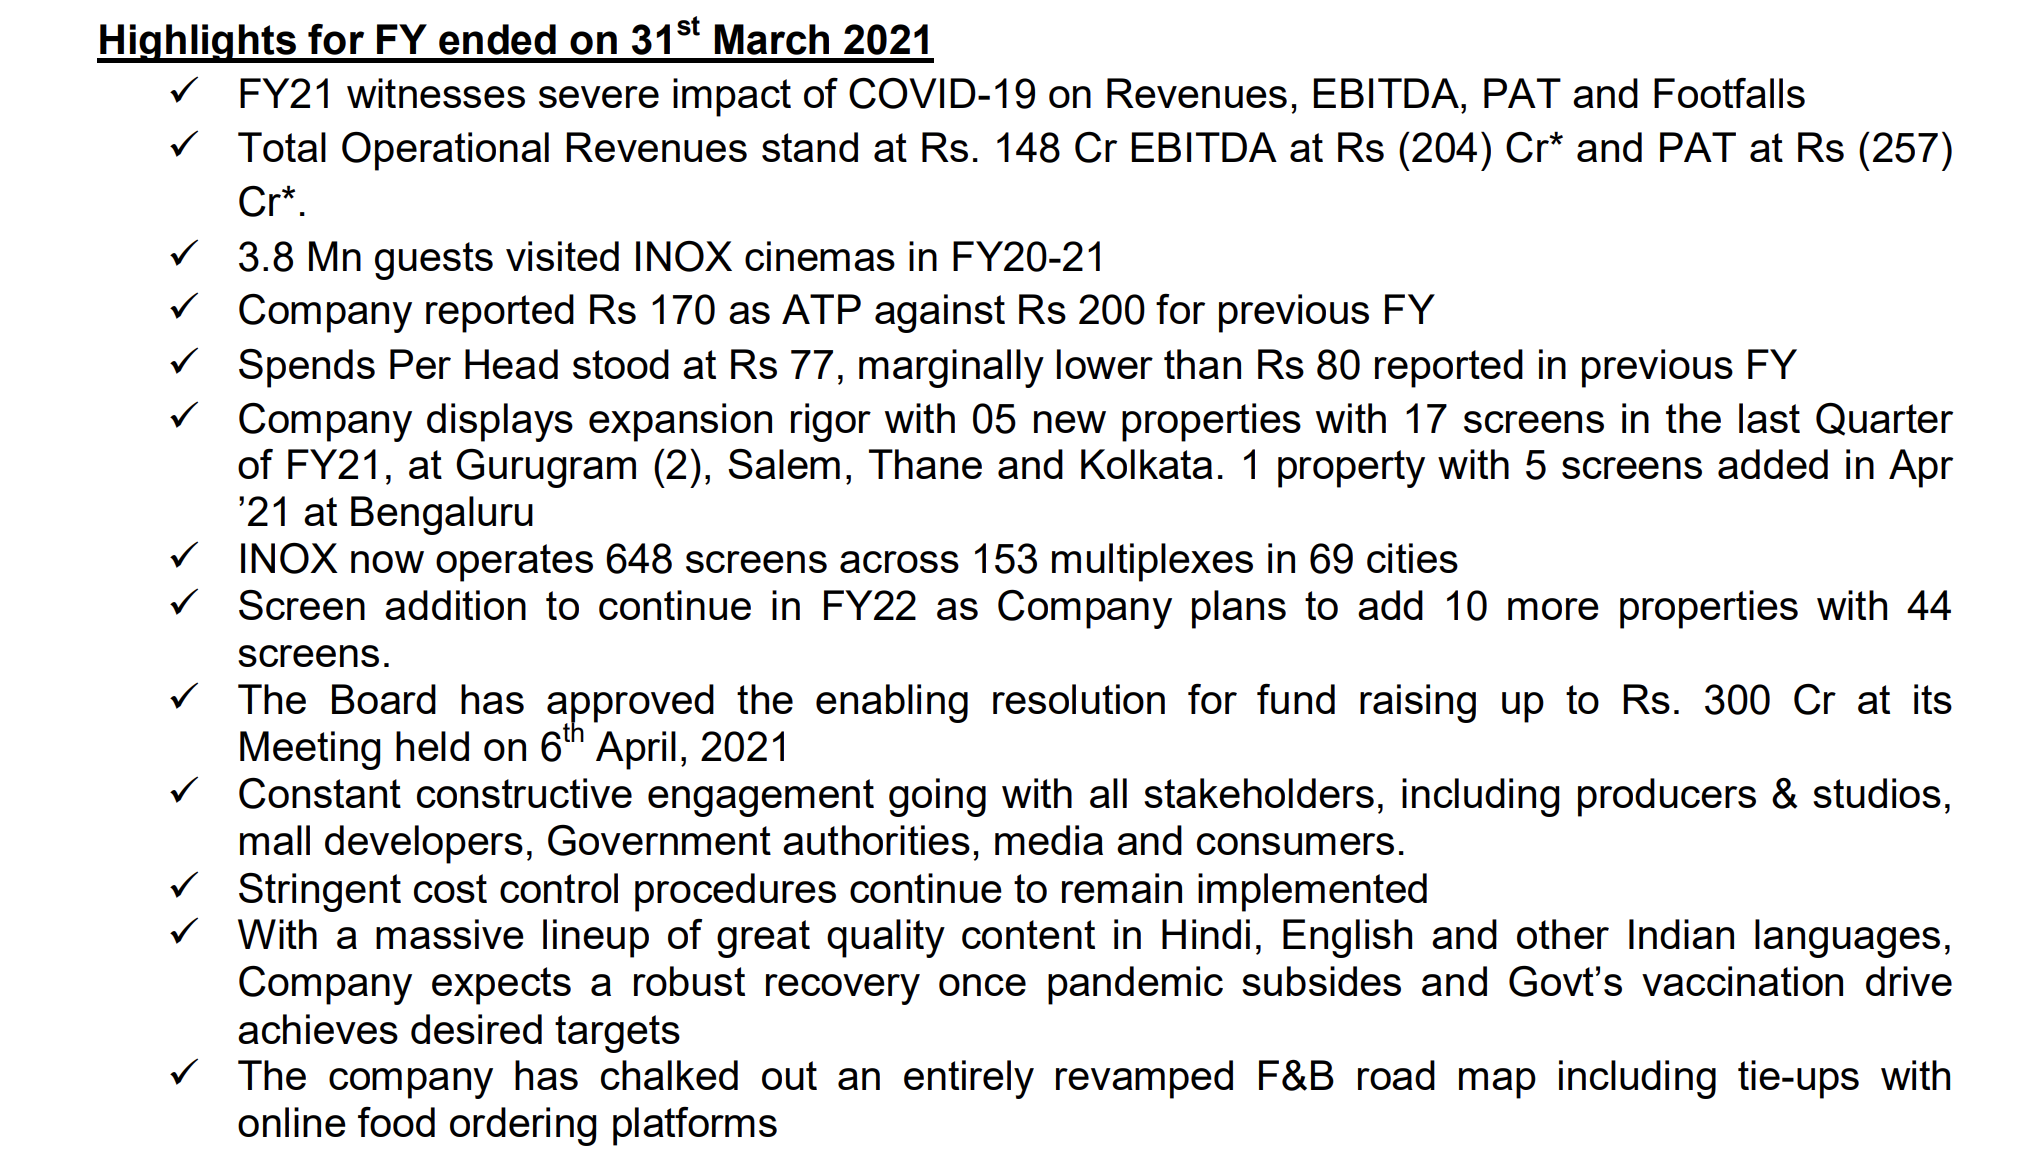
Here are the detailed business metrics over the last 12 years. One silver lining is spend per head deteriorated marginally in FY21 (77 vs 80 in FY20). Average ticket prices went down from 200 in FY20 to 170 in FY21.
| FY09 | FY10 | FY11 | FY12 | FY13 | FY14 | FY15 | FY16 | FY17 | FY18 | FY19 | FY20 | FY21 | FY15-20 Incr | |
|---|---|---|---|---|---|---|---|---|---|---|---|---|---|---|
| Screen count | 91.00 | 119.00 | 239.00 | 257.00 | 279.00 | 310.00 | 377.00 | 420.00 | 476.00 | 492.00 | 574.00 | 626.00 | 648.00 | 10.67% |
| Properties | 26.00 | 32.00 | 63.00 | 68.00 | 72.00 | 79.00 | 97.00 | 107.00 | 119.00 | 123.00 | 139.00 | 147.00 | 153.00 | 8.67% |
| Number of seats | 99’429.00 | 109’406.00 | 119’395.00 | 121’573.00 | 135’586.00 | 144’467.00 | 147’436.00 | 7.76% | ||||||
| Average occupancy | 25% | 28% | 28% | 25% | 29% | 28% | 26% | 28% | 28% | 8% | 2.29% | |||
| Average ticket price | 156.00 | 160.00 | 156.00 | 164.00 | 170.00 | 178.00 | 193.00 | 197.00 | 200.00 | 170.00 | 4.05% | |||
| Footfalls (cr.) | 3.90 | 4.30 | 5.34 | 5.37 | 5.33 | 6.25 | 6.60 | 0.38 | 8.95% | |||||
| Net box office collections (cr.) | 490.50 | 551.60 | 712.80 | 748.10 | 802.20 | 975.00 | 1’105.00 | 54.00 | 14.91% | |||||
| Food and beverages (cr.) | 141.76 | 162.30 | 191.00 | 265.60 | 284.10 | 306.00 | 436.00 | 497.00 | 28.00 | 21.08% | ||||
| Advertising (cr.) | 32.44 | 49.50 | 81.50 | 91.00 | 96.20 | 138.90 | 177.00 | 179.00 | 3.00 | 17.04% | ||||
| Others (cr.) | 60.40 | 71.20 | 91.10 | 92.30 | 101.00 | 104.00 | 134.00 | 63.00 | 13.48% | |||||
| Spends per head (Rs.) | 41.00 | 44.00 | 47.00 | 49.00 | 55.00 | 58.00 | 62.00 | 66.00 | 74.00 | 80.00 | 77.00 | 7.78% |
Disclosure: Invested (position size here)