Another solid set of numbers. Total paying subscribers at all time high with a gain of 7k subscribers to 148K subscribers. PAT at around 80 crores. Expecting IndiaMart to be at 175-180K subscribers by end of March 2022(gain of >15%). Approval of 1100 crores of fund raising via equity/ debt is an interesting development. Stock still trades at around 67x earnings of my expected FY 2021 numbers. (net of cash and investments)
4 Likes
Indeed good numbers ( may not be great on face value)and back on growth trajectory on all parameters, key takeaways
-
Pre covid per quarter paying subscribers addition was 4K/Qtr, Q2 and Q3 has seen a rate of 7K/ Qtr. Mgmt has been conservative and delivered better, a good sign.
-
YOY Revenue growth is high single digit and margin profile improved much higher with op leverage ---- margin expansion has been primarily led by lower emp cost( permanent staff + outsourced call center cost down - approx 25% type reduction for YoY - details in investor deck) - company has all organic traffic and hence no other major sales and mktg exp. Margins in range of 50% is remarkable. For both Q2 and Q3 - clearly shows sustainability. There may be Qs around workforce reduction- need to hear mgmt views
-
Subscription model its imp to watch out for cash collection efficiency- which dipped in Q1 to just 5cr, this is back to healthy levels with YoY and QoQ growth.
-
Company has 1100cr+ cash and fund raising of similar amount of 1100 cr will lead to 2200 cr cash - now imp to note that any acquisition may not be pure cash basis so this could be a real large one. IMO this will be the key trigger to watch out for capital allocation efficiency of mgmt, as of date prior investment doesn’t seem to be making any significant dent yet.
-
Annualized EPS in FY21 to be around 110 ( q4 is generally a strong quarter) , valuations at 65PE are still favorable for a very long runway and scarce biz ( both as a business model and being a platform with Moat, add to fact that demand supply issue of such listed biz in india),

Invested from lower levels
9 Likes
Why is the revenue of the company not increasing , how long they can keep cutting costs and boost profitability margin?
3 Likes
https://youtu.be/lRfdOBgaCNY?t=19326

Traffic was 180-190 million Pre-Covid now at 250-270 million which is the new normal
Gained 30-40% more traffic due to accelerated adoption
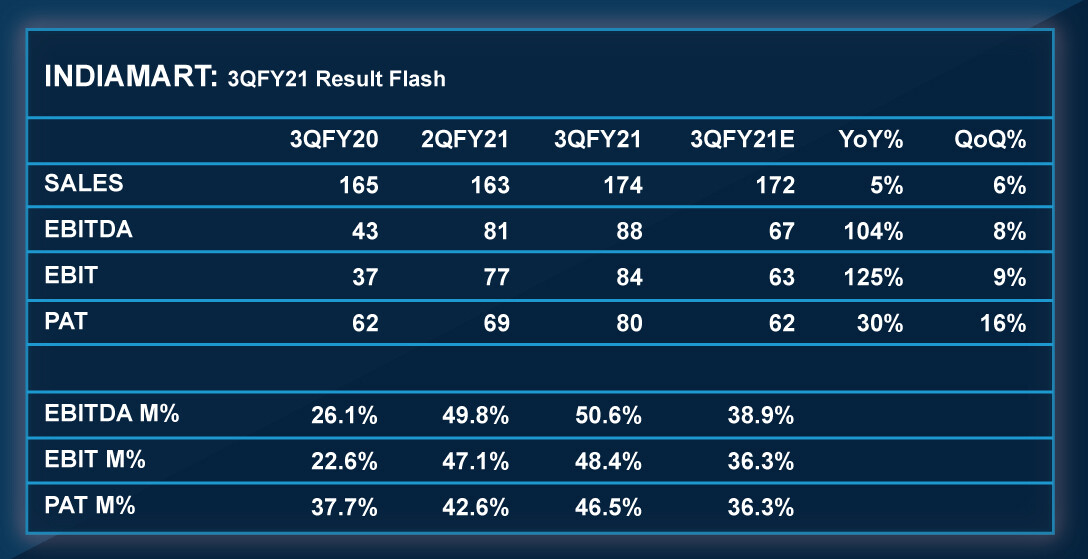
Average annual revenue per subscriber at ~46K
Last 9 months the customer base has remained constant
147000 subscribers at end of last FY vs 148000 at end of Q3FY21
Cost base was ~120 Crores Pre-Covid
100-105 Crores cost must be assumed while calculating the actual profits
This quarter was only 85 Crores,almost 50% margin.
Margins will improve to 30-40% from 25-30% Pre-Covid.
Collection from customers at 179 Cr. this quarter,almost back to last years levels.
Cash on balance sheet yet why fund raising of 1000 Cr.?
Most of the cash(Rs 625 Cr.) is customer advances only 500 Crores is cash.
Looked at many proposals,will take shape in the next year or two for strategic opportunities.
Growth now normalizing as pent up demand largely done.
Will add 5000-6000 Customers per quarter going forward.
4 Likes
I am having trouble valuing this company since the street is valuing it alternatively since when I valued it after Q1 2020 results. The stock has quadrupled since my original investment and I am not sure how to value before increasing my original position. Currently it is valued at 17 lakhs per customer when ARPU is around 45k. I understand the potential and my original hypothesis still stands however I feel valuing this company only on a PE basis isn’t what the street is doing. Does anyone have similiar companies and where IndiaMart stands in term of valuation?
3 Likes
In general have seen subscription platforms biz being valued in range 15 to 25X sales( high growth must, loss making okay). With this yardstick they are on higher spectrum and profit making. Narrative can wildly vary per one’s own bias.( platform with network moat, structural shift to digitization and so on…)
Indiamart for one is benefitting with demand supply situations as well where lots of investment chasing them. Almost every TV investment pundit calling out the name.
Mgmt has indicated QIP plans, any mismatch in pricing could be a pain point( GMMpflauder case) for retail guys. Need to watch out.
Optimist case expect 110 type EPS in FY21 end - possibly 140-150 next year , 1 year forward basis valuations are not that crazy - but again each can have their own thesis to build a narrative 
Opportunity size is huge and inorganic + organic growth ( adjacent revenue streams)avenues exist.
Invested from lower levels: among Top 3
5 Likes
It’s hard to value tech co’s when they are in their high growth phase. I find it helpful to look at the big picture. At $4-$5 billion in mcap, IndiaMart is still a midcap with a very large total addressable market size. They’re currently in a sweet spot with MSME’s digitising rapidly. They have an excellent business model with recurring revenues, high ROCE and strong FCF generation, superior to much larger unicorns like Zomato, Flipkart, PayTM etc. Add to this the scarcity premium attached to tech plays in India.
As long as the business momentum continues and management continues to allocate capital well, I wouldn’t worry too much about current valuations if your entry price is reasonable.
disc. Invested at lower levels, last purchase at 7k
7 Likes
Indiamart euphoria reminds me of Justdial hitting 1800 odd in 2014. They also grew fast 2012-13-14…but 15-16, the pace slowed and then declined.
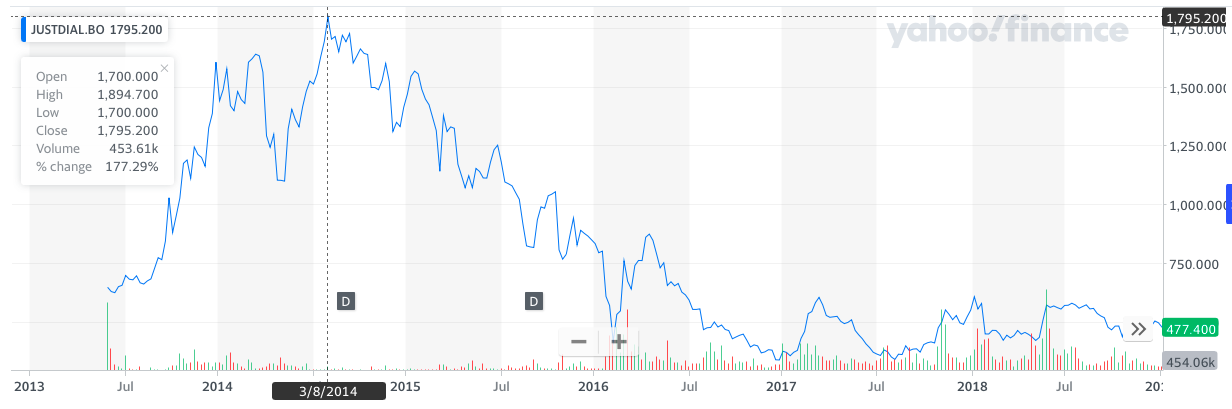
The justification then too was “long term”, “huge market”, “India potential”, “digital”, and so on.
But despite the search engine “moat” in terms of brand keyword traffic (see: Indiamart Intermesh - Indian Alibaba? - #194 by reem )
will the sales revenues grow at the same pace?
Their traffic in Dec has grown less than 1% over 6 months.
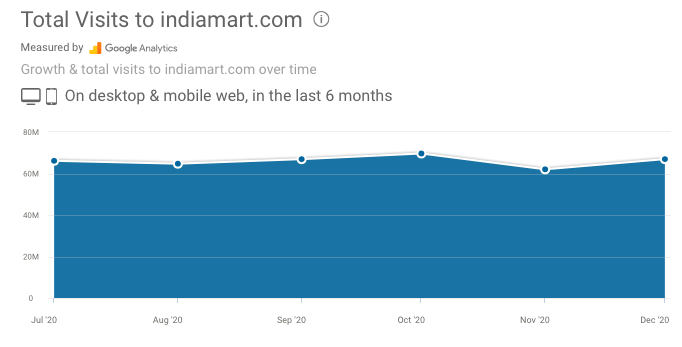
Note: Data above is fairly accurate traffic count as Indiamart has placed Google Analysis tag on their site, and shared stats with Similarweb. So this includes all their mobile traffic also.
The traffic has plateaued. Will sales follow? We don’t know. I am skeptical the sales will match the pace of the stock price growth. There is also a major Google search update in May 2021 (see: Google Page Experience update is all set to launch in May 2021 - Webmasters, hang in there! ). This is a big risk factor as we don’t know how it will impact Indiamart rankings on google search.
disc: exited stock. don’t plan to re-enter at these valuations.
11 Likes
It is not correct to value Indiamart based on its current financials alone. Since the price rise has been quite extraordinary, one needs to invert the problem and ask – what is it that can explain the rise?
The company has Rs.1000 crore of cash in hand, plus another Rs.1000 crore of QIP money can come in. Management has clearly stated they are looking out for acquisitions. A big bang acquisition in some of the “adjacencies” must be on the cards – it could easily be something around a Payment Bank license, an NBFC which will finance the SMEs buying on Indiamart platform or something similar. Or may be a NASDAQ listing is on cards, or may be the promoters are selling out to Amazon. Please note, I have no clue. I am just trying to visualise the answer to the question posed above.
But most likely the Institutional Investors who are buying today know something. The price may be discounting some future event unknown to us, but known to others. If no such thing is on the cards, the rise may be said to be merely speculative. But I wouldn’t jump to that conclusion so soon.
(Disc: Invested)
5 Likes
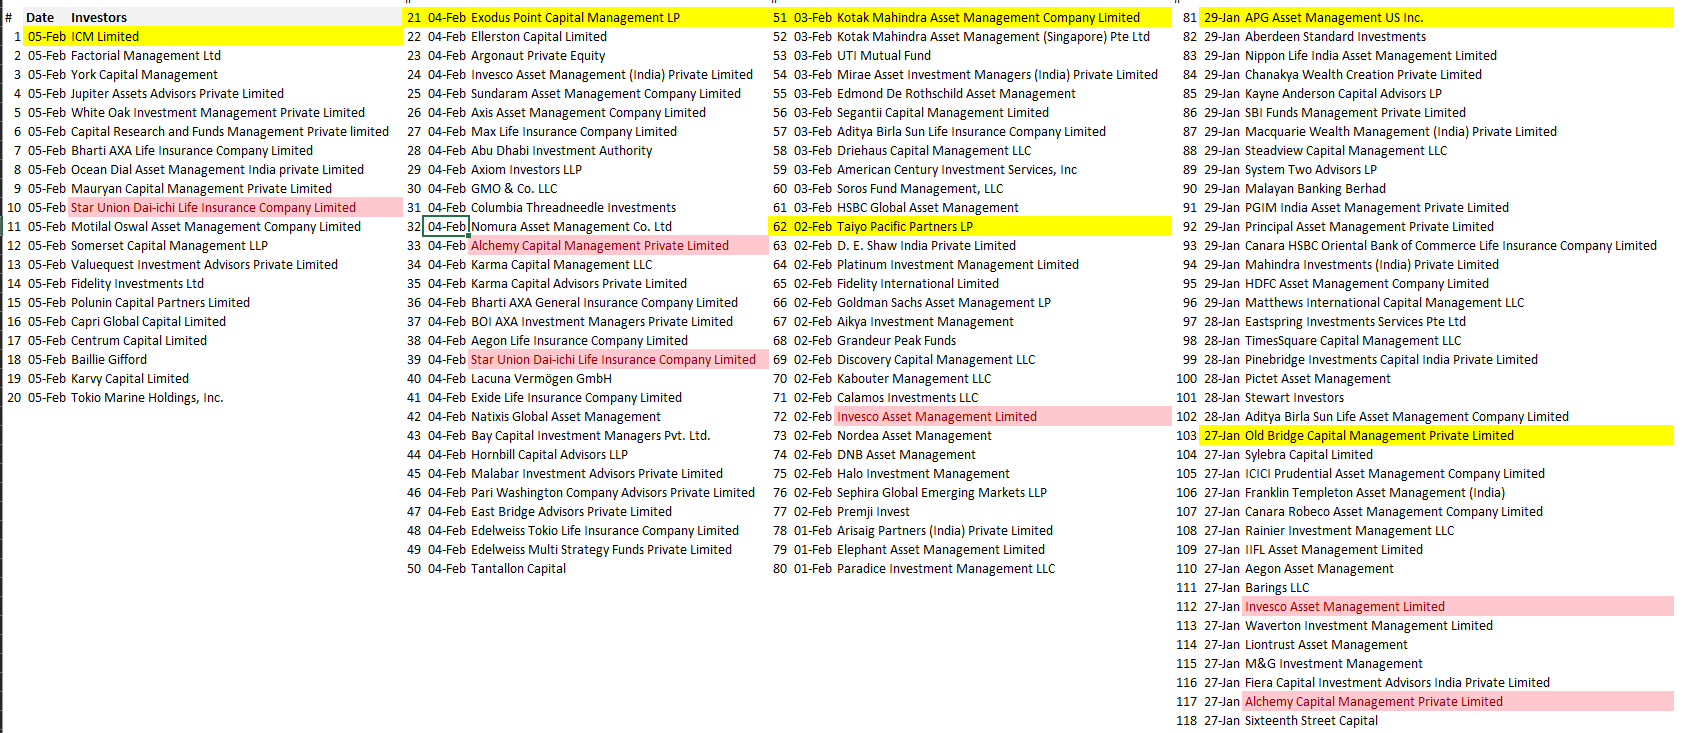
Surprising amount of institutional interest. 118 entities met the management since 27th Jan. There is no known publicly available information that makes the business significantly different from what it was in recent quarters.
6 Likes
Getting a sense that this is propaganda by vested interests :
Disc : Invested with biased views.
4 Likes
Came here to post the same, there seems to be something going out about the company that retail investors are not informed about, maybe a week or two before everyone get to know the story.
But talking about the legalities of the FIR, IndiaMart is a market place so it seems even if in the rarest of scenario there is an action against the accused, would it be against the supplier or the company itself, I feel it should be supplier because of the model.
This week old article regarding similar FIR in Neeshi, mentions
citing India law which does not hold marketplaces responsible for the action or damage caused by vendors.
Disc: Invested hence biased
Can anyone confirm if the promoter actually got arrested? And also has he been released?
Would normally find this unbelievable but quite possible in the current atmosphere.
Disc: Invested
I have heard the investor relations telling people “no one got arrested”
Did anyone attend the EGM today? I had logged in but the telecast simply did not start. It was just showing a message “starting shortly”.
Updating this post:
This report says the meeting started at 11:00 AM and concluded at 11:45 AM and 57 members were present through VC. Was anybody able to view the proceedings? I had logged in through the NSDL e-voting site but the telecast never started. Not sure if there is some mischief here. It allowed me to vote though.
Disclaimer: Invested with 10% PF value since Jan 2020.
After being high share price run up in short time, I was getting worried on valuations. Here trying to value company using simplified version of Prof. Aswath Damodaran methodology to value subscriber based business of Indiamart. This is to start with rough version which can be improved further with new user existing user bifurcation. I haven’t considered other revenue (mainly from investment of cash in hand) and same can compensate for cost part ignored on capex side. I dont think there will be large capex and moderate other income and QIP raised money will take care of Capex requirements.
| Assumptions: | Facts: | |||||||||||||||||
|---|---|---|---|---|---|---|---|---|---|---|---|---|---|---|---|---|---|---|
| Tax Rate | 25% | Current Cash equivalents (Cr) | 1100 | |||||||||||||||
| Discount Rate | 8% | Share Price (Rs) | 9211 | |||||||||||||||
| Paying Subscriber Growth rate | 15% | Shares outstanding (Cr) | 2.91 | |||||||||||||||
| Subscription Fees Growth Rate | 10% | Market Cap (Cr) | 26822 | |||||||||||||||
| Cost growth rate | 10% | QIB amount to be raised (Cr) | 1500 | |||||||||||||||
| QIB placement Price (Per share in Rs) | 9000 | |||||||||||||||||
| No. of new shares issued (Cr) | 0.167 | |||||||||||||||||
| Shares outstanding after QIB (Cr) | 3.08 | |||||||||||||||||
| Avg tenure of multi year subsctiption | 3 | |||||||||||||||||
| 1 | 2 | 3 | 4 | 5 | 6 | 7 | 8 | 9 | 10 | 11 | 12 | 13 | 14 | 15 | ||||
| Item | FY18 | FY19 | FY20 | FY21 | FY22 | FY23 | FY24 | FY25 | FY26 | FY27 | FY28 | FY29 | FY30 | FY31 | FY32 | FY33 | FY34 | FY35 |
| Total Subscribers (in '000) | 4,700 | 5,500 | 6,000 | 6,600 | 7,260 | 7,986 | 8,785 | 9,663 | 10,629 | 11,692 | 12,862 | 14,148 | 15,562 | 17,119 | 18,831 | 20,714 | 22,785 | 25,063 |
| Paying Subscribers | 1,08,000 | 1,30,000 | 1,47,000 | 1,56,000 | 1,79,400 | 2,06,310 | 2,37,257 | 2,72,845 | 3,13,772 | 3,60,837 | 4,14,963 | 4,77,208 | 5,48,789 | 6,31,107 | 7,25,773 | 8,34,639 | 9,59,835 | 11,03,810 |
| Avg. Subscription per Subscriber (Rs) | 38,000 | 38,370 | 42,270 | 48,000 | 52,800 | 58,080 | 63,888 | 70,277 | 77,304 | 85,035 | 93,538 | 1,02,892 | 1,13,181 | 1,24,500 | 1,36,950 | 1,50,645 | 1,65,709 | 1,82,280 |
| Revenue from Operations (in Cr) | 411 | 507 | 639 | 675 | 947 | 1,198 | 1,516 | 1,917 | 2,426 | 3,068 | 3,881 | 4,910 | 6,211 | 7,857 | 9,939 | 12,573 | 15,905 | 20,120 |
| % Growth | 23.4% | 26.0% | 5.6% | 40.3% | 26.5% | 26.5% | 26.5% | 26.5% | 26.5% | 26.5% | 26.5% | 26.5% | 26.5% | 26.5% | 26.5% | 26.5% | 26.5% | |
| Total Costs (in Cr) | 487 | 490 | 472 | 340 | 374 | 411 | 453 | 498 | 548 | 602 | 663 | 729 | 802 | 882 | 970 | 1,067 | 1,174 | 1,291 |
| %Growth | -3.7% | -28.0% | 10.0% | 10.0% | 10.0% | 10.0% | ||||||||||||
| EBIDTA (in Cr) | -76 | 17 | 167 | 335 | 573 | 787 | 1,063 | 1,420 | 1,878 | 2,466 | 3,219 | 4,181 | 5,410 | 6,975 | 8,969 | 11,506 | 14,732 | 18,829 |
| %Growth | 882.4% | 100.6% | 71.1% | 37.3% | 35.1% | 33.5% | 32.3% | 31.3% | 30.5% | 29.9% | 29.4% | 28.9% | 28.6% | 28.3% | 28.0% | 27.8% | ||
| EBIDTA Margins | -18.5% | 3.4% | 26.1% | 49.6% | 60.5% | 65.7% | 70.1% | 74.0% | 77.4% | 80.4% | 82.9% | 85.2% | 87.1% | 88.8% | 90.2% | 91.5% | 92.6% | 93.6% |
| Depreciation | 3 | 4 | 21 | 23 | 24 | 25 | 27 | 28 | 29 | 31 | 32 | 34 | 36 | 37 | 39 | 41 | 43 | 46 |
| Interest | 0 | 0 | 3 | 9 | 9 | 9 | 9 | 9 | 9 | 9 | 9 | 9 | 9 | 9 | 9 | 9 | 9 | 9 |
| PBT (in Cr.) | -79 | 13 | 143 | 303 | 540 | 752 | 1,028 | 1,383 | 1,840 | 2,426 | 3,178 | 4,138 | 5,365 | 6,929 | 8,921 | 11,456 | 14,679 | 18,775 |
| % of subscribers opting for multi year plan | 10.0% | 22.2% | 26.0% | 19.2% | 20.0% | 20.0% | 20.0% | 20.0% | 20.0% | 20.0% | 20.0% | 20.0% | 20.0% | 20.0% | 20.0% | 20.0% | 20.0% | 20.0% |
| No. of subscribers for multi year plan | 10,800 | 26,462 | 28,532 | 19,393 | 26,295 | 32,124 | 35,767 | 40,991 | 47,403 | 54,489 | 62,614 | 72,021 | 82,831 | 95,251 | 1,09,538 | 1,25,970 | 1,44,865 | 1,66,595 |
| Deferred Revenue change (in Cr) | 82 | 203 | 241 | 186 | 278 | 373 | 457 | 576 | 733 | 927 | 1171 | 1482 | 1875 | 2372 | 3000 | 3795 | 4801 | 6073 |
| Total Deferred Revenue | 423 | 585 | 683 | 647 | 711 | 852 | 984 | 1,145 | 1,361 | 1,633 | 1,975 | 2,408 | 2,956 | 3,649 | 4,526 | 5,636 | 7,039 | 8,814 |
| Tax Rate | 30% | 25% | 25% | 25% | 25% | 25% | 25% | 25% | 25% | 25% | 25% | 25% | 25% | 25% | 25% | 25% | ||
| Tax | 0 | 27 | 43 | 76 | 135 | 188 | 257 | 346 | 460 | 607 | 794 | 1,035 | 1,341 | 1,732 | 2,230 | 2,864 | 3,670 | 4,694 |
| Cash Generated from operations after Tax | 6 | 193 | 365 | 445 | 716 | 972 | 1,263 | 1,650 | 2,151 | 2,786 | 3,596 | 4,629 | 5,943 | 7,615 | 9,739 | 12,438 | 15,863 | 20,209 |
| PV of Futre Cash from operations | 445 | 663 | 833 | 1,003 | 1,213 | 1,464 | 1,756 | 2,098 | 2,501 | 2,973 | 3,527 | 4,177 | 4,939 | 5,833 | 6,880 | |||
| Cash on Books | 1,100 | |||||||||||||||||
| Present Value of Company (in Cr) | 41,406 | |||||||||||||||||
| Current Market Cap (in Cr) | 26,822 |
Excel attached for ref. Pls suggest corrections if any as trying it first time to value subscription based business.
Contra Views invited.
Indiamart valuation.xlsx (20.7 KB)
you are assuming 15% growth YOY in paying subscribers. what happens if growth is lesser? say 10%?
I believe the topline will grow around 20-24 percent on back of 15-19 percent topline growth and ARPU increasing at 5 percent. I don’t expect the ARPU to rise by 10 percent for 15 years, something like 5 percent is more consistent with past trends.
Found this thread interesting on the valuations of Indiamart. disc: Holding
1 Like