
Well the major assets on a telcos books would be licenses etc. Not sure how their value would go down even in the case of bankruptcy? Maybe you could clarify?
I don’t think that is the case. At least not according to data released by RBI. Credit cards? Yes, CASA? No.
IDFCF:
| month | debit cards | change |
|---|---|---|
| december | 2666051 | |
| january | 2773581 | 107530 |
| february | 2858871 | 85290 |
| march | 2935878 | 77007 |
| april | 3003620 | 67742 |
| may | 3038754 | 35134 |
| june | 3109070 | 70316 |
| july | 3191765 | 82695 |
HDFCB:
| month | debit cards | change |
|---|---|---|
| december | 35499961 | |
| january | 35969705 | 469744 |
| february | 36455346 | 485641 |
| march | 36695799 | 240453 |
| april | 37041375 | 345576 |
| may | 37259604 | 218229 |
| june | 37791657 | 532053 |
| july | 38305455 | 513798 |
I don’t want to upset anyone by comparing with HDFCB ![]() actually wanted to compare with ICICI because of management pedigree but something weird is going there (closed inactive accounts?):
actually wanted to compare with ICICI because of management pedigree but something weird is going there (closed inactive accounts?):
| month | debit cards | -8640472 |
|---|---|---|
| december | 45379093 | |
| january | 43621647 | -1757446 |
| february | 39195525 | -4426122 |
| march | 39001364 | -194161 |
| april | 39073158 | 71794 |
| may | 39120487 | 47329 |
| june | 39111158 | -9329 |
| july | 36738621 | -2372537 |
Anyway, if we ignore ICICI data, one can conclude that rate of issuing new debit cards is a function of number of branches rather than of interest rate. Seems to be because bank employees proactively solicit new accounts. I would be interested in knowing how many customers spontaneously opened CASA accounts. If that number is low we can expect opex to remain high for the foreseeable future.
We can observe slowdown during second wave in April-May when lockdowns restricted movements, not only lockdowns but I suspect many employees unfortunately were affected or someone close to them did, and this happened across lending organizations. I’m following another small lender who said ~8% of employees tested positive, and that increases NPAs because it affects collections. One can only imagine how many borrowers themselves were affected and their livelihoods. Second was much worse than the first, anecdotally I know only 2 people personally who tested positive last year but this year more than 10.
The only thing I was disappointed with so far was high opex, I thought was it really necessary to aggressively expand during a pandemic after going through multiple big ticket losses in the midst of a merger. This data justifies high opex to some extent, other players are not going to sit around doing nothing waiting for IDFCF to fix its issues.
Disc: largest holding
9 Likes
Hey, can you please include the source in the post also? ![]()
Sure Reserve Bank of India - Bankwise ATM/POS/Card Statistics
I didn’t post because this was already covered in the thread earlier. IMO every investor new to a company should go through all posts thoroughly. You’ll get to see bull and bear cases discussed and make an informed decision. This especially important in the case of IDFCF because it’s story so far is interesting, and that’s an understatement ![]()
Edited wrong link
3 Likes
Actually credit cards is one of fastest growing segment for IDFCF. What is also surprising is that their credit card spends are far better than most companies.
See this:
Raw updated data for July & june
| Bank | Month | PoS Transactions | Value of Transactions (in Lac) | Outstanding cards | Transaction / card | Value / Transaction | Spend / card |
|---|---|---|---|---|---|---|---|
| IndusInd Bank | June | 3560605 | 257051 | 1569485 | 2.268645447 | 7219.306831 | 16378.04758 |
| July | 4274124 | 332221 | 1590723 | 2.68690652 | 7772.844213 | 20884.90579 | |
| Avg | 3917364.5 | 294636 | 1580104 | 2.479181434 | 7521.281208 | 18646.62073 | |
| IDFCF | June | 1247150 | 59461 | 386801 | 3.224267776 | 4767.750471 | 15372.50421 |
| July | 1536823 | 72483 | 425260 | 3.613843296 | 4716.418221 | 17044.39637 | |
| Avg | 1391986.5 | 65972 | 406030.5 | 3.428280634 | 4739.41378 | 16248.04048 | |
| American Express | June | 3603920 | 179357 | 1482771 | 2.430530406 | 4976.719794 | 12096.06878 |
| July | 4113708 | 223532 | 1469540 | 2.799316793 | 5433.832445 | 15211.01841 | |
| Avg | 3858814 | 201444.5 | 1476155.5 | 2.614097228 | 5220.37341 | 13646.56366 | |
| HDFC Bank | June | 40002494 | 1753372 | 14828277 | 2.697716936 | 4383.15671 | 11824.51609 |
| July | 47343310 | 2083302 | 14763662 | 3.206745725 | 4400.414758 | 14111.01121 | |
| Avg | 43672902 | 1918337 | 14795969.5 | 2.95167559 | 4392.510944 | 12965.26733 | |
| Citi Bank | June | 10369231 | 302718 | 2603989 | 3.982056376 | 2919.387175 | 11625.16432 |
| July | 12284152 | 362214 | 2599024 | 4.726448082 | 2948.628444 | 13936.53925 | |
| Avg | 11326691.5 | 332466 | 2601506.5 | 4.353897059 | 2935.243712 | 12779.74896 | |
| ICICI Bank | June | 28302499 | 1188705 | 11034268 | 2.564963892 | 4200.000148 | 10772.84873 |
| July | 33450669 | 1434095 | 11239598 | 2.976144609 | 4287.193778 | 12759.30865 | |
| Avg | 30876584 | 1311400 | 11136933 | 2.772449471 | 4247.231494 | 11775.23471 | |
| SBI | June | 31096314 | 1221507 | 12044135 | 2.581863621 | 3928.140808 | 10141.92385 |
| July | 36729081 | 1434172 | 12242481 | 3.000133796 | 3904.731512 | 11714.71698 | |
| Avg | 33912697.5 | 1327839.5 | 12143308 | 2.792706691 | 3915.464112 | 10934.74282 | |
| Axis Bank | June | 14465088 | 519105 | 7136582 | 2.026892986 | 3588.675022 | 7273.860232 |
| July | 16912127 | 615854 | 7229303 | 2.339385553 | 3641.493468 | 8518.857212 | |
| Avg | 15688607.5 | 567479.5 | 7182942.5 | 2.184147722 | 3617.143841 | 7900.376482 | |
| Kotak Bank | June | 4307469 | 150400 | 2355745 | 1.828495444 | 3491.609574 | 6384.392199 |
| July | 4942016 | 183821 | 2388819 | 2.068811408 | 3719.554935 | 7695.057683 | |
| Avg | 4624742.5 | 167110.5 | 2372282 | 1.949491039 | 3613.401179 | 7044.293216 | |
| Federal Bank | June | 32377 | 819 | 14803 | 2.187191785 | 2529.573463 | 5532.662298 |
| July | 63331 | 2001 | 20687 | 3.061391212 | 3159.59009 | 9672.741335 | |
| Avg | 47854 | 1410 | 17745 | 2.696759651 | 2946.462156 | 7945.900254 |
Working sheet:
IDFC Bank .xlsx (149.5 KB)
Some conclusion
Bounce back from 2nd wave visible in growth in both spend per transaction and transactions per card. IDFCF is growing fairly well compared to most banks with exception of federal which is on much smaller base.
Disc: Invested, biased
7 Likes
Right, but I was referring to new cards issued and that’s slowed down. I think in April they issued some ~60K new cards, in July it was ~38K if I’m not mistaken. This slow down is a good thing though because complete recovery will take time. I hope they don’t ramp it up quickly. Growing home loans faster would be a better choice now.
This is an expected behaviour right ? They have a decent waitlist before launching the product So, in first 2-3 months volumes will be from the leads sourced during waitlist period.
I think their card disbursements runrate is improving.
Incremental cards additions= New cards issued- Cards closed so, on higher base the incremental numbers will be tough.
2 Likes
Agree with the part about sourcing. That is the most likely explanation. But I don’t think there would be many closed cards so soon, especially when the interest rates are far lower compared to competitors.
[quote=“sahil_vi, post:1914, topic:3279”]
low base effect
[/quote ]
Isn’t base only relevant when using percentage changes? I don’t see how a smaller or larger base would influence absolute value changes every month. Agreed about the new product excitement. But that’s exactly the reason for the bank to be cautious, who knows how the new rates will influence consumer spending. The bank needs to continously analyze credit card behavior.
This topic is temporarily closed for at least 4 hours due to a large number of community flags.
This topic was automatically opened after 32 hours.
The points u mentioned are all true, but those are the things the management wants to see. There is a bit else which it doesn’t.
For one,
Timing of Equity Dilution.
I have read that management is not to keen on increasing the advances but turning around the quality: moving away from low yield wholesale to high yield retail advances.
Then what was the need for equity dilution which they recently did and got Rs3000 crores in the books by selling equity shares at Rs.57 per share?
From the AR:
“In June 20, even while COVID first wave was
raging, we raised Rs.2,000 crore of equity. Again, in April
21, the COVID second wave had just reared its head,
we raised Rs.3,000 crore of equity. We enjoy support of
long-term investors. Our capital adequacy is strong at
15.56% as of June 30, 2021”
They diluted twice in two years to maintain adequate CAR. Investors don’t like frequent dilutions. This keeps the share price down for long periods, till EPS growth picks up (which looks pretty distant).
And still CAR is barely adequate, probably lowest in the category. One more jolt, and they’d need more cash.
In the recent Quarter they earned a PPOP of Rs 1001. A good number, but cannot suffice to cover for provisioning and CaR, should there be any further quality issues with Assets.
Furthermore, equity Dilution is good when done at proper timing. When the stock price is soaring. That way dilution is far less. But, since it was done at such a low price, makes me suspicious whether it was a desperate move.
5 Likes
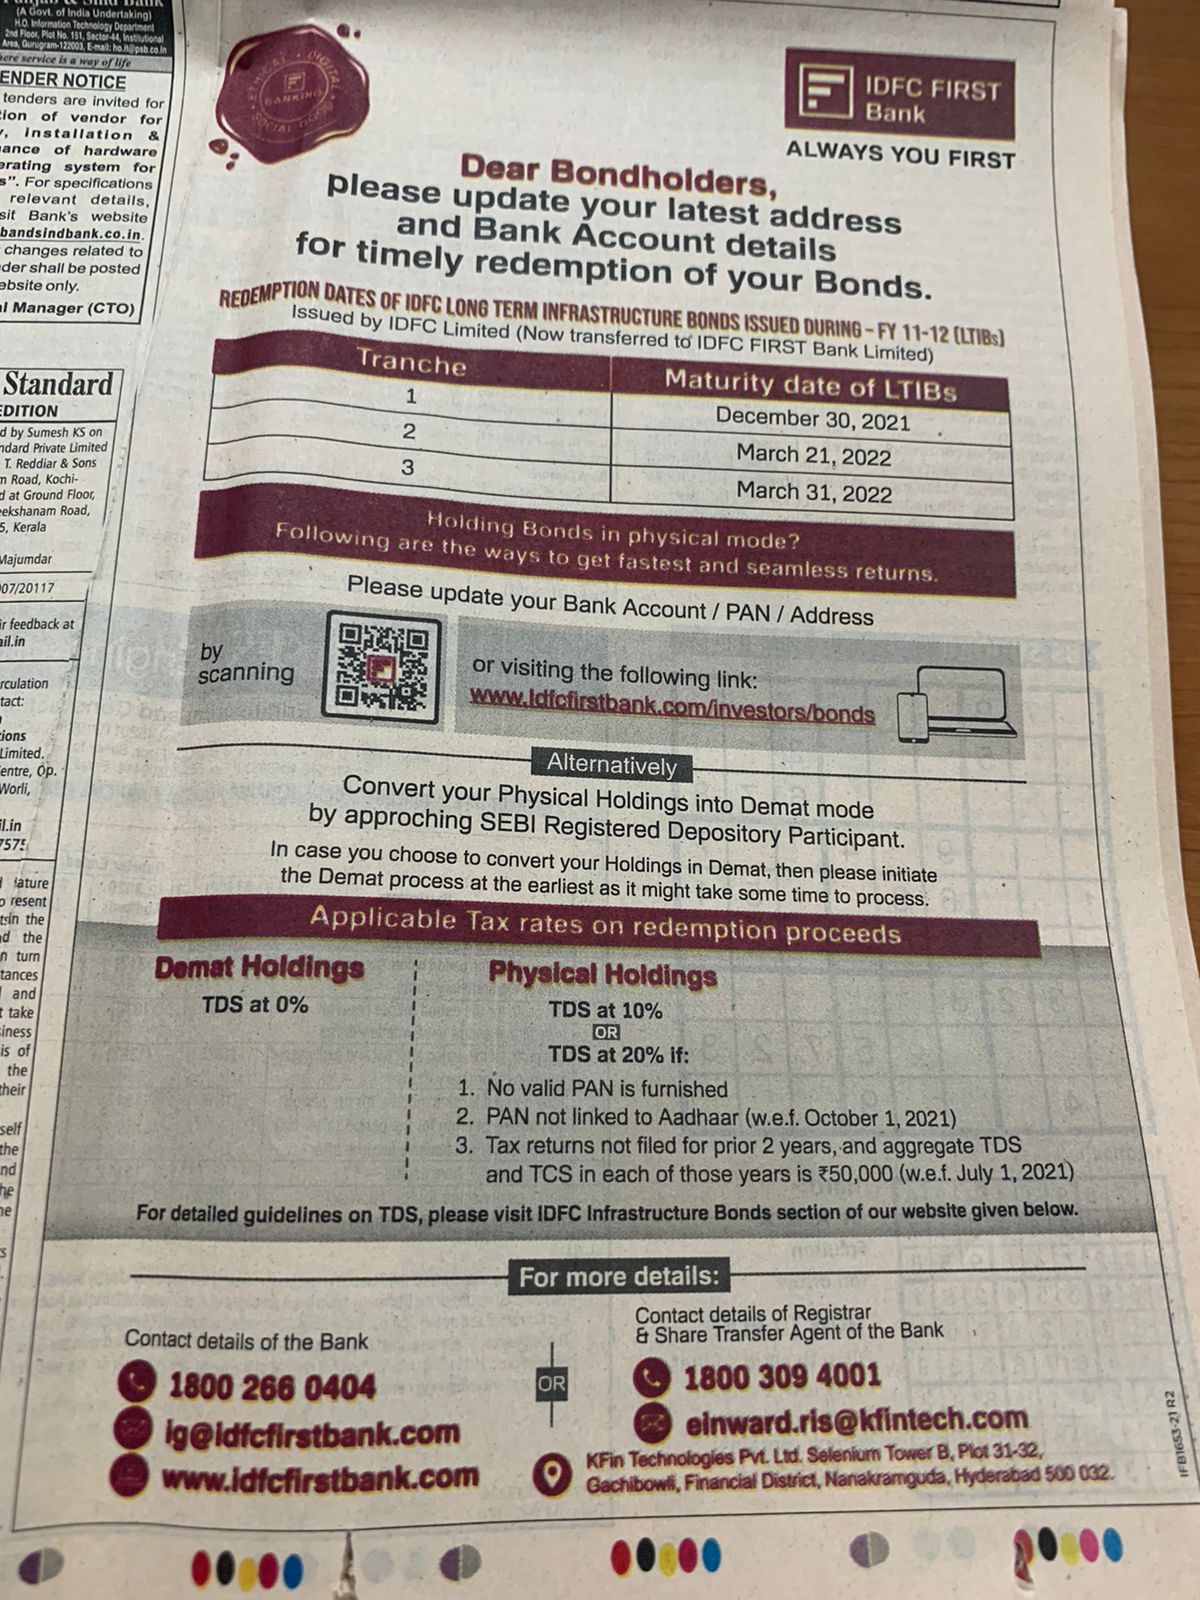
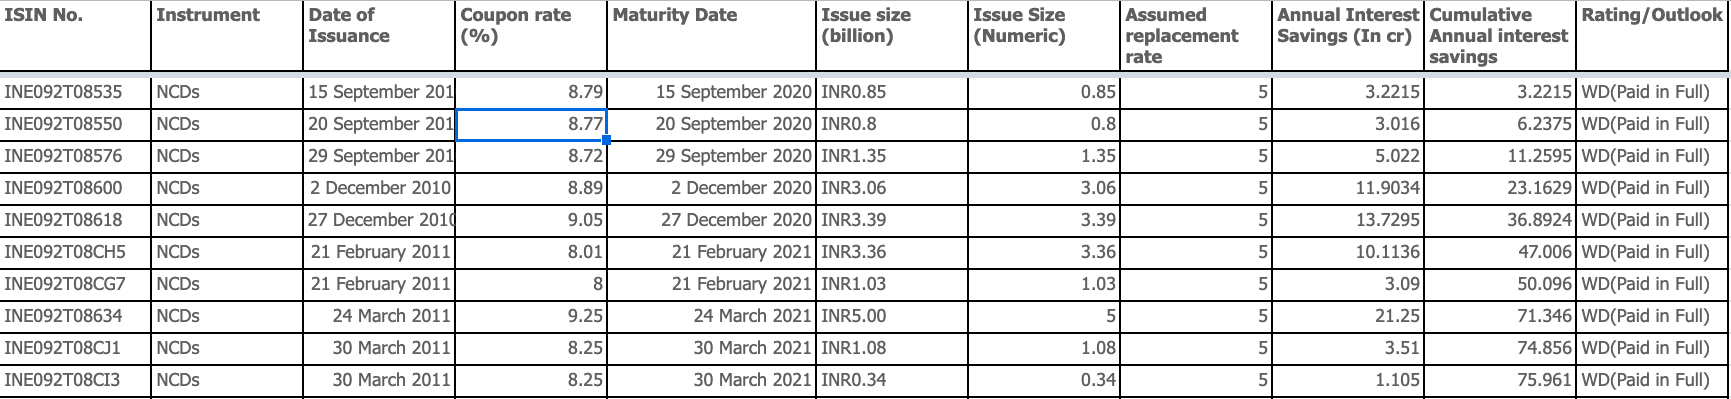
Someone had forwarded me this. I have used this as a motivating example to precisely estimate how much interest outgo they can save and when.
Someone has already posted this wonderful link. This gives exact distribution of the NCDs issued at high rates of interest.
Using this we can exactly estimate what impact CASA has had & will have (and when will it have) on bottomline.
IDFCF infra bonds.xlsx (16.4 KB)
Google sheets link for same sheet.
As an example: See bellow screenshot:
Shows that 75 cr has been added to bottomline between Sep 20 & now.
Additional 90 cr annual interest saving is expected by the time we reach end of FY23.
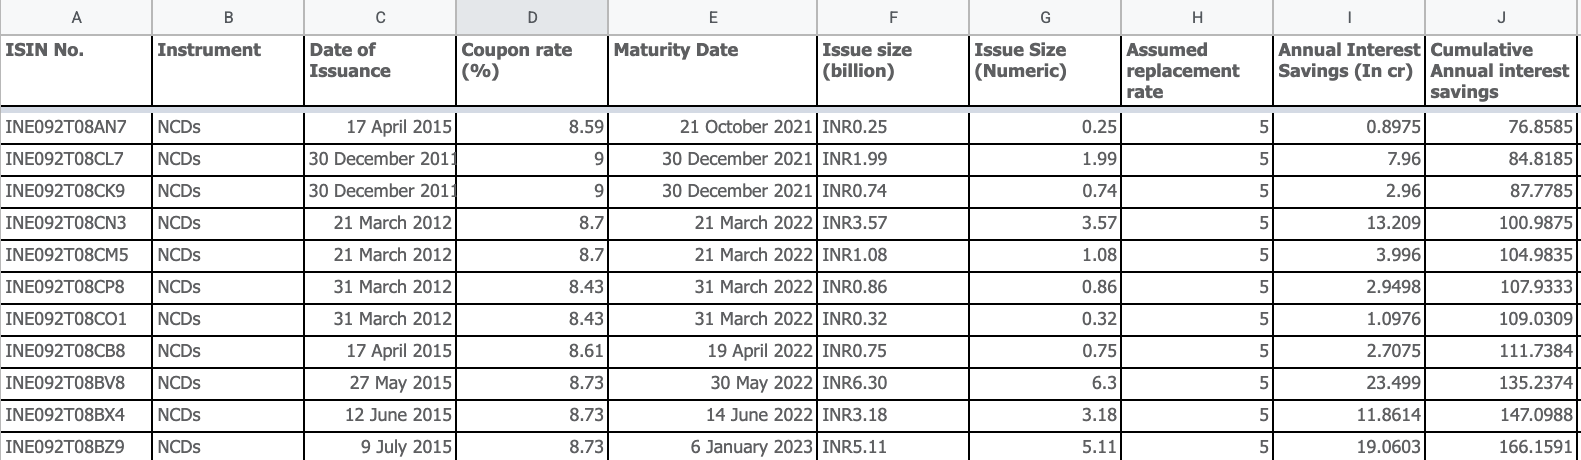
Note that all of this data is ONLY for interest saved on the NCDs covered by indiaratings link, which were a total of 20000 cr in Sep20. Total savings of 800 cr is expected with majority being realised by around FY25 end.
14 Likes
This data posted by Sahil on NCDs presents an idea for IDFCF CFO. The average rate on NCDs is 9%. The incremental liability rate for IDFCF is 5%. If they were to pass on part of the differential benefit to the bond holders as an extra incentive, say around 1% per annum, for premature encashments before 31 Dec 21, most of the NCDs would probably get encashed. It would be a win win for both the parties. My knowledge about bond markets and bond players is zero. I speak merely as a layman.
2 Likes
Maybe I did not understand what you said, but exchange of a 9% secured NCD for another financial instrument at say an effective yield of 6% - I assume you mean Desposits - will have to be done on an equal footing (i.e. fair value). No one is going to exchange a 9% fixed paper for a 6% deposit with the same party at the same price.
This means IDFC F buying back the NCDs at a good premium, with no gain in value. Why would IDFC F do that if instead every Rupee it has can be lent out at 14.5% as they claim?
5 Likes
It won’t make a difference. The bond holders would lose 1 year of interest and may want compensation of that in the form of adjusted interest rate or increase in redemption value. In either case, it won’t affect IDFC FB in so far as the time adjusted savings for it would remain similar. That’s my understanding.
And Sahil has posted some great data. With the CoF going to come down further with redemption of these NCDs in the next 2/3 years, the NIMs should improve and hence every other operating metric (PPOP, etc.).
I feel at current valuations, market is really underpricing the future events that are likely to play out. D - Invested with 10% of PF.
3 Likes
Confused with this one. Isn’t it 2.5% of just provisions? Provisions + write-offs is already at ~3% (1879cr + 1400cr) right now @sahil_vi
Imagine 2 headers :
Provision
Write-off.
Each loan first comes to header 1 then moves to header 2 when it goes into some formula like 1 year overdue etc.
Meaniny it shows up in provision first, then in write-off. This is why provision + write-off (not a mathematical addition, a set union). But they can’t be added because everything in provision also includes the write-offs.
4 Likes
Key point from the linkedin post:-
“our retail deposits swelled by over Rs. 10,000 crores in Q2 21, highest ever! That’s the sort of customer trust in us. We dropped rates to stem the inflow, but our customers are still with us.”

1 Like
Credit cost is provisions + writeoffs. So the 1,879 figure you see already includes both.
I won’t be able to attend the AGM but incase someone from here is attending do ask VV if they are sticking to their credit cost guidance of 2.5% for FY22 now that we are almost two and a half months into Q2. And secondly, the maturity dates of the Vodafone bonds and if they mature in Feb 2022. Thanks
3 Likes