Have used icicidirect for 12 years now. Like the platform, intefrace and execution capabilities.
Charges are high. thought of shifting to Zeodha but shifting costs are high. Brrokerage has however reduced slighly over the years.
Their research is average and account for a large percentage of fixed costs.
have not invested:
the main reasons are
shift to discount brokerages is a reality and will continue.
Company is benefitting from a bull market.
Company generates huge revenue share from recurring mutual fund distribution charges. Shift to direct plans will likely kill this business.
Can we expect more share selling by these promoters.
In my opinion, as SEBI has started probe against ICICI Prudential AMC in regards of heavy subscription during IPO. If found any discrepancies, they have to offload some of the stake in open market. And that warrants the fall in scrip price will continue to fall in coming time.
ICICI Securities has prepaid model which has less brokerage charges. It goes as low as 0.12% based on the plan you choose. Anybody seen that ? Has anybody used this ?
In prepaid model I(as NRI) am paying 0.35% + regulatory charges ,its not 0.12%
Depending on the prepaid brokerage that you are willing to pay, the brokerage changes. It starts from 0.12%. See here: http://content.icicidirect.com/mailimages/ic_PB_April2017.html
Many full service brokers also offer this and SBI starts with 0.1% with lifetime no AMC. I think ICICI and HDFC does waiver of AMC (or discounted AMC) if the value is above certain threshold.
This thread is for discussing ICICI Securities Ltd and not brokerage. For brokerages, go here: Selecting a broker
This questions integrity of entire organization culture. There are enough examples in history about cistomers/shareholders are taken for a ride. There is no reason to consider them better than PSU as far as corporate governance is concerned.
It’s the genes, investor. Its the same evil everywhere. ICICI Pru Life insurance risks the livelihood of gullible investors in quest to meet Internal Premium targets. ICICI DNA runs deep in all these companies - use any and every means to make profits. It starts right at the top, with ICICI Ceo’s questionable role in the Dhoot dealings.
PSU’s merely bungle, but ICICI actively subterfuges investor/customer/share holder interests.
is there any difference between ICICI direct and ICICI securities? I found two different research reports with different target prices on the same stock. e.g. after latest DCB results ICICI sec has given 240 target but direct.com 170 if I am not wrong.
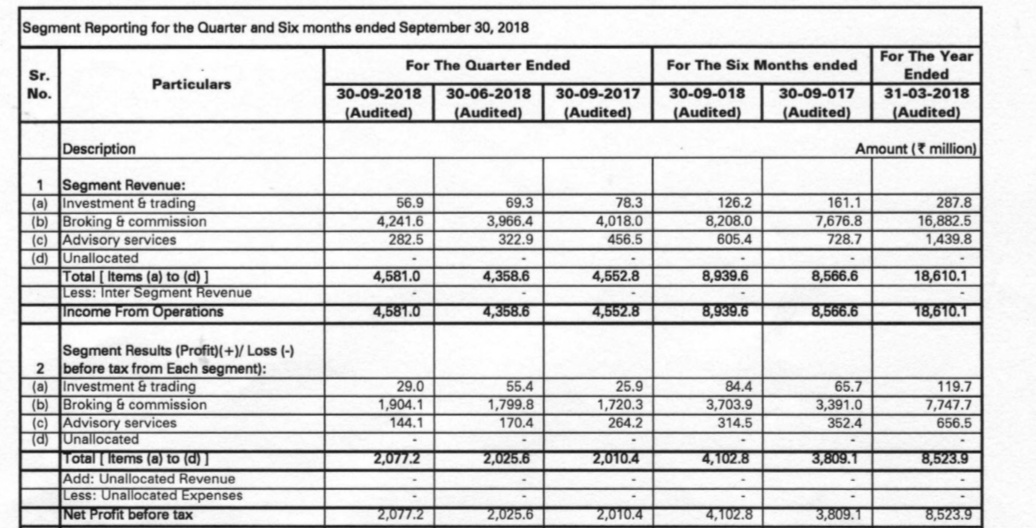
ICICI Sec Q1 demonstrates how fickle broking revenues can be - especially when a vast majority of it comes from retail clientele. Some panic for a few days and retail brokerage can dry up quickly. A heartening takeaway from the results was the steady increase in non-broking revenues (from distribution) which should steady the ship somewhat in turbulent times. Stock’s still pricey at around0 20 PE.
Table below shows market share of brokers ranked by their size
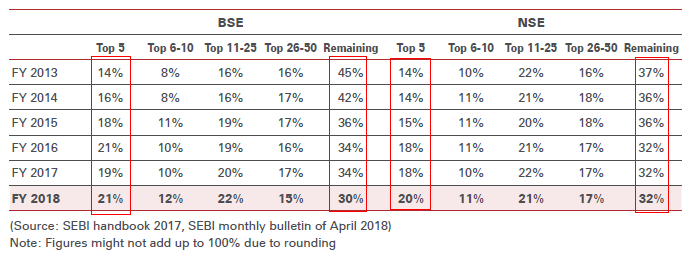
Source: ISEC annual report 2018
Over last 5 years small brokers (ranked > 50) have lost market share to top 5 brokers while the middle tier has largely maintained their market share. Especially on BSE this trend is well pronounced where small brokers lost 15% points market shares to both big and small. On NSE as well, small brokers lost about 5% points share to large brokers which increased their market share from 14% to 20%.
These changes are not just statistical sampling errors but an indication of underlying structural change in the industry. As trading is becoming more and more technology driven with mobile devices, and algos taking a larger share of the volume. Small brokers which typically are brokers for a community of small businessmen in Mumbai and Delhi and other metros are unable to keep up the pace of technological evolution while their clients (especially their next generation) are migrating to tech savvy brokers.
With every bear market, a small set of these brokers are likely to fold with their business moving to larger brokers. In 2016, we can see that share of large brokers jumped 3% while share of small brokers dropped by a similar amount and that became the new normal since then.
This trend will provide a cushion to fall in revenue during bear markets which is the major risk for ICICI Securities. As overall volumes on exchanges drop during bear markets, larger brokers are likely to gain market share softening the blow. While bear market will be pretty bad for this company in the short term, it will end up strengthening its competitive advantage in the long run by eliminating marginal weak players.
Market risk is the biggest risk facing ISEC. In order to assess this risk, I performed some analysis of trading volumes on NSE and its correlation to ISEC revenue. Here is the data
Trading volumes on NSE CASH egment
| FY | NSE Mcap | NSE Turnover | Delivery Turnover | NSE ADTO | ISEC Income | ISEC PAT | Turnover / Mcap | Delivery % |
|---|---|---|---|---|---|---|---|---|
| 1995 | 363,350 | 1,805 | 898 | 17 | 0% | 50% | ||
| 1996 | 401,459 | 67,287 | 11,775 | 276 | 17% | 17% | ||
| 1997 | 419,367 | 294,503 | 32,640 | 1,176 | 70% | 11% | ||
| 1998 | 481,503 | 370,193 | 59,775 | 1,520 | 77% | 16% | ||
| 1999 | 491,175 | 414,474 | 66,204 | 1,651 | 84% | 16% | ||
| 2000 | 1,020,426 | 839,052 | 82,607 | 3,303 | 82% | 10% | ||
| 2001 | 657,847 | 1,339,510 | 106,278 | 5,337 | 204% | 8% | ||
| 2002 | 636,861 | 513,167 | 71,765 | 2,078 | 81% | 14% | ||
| 2003 | 537,133 | 617,989 | 87,956 | 2,462 | 320 | 108 | 115% | 14% |
| 2004 | 1,120,976 | 1,099,535 | 221,364 | 4,328 | 372 | 157 | 98% | 20% |
| 2005 | 1,585,585 | 1,140,071 | 277,102 | 4,506 | 230 | 64 | 72% | 24% |
| 2006 | 2,813,201 | 1,569,556 | 409,353 | 6,253 | 474 | 157 | 56% | 26% |
| 2007 | 3,367,350 | 1,945,285 | 544,434 | 7,812 | 438 | 64 | 58% | 28% |
| 2008 | 4,858,122 | 3,551,038 | 972,803 | 14,148 | 749 | 150 | 73% | 27% |
| 2009 | 2,896,194 | 2,752,023 | 611,535 | 11,325 | 518 | 6 | 95% | 22% |
| 2010 | 6,009,173 | 4,138,024 | 917,705 | 16,959 | 746 | 124 | 69% | 22% |
| 2011 | 6,702,616 | 3,577,412 | 979,269 | 14,048 | 708 | 113 | 53% | 27% |
| 2012 | 6,096,518 | 2,810,893 | 785,268 | 11,289 | 718 | 77 | 46% | 28% |
| 2013 | 6,239,035 | 2,708,279 | 797,504 | 10,833 | 706 | 72 | 43% | 29% |
| 2014 | 7,277,720 | 2,808,488 | 823,042 | 11,189 | 812 | 89 | 39% | 29% |
| 2015 | 9,930,122 | 4,329,655 | 1,276,589 | 17,818 | 1,210 | 295 | 44% | 29% |
| 2016 | 9,310,471 | 4,236,983 | 1,252,658 | 17,154 | 1,125 | 239 | 46% | 30% |
| 2017 | 11,978,421 | 5,055,913 | 1,479,963 | 20,387 | 1,404 | 339 | 42% | 29% |
| 2018 | 14,044,152 | 7,234,826 | 2,019,893 | 29,410 | 1,859 | 559 | 52% | 28% |
| 2019 | 14,292,302 | 3,990,204 | 1,008,624 | 32,087 | 56% | 25% | ||
| CAGR | 17% | 16% | 22% | 17% | 12% | 12% |
Notes
- All numbers are Rs Cr (except %)
- FY 19 data is until Sept 2018
- ADTO = Average Daily Turnover
Source: NSE (for trading volume data) and ICICI Sec for company data
As the table above shows, volumes on NSE is growing at around 16% CAGR about the same as growth in total market cap which is also growing at around 17% CAGR. Delivery volume is growing at a high rate mainly because delivery % was low few years ago which appears to have peaked at 30%. Going forward, delivery volume could grow at around same rate as total volume. ISEC revenue as grown at a lower 12% CAGR mainly because brokerage rates may have dropped as a % of deliverable volume.
Although bulk of the volume on NSE is coming from F&O segment, ISEC revenue is highly correlated to volumes in the cash segment (especially delivery based volume). Hence I am using cash segment data for this analysis. F&O volume numbers are also based on notional value of contracts. Actual premium paid is only a fraction of the notional value. brokerage on F&O trades is also quiet low compared to brokerage on delivery based cash trades so volumes in the cash segment is more important for assessing revenue risk for Isec.
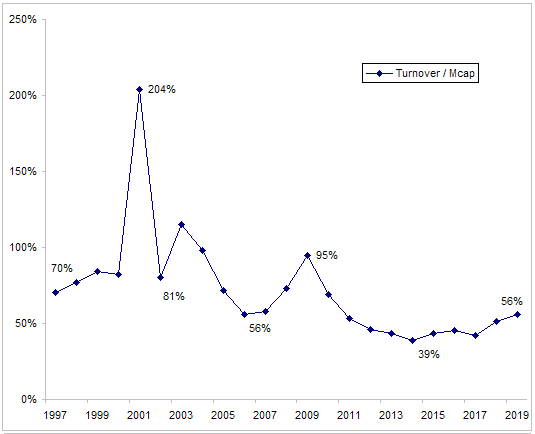
NSE Turnover as a % of market cap.
Source: NSE
In order to assess risk of a fall in trading volumes, I looked at the previous drop in trading volumes. Trading volumes dropped in 2002, 2004-2006, 2009 and 2011-2014 periods. In each of this case, there was a surge in volumes prior to this drop and volumes as a % of mcap reached as high as 200% in 2000 or 95% in 2009. In comparison, trading volumes as a % of market cap is only 56% right now (closer to long term average but higher than 2014 low) so risk of a long drawn drop in volumes over next few years is low.
Deliverable volumes also dropped along with total volume but to a lesser extent mainly because during bear markets, drop in intraday volumes is higher than drop in delivery volumes. ISec revenue is highly correlated to delivery volumes.
Chart below shows delivery volumes over last several year along with a simple (OLS) trend line.
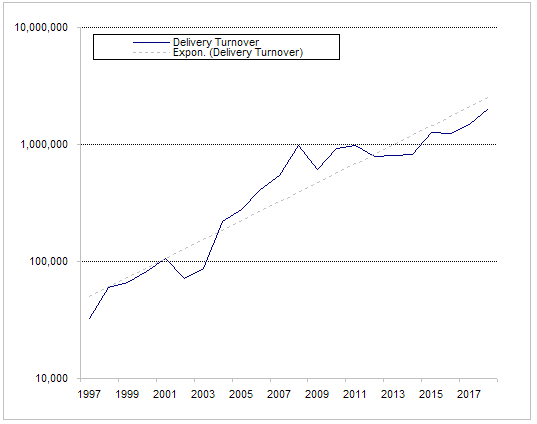
NSE Delivery Volumes
Source: NSE
As the chart above shows, current delivery volumes are trending just below the trend line so risk of a fall in delivery volumes also appears to be low.
Finally, chart below shows that ISec income is highly correlated with ADTO on NSE.
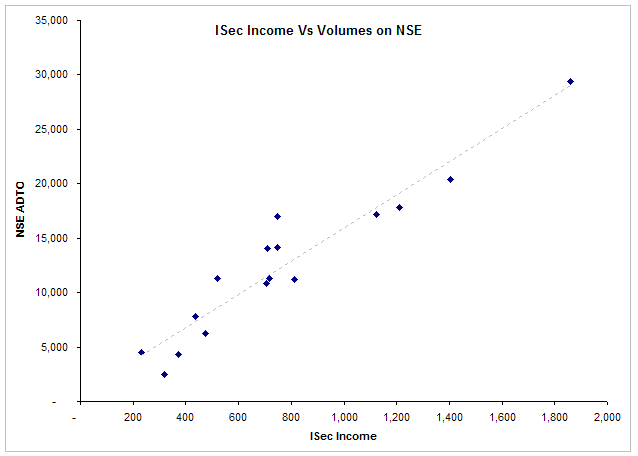
Source: NSE (for trading volume data) and ICICI Sec for company data
For first 6 months of FY 19, ADTO is higher by about 8% compared to FY18, so here also there is no risk of a sharp fall in ISec income in FY 19.
Based on this analysis, a sharp pullback on ISec income and PAT for FY 19 is unlikely. Given the strong performance in FY 18, some pullback is expected, but at 13 times TTM EPS, CMP has more than priced in near term risk.
View invited.
The main issue with ICICI Securities is not the likely decline in volumes in case of a bear market… as your analysis shows over a period they may remain constant or increase at moderate pace…
I think the main issues are
- Its inability to diversify beyond the brokerage business due to parent being already there in all businesses… and hence stuck with brokerage only business model…
- The competition from discount brokers and further disruption of brokerage business itself. For most self service users it doesn’t add any incremental value compared to low cost broker… They need to cut the flab and make their charges competitive…
Disclosure:
- Not invested. Tracking
- Using ICICIDIRECT from 10+ years. Not happy with high charges.
We should bear in mind that ICICI Direct earned ~INR 280 odd crores from Distribution of MFs. With new direct MF platforms gaining popularity plus the reduction in commissions by AMCs imminent, this source could really fall by a decent no. So it has to be seen, how much could EPS be in next 12 months. The EPS of 17 in FY18 could really have been the peak EPS. I would conservatively expect 20-30pc reduction from FY17 EPS and expect a stable EPS of INR 8-10. Wouldn’t give it more than 15x, valuing this at 150. I know this sounds quite bearish, but clearly the income streams for Icici Securities are all going to be under stress. Brokerage from discount brokers, Distribution from change in business model and reduction in fees. Plus other cyclical segments such as Capital Markets with recent downtrend in markets could really put more pressure on earnings.
ICICI really smartly priced it at 520 when even 200 looks expensive to me right now.
Disc: Not invested.
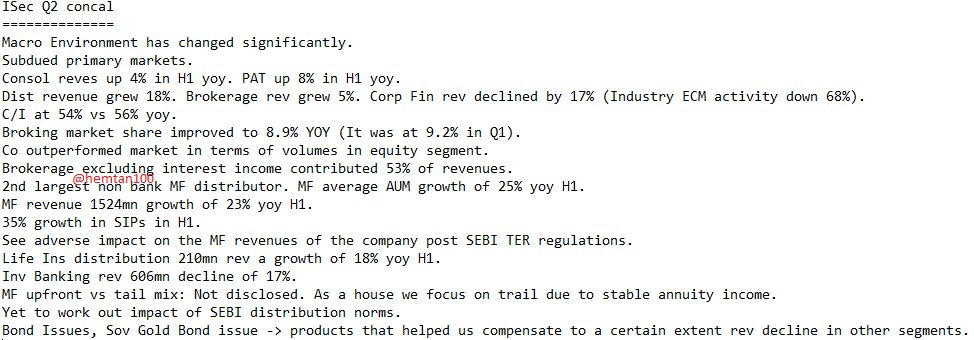
ISec Q2 - decent performance. growth flattening out.
Q3/Q4 should reflected the pain in the broking and distribution revenue.
3.7/- interim dividend though.