About the company:
-
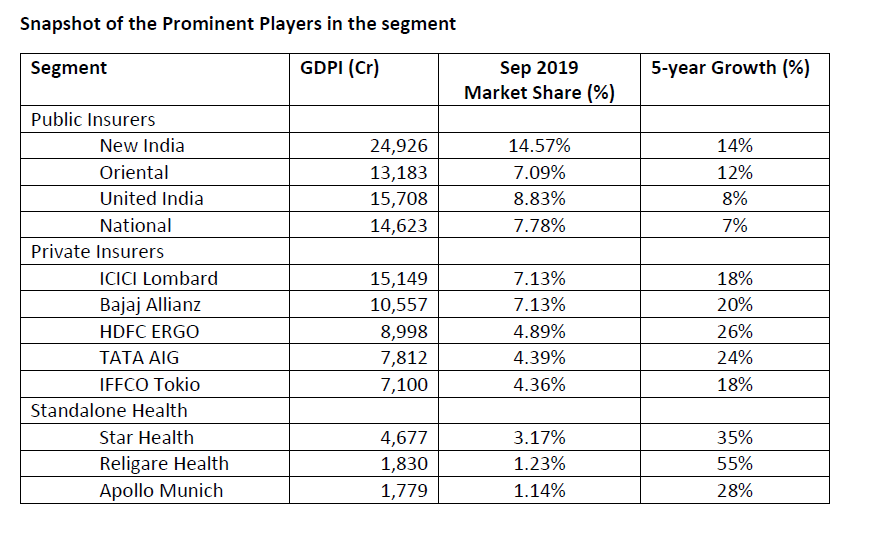
ICICI Lombard is one of the largest general insurance company in India based on Gross Direct Premium Income in FY19. It was founded as a JV between ICICI Bank and Fairfax Financial Holdings in 2000.
-
For fiscal 2019, ICICI Lombard issued 26.5 million (on GDPI basis) policies, translating into a market share of 8.5% among all non-life insurers in India and 15.6% among private-sector non-life insurers in India.
-
Key distribution channels are direct sales, individual agents, corporate agents - banks, other corporate agents, MISPs, brokers and digital, through which they service their individual, corporate and government customers.
-
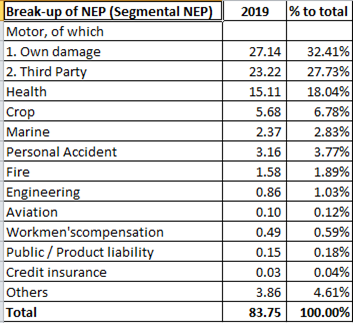
The company offers a comprehensive and well diversified range of products, including motor (50% of total mix), health, travel & personal accident (25%), fire (12%), marine (3%) and others, through multiple distribution channels. All figures as of 9M 2020 (please see figure below).
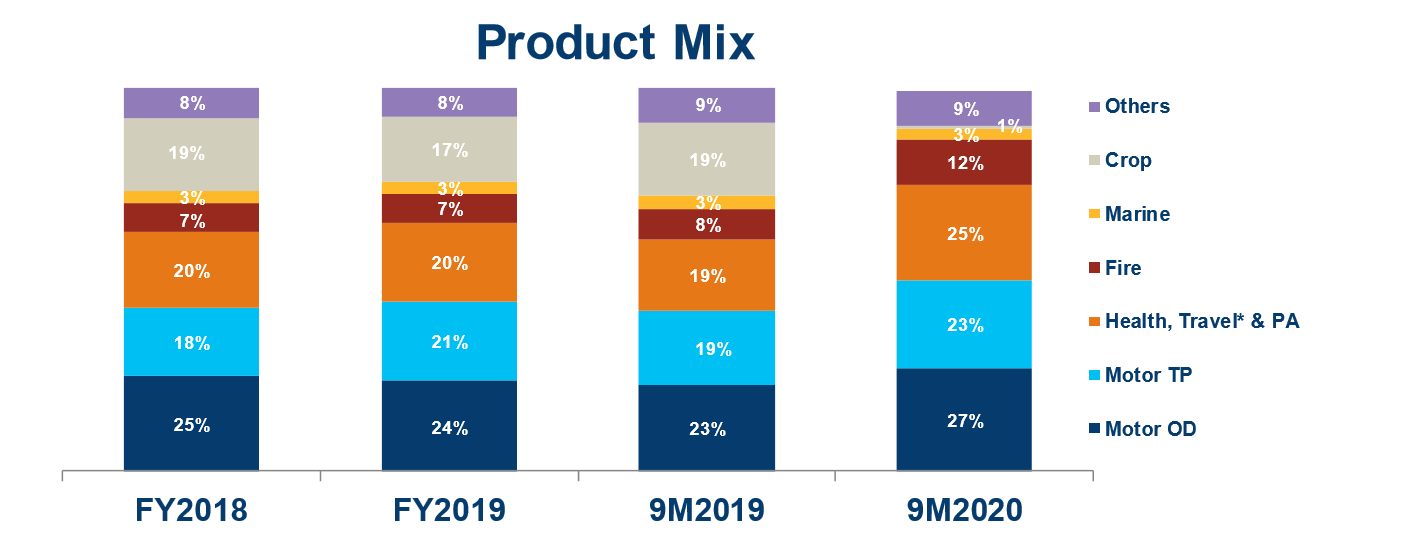
Source: Company presentation
Key Financials:
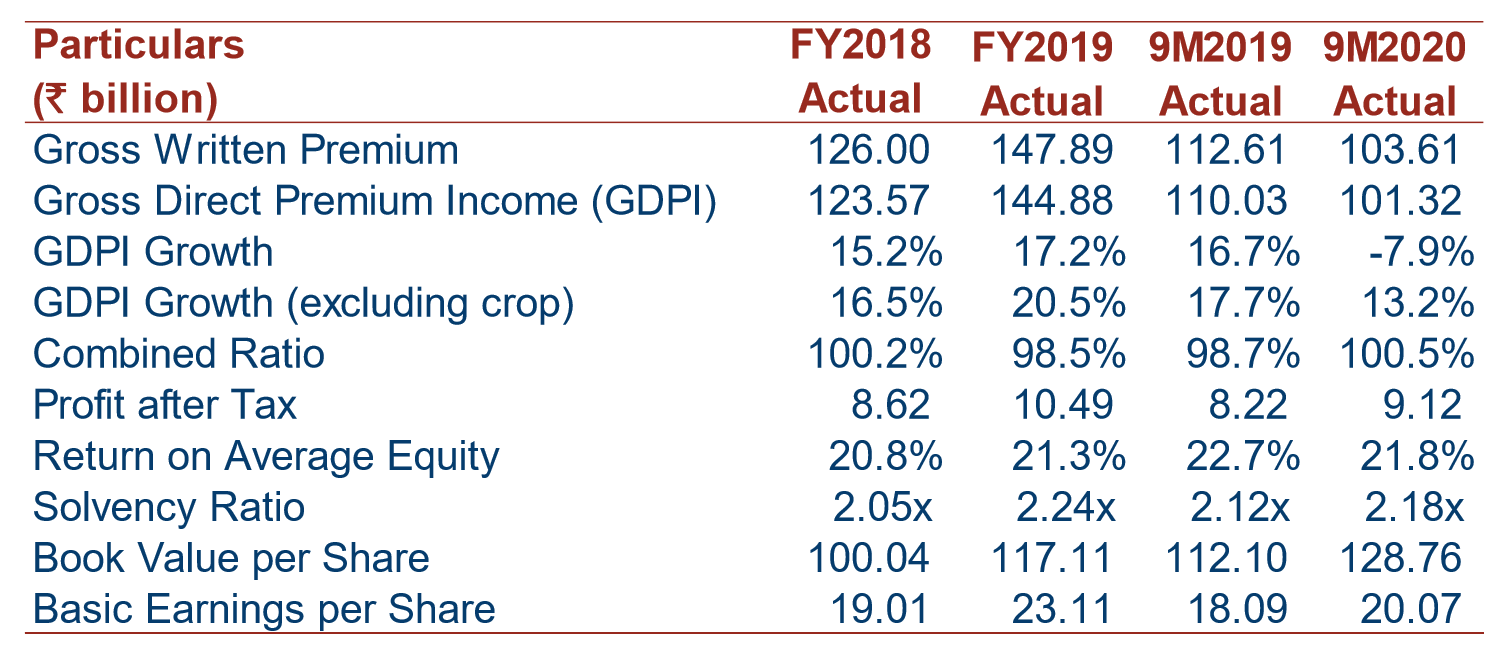
Source: Investor Presentation
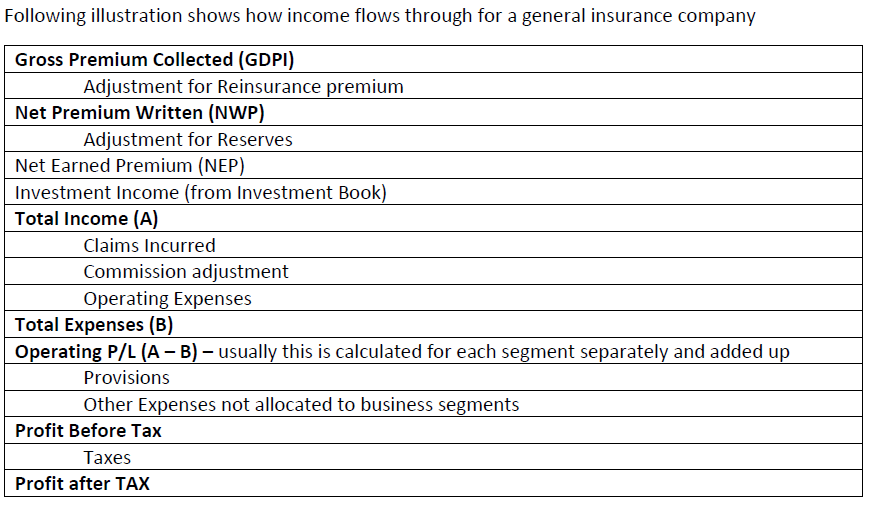
Business Model:
Typically how general insurance companies work >> They have short tail i.e. short duration of policies unlike life insurance (where you have term insurance policies even more than 10-15 years). General insurance policies on the other hand are on an average of 1-2 years.
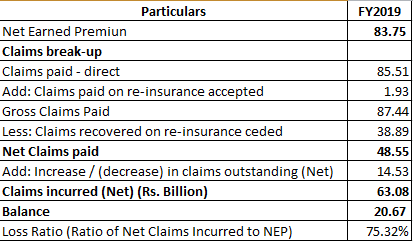
Key metric to track is (a) Combined Ratio (b) Investment Yield
Combined Ratio = Expense Ratio + Loss Ratio
where, expense ratio gives operating expenses as a % of earned premiums
and, Loss ratio gives claims expenses as % of earned premiums
On the top of this insurance company keeps these funds into short term investments, mainly debt securities (typically matching their liabilities). Any money earned on this is an additional income. So, as far as company can operate below combined ratio of 100% they can enjoy this additional income and price their premiums attractively.
Now coming to ICICI Lombard metrics:
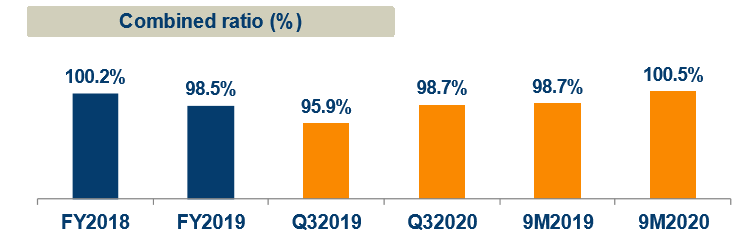
Since last few years they have been easily able to maintain combined ratio below 100%. There was spike in between as they incurred heavy losses in crop insurance (and now if you see product mix in 1st figure, they have significantly reduced exposure to crop insurance).
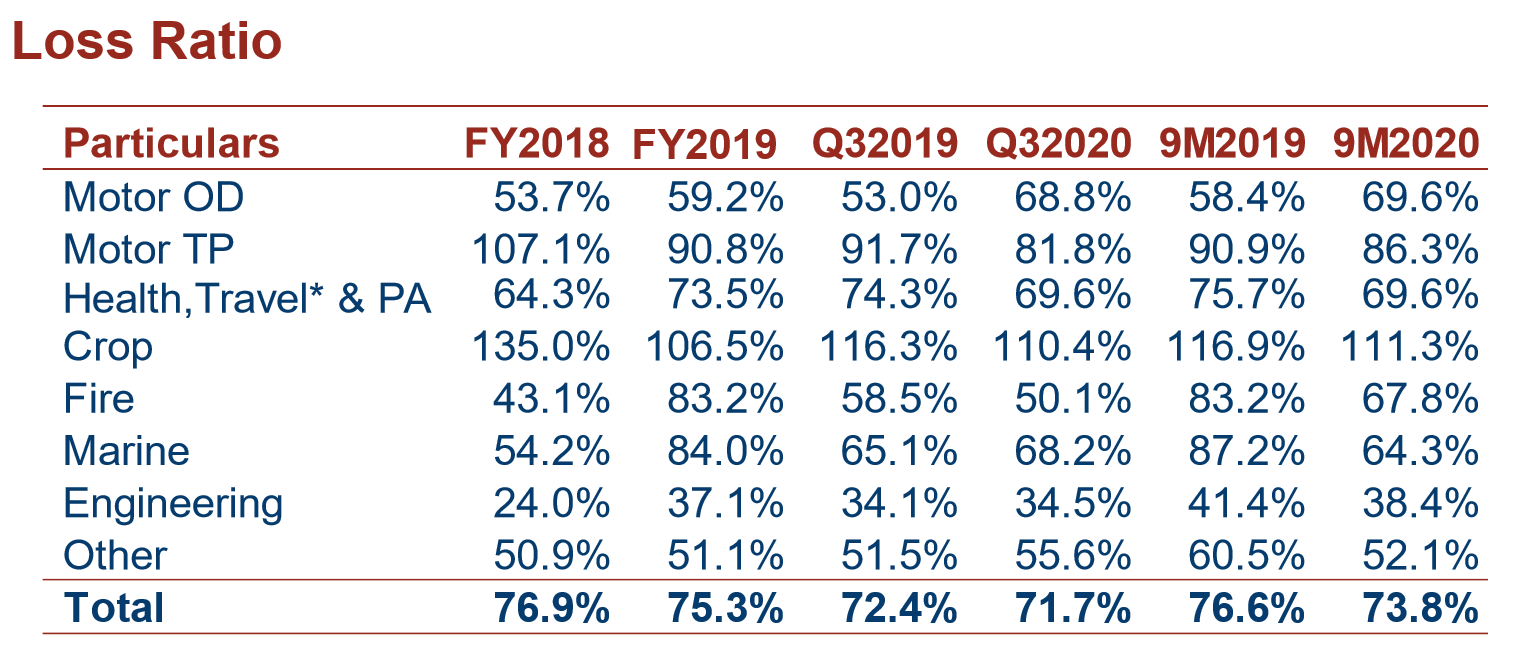
Source: Investor Presentation (observe spike in crop insurance loss ratios during FY2018)
Coming to investment returns, they typically leverage debt portfolio to gain substantial returns (which pretty much boosts their RoE).
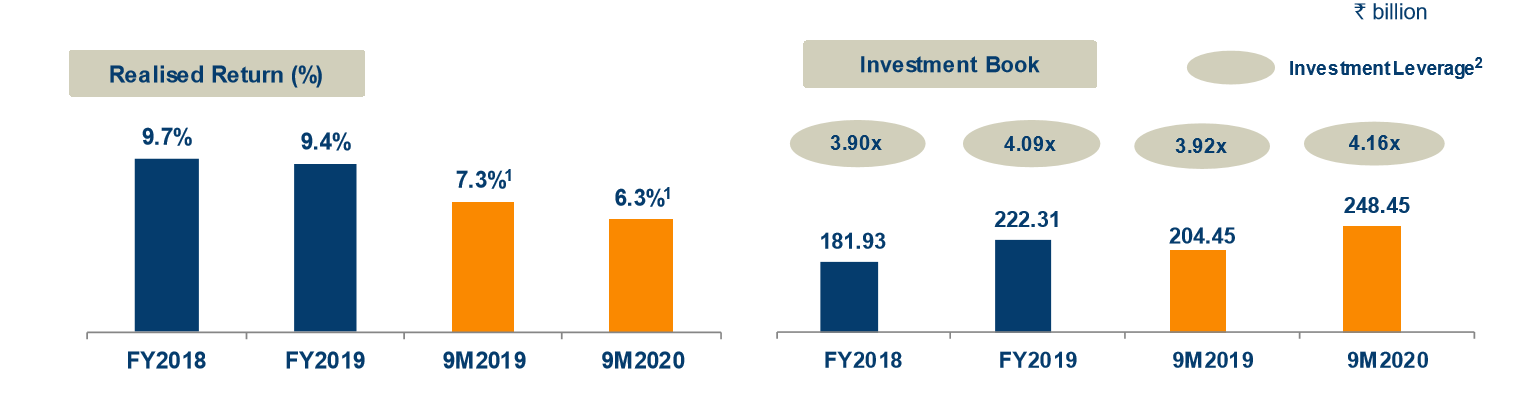
Source: Investor Presentation
- If you multiple realised return with leverage figures, you will get pretty close to RoE figures. So, typically higher interest rate environment without much changes in rates is favourable for higher investment return,(you can say in that sense we are around bottom of cycle).
Below is the RoE trend reflecting the same:
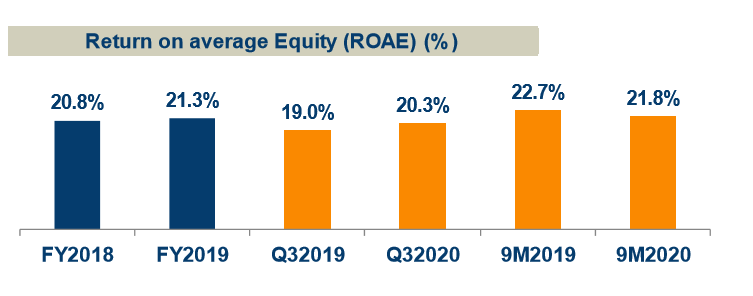
Source: Company presentation
Investment Rationale:
Long runway - Some of the products like motor insurance is now compulsory by law. Increased awareness + triggers on corporate travel as well as rail insurance are helping the industry. The penetration levels of general insurance are still very low compared to matured markets.
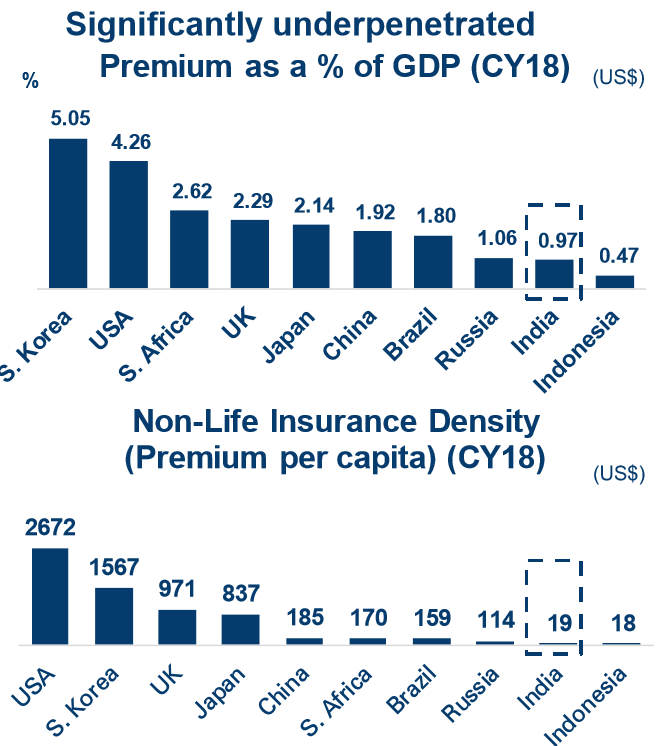
Source: Investor Presentation
Brand Name - ICICI is a strong brand name in India and it will help the company grow its business and give more bargaining power with distributors
**Distribution network:**Over the years, ICICI Lombard has grown its multi-channel distribution, including strong digital presence as well as penetration to Tier 3 and Tier 4 towns. Over the years, if digital and direct policies increases, it will boost their profitability and/or increase pricing competitiveness due to lowering of expense ratio.
Better understanding of Indian demographics - One needs good understanding of customer base and deep underwriting capabilities. ICICI Lombard has both due to it’s Indian partner + underwriting expertise from world class insurance partner.
Diverse customer base: This multi-channel distribution network enables ICICI Lombard to offer its products to a diverse set of customers, including large and mid-sized corporates, small and medium-sized enterprises, central and state governments, and individuals. Over the years, it has moved from a largely corporate focussed business model to a more diversified mix of business.
Scarcity Premium - ICCI Lombard is one of the few General insurance companies listed in India. This way it garners scarcity premium
Key Risks
- Big catastrophic risk can prove difficult in terms of higher claim outgo. We have seen this playing out almost every year. Underwriting and reinsurance capability is very critical in such cases. Good diversification of portfolio across geographies and product lines also helps in such cases.
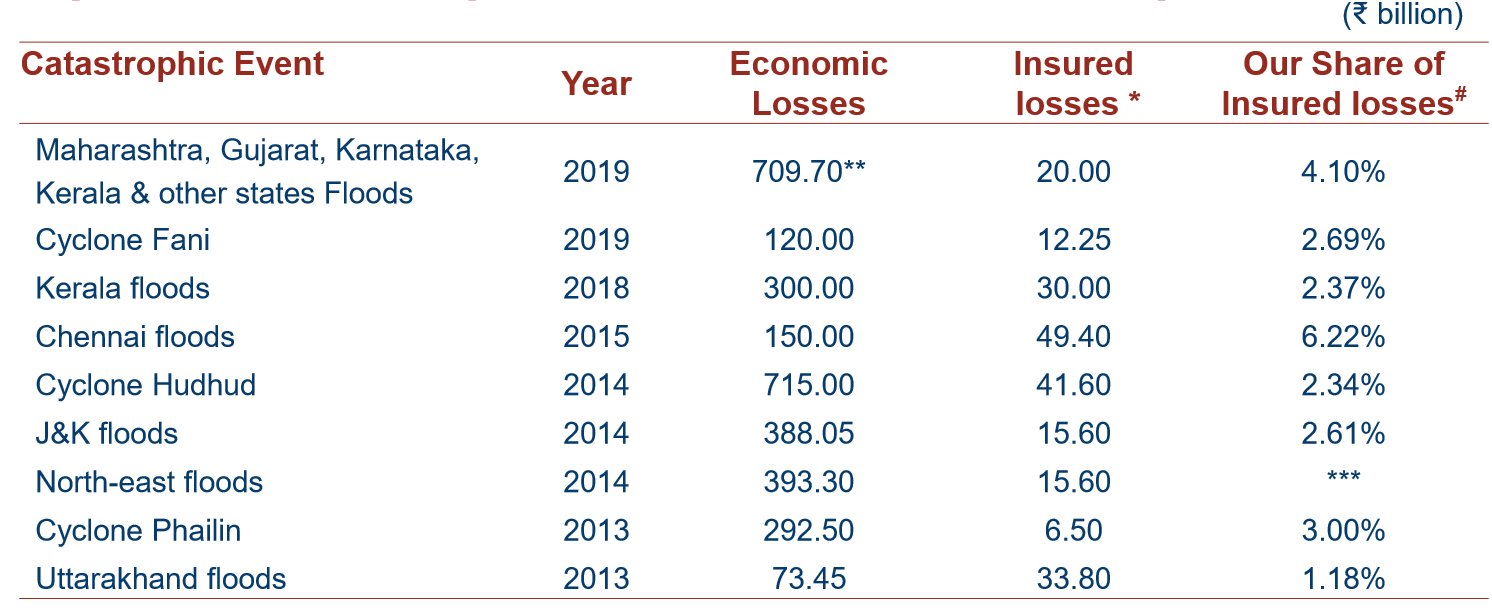
Source: Company presentation
- Weakness in solvency ratio or increase in regulatory requirement: This would require further dilution or capital raising. As per current norms, solvency ratios are quite good.
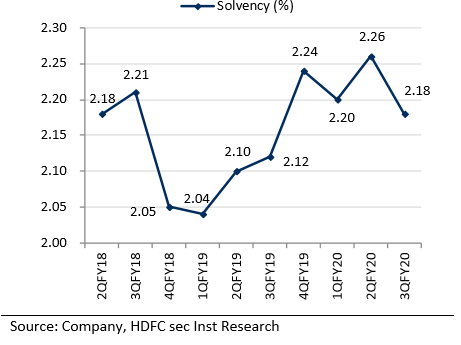
Source: HDFC Research report (link provided in references)
-
Threat from competition and aggressive pricing: Many single product insurers might have better underwriting capabilities in their product area and could provide better pricing. Also, in highly competitive scenario, premiums can go really competitive and insurers tend to price premiums abnormally low and sacrifice part of their investment income. This can lead to lower RoE and reduced profitability. Also, any regulatory changes that allows life insurance players to come into general insurance can lead to increased competition in future.
-
Assumptions of underlying reserve requirements: Loss reserves are based on estimates as to future claims liabilities and if they prove inadequate, it could lead to further reserve additions and materially adversely affect the results of operations
-
Distribution partners: Significant portion of sales is derived from sales to the customers of agents/intermediaries affiliated with motor vehicle manufacturers (“MVMs”) and from channel partners like ICICI Bank. Any material impact in such partnership and significantly reduce competitiveness of ICICI Lombard
-
Regulatory changes: Any unfavourable regulations around it’s key products can deteriorate its competitiveness
-
Market and interest rate risks: Investment portfolio and hence premium pricing could be affected in case of adverse market and interest rate movements
-
Concentration Risks: ICICI Lombard has historically derived and continue to derive a certain portion of its corporate premium from a limited number of large clients. It expects that a certain portion of its corporate premium will continue to be derived from a limited number of clients in the future. If there is any disruption here, it can reduce number of renewals and hence profitability
-
Disruption from direct players, startups and digital-only players: Business has risk from new players and startups coming into digital-channel and willing to price competitive rates of premium can disrupt the various segments and product lines
Valuation: ICICI Lombard currently trades at ~6x P/B and ~33 PE on trailing basis.
References:
http://content.icicidirect.com/mailimages/IDirect_ICICILombard_MgmtNote.pdf
Disclaimer: Tracking. This is not a buy/sell recommendation. Please do your own due diligence and consult your financial advisor.