I started the thread on Andhra petro many years ago and after a brief period stopped following the company. But I had a chat recently with an investor friend about the company and it seems company is on track for a big capex of nearly 400 crores to add value added products over next 3-4 years. That might make the company interesting, though it still will largely remain cyclical. Will need to dig deeper to see what kind of new products are going to be produced.
As of now no positions and not tracking it actively, but would like to look at it again some point of time.
Sir if by any chance you follow Deepak Nitrite, it would be very helpful to me if you reviewed my DCF analysis. I have attached the excel sheet in this thread.
I don’t track deepak nitrite closely now. Used to own and track it earlier… Having tracked it earlier, I know that its difficult to apply DCF to such commodity/partially commodity stocks. Slight change in terminal value can play havoc with DCF valuations. Any accident can play havoc. Any change in prices of finished products/raw materials can alter the calculations.
As far as I know, DCF is suitable for businesses with predictable growth and cash flows. Its difficult even for promoters to predict business a few quarters down the line in such businesses, let alone analysts and investors.
To give you an example, (and most people will agree that pharma is an inherently more predictable business than chemicals) I remember people making projections for Alembic pharma based on their capex for US markets. Now the situation is that in the absence of USFDA approvals, their whole new facility has turned into a white elephant and all DCF calculations have gone for a toss.
Hitesh bhai after looking at multiple charts companies where a 300-500 % upmove has happened over 2-4 years. What I could see is that when stock moves up there are usually very high ( lifetime ) high volumes. You can see volumes spread across for few months where upmove is 30-40 % or more and then eventually stocks keeps doing well .
Does large volumes with moves play a role in spotting multibaggers or 2-3 baggers ?;
@ishu For commodity companies, its tough to analyse the business on a longer term time frame. Because no one including the management have any idea about how things are going to pan out over next few quarters, let alone next few years. I know a few chemical sector experts who are in regular contact with chemicals business persons who have the prices of a lot of commodity products like phenol, benzene, their derivatives, etc at their fingertips. These are the kind of guys who can play the chemicals game successfully. One can cultivate contacts in this space to derive an edge.
The other option is to buy with a wide margin of safety at close to or below replacement cost and hope that the cycle turns. Yet another way is to join the party once it has begun, and hope for a quick ride.
Different ways to play the game, but I guess DCF would feature among the least preferable option.
Hitesh Bhai, despite great results Gujarat Fluoro has fallen sharply. Does this mean that the valuations were too steep and fall was imminent? It is understandable that the valuations being too high (Tata Elxsi) and even bit of disappointment in results would massive fall. But in the case of GFL, the results were very good.
Fluorochem results have been good both on y on y and q on q basis. The presentation has also been put up and provides a lot of insights into the prospects of the company. Concall also sounded quite bullish.
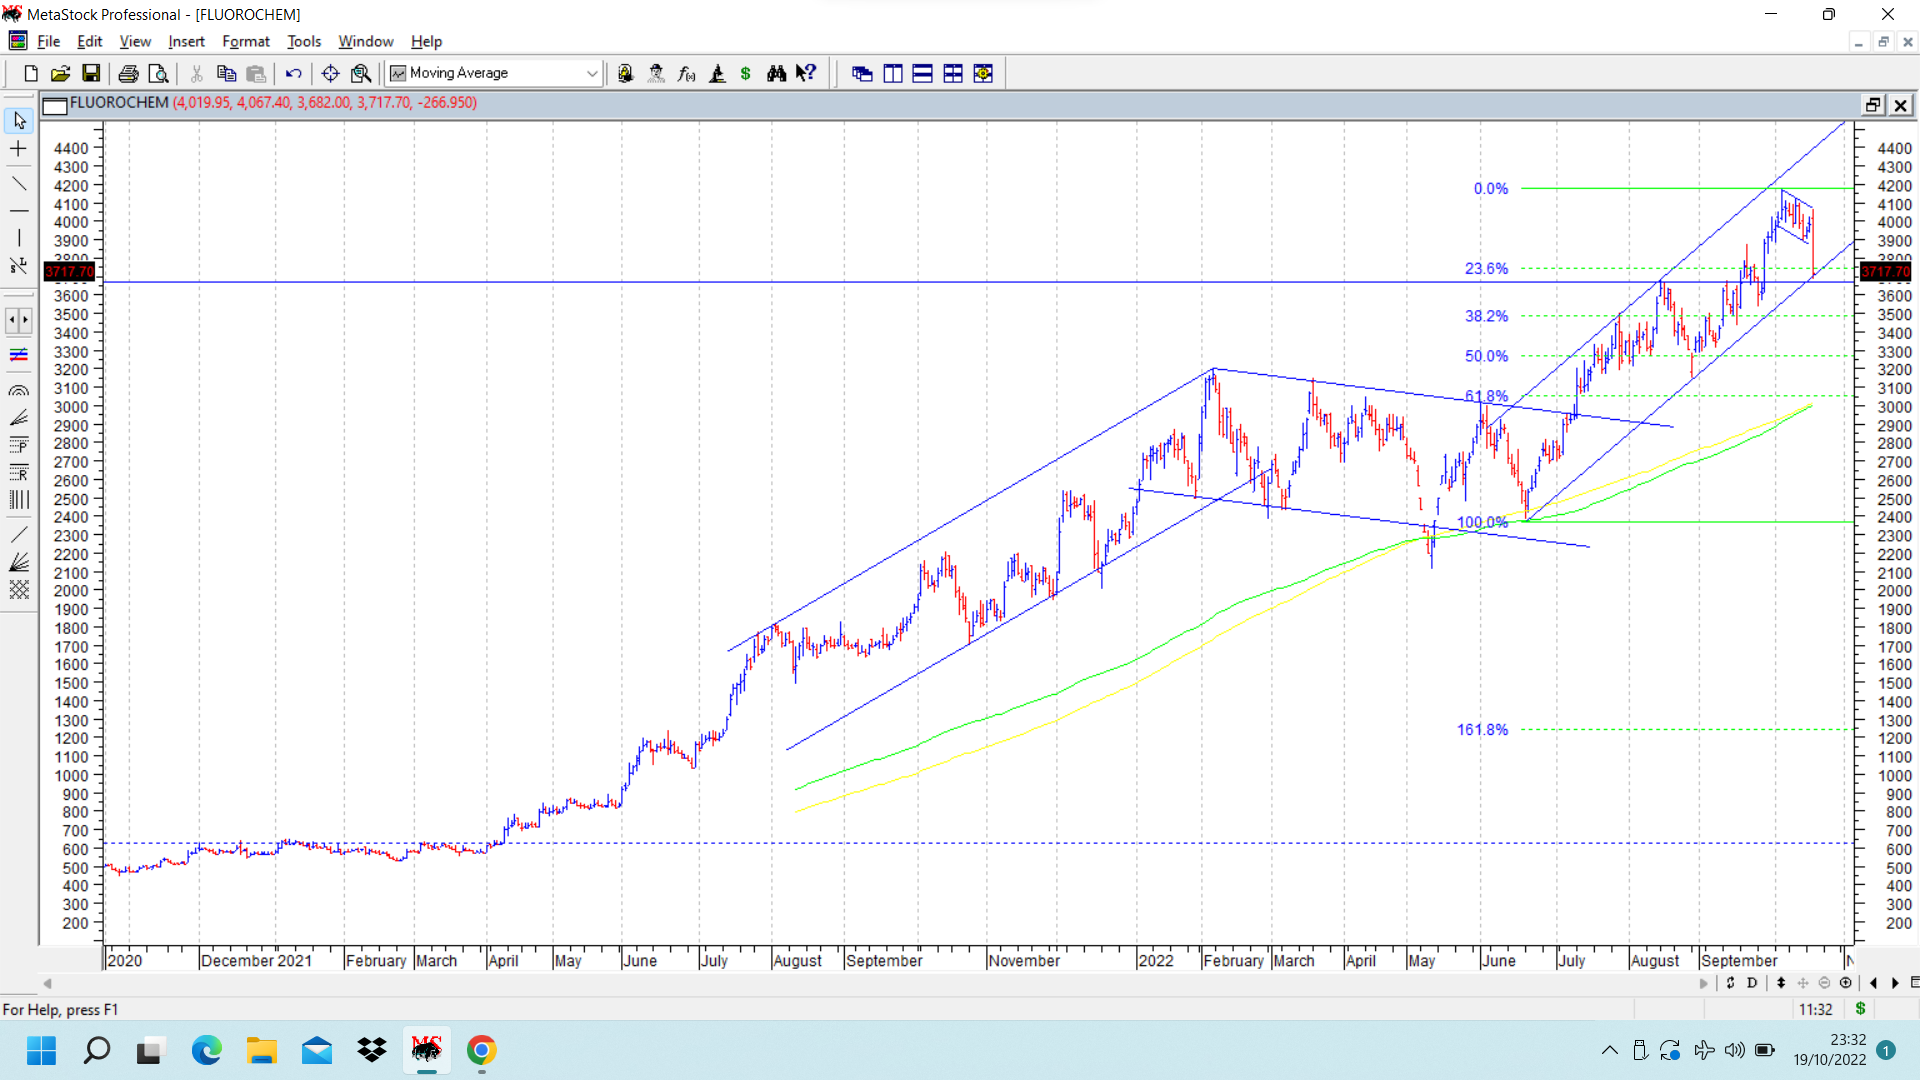
On the technicals front, the flag pattern which I had put up in the 52 weeks high thread seems to have failed. Today there seemed to be heavy selling in the counter. But in the journey of fast growing companies, post results selling is nothing new. When and where supply gets absorbed needs to be seen. Usually the short term guys tend to enter into companies whose results they expect to be good and exit once all the good news is out or even before that. But for someone who is there for the longer term horizon, these might often be construed as opportunities to add to positions, if allocations and funds permit.
Valuations wise, quartelry EPS is 33, half yearly EPS reported is 60. So one can make their own calculations and get rough estimates of full year numbers.
On the technicals front, the short term uptrend seems to have faced strong resistance at around 4000-4100. Support wise I would look out for support at levels at around 3670-80, which was a double top breakout on very short term charts. Below that I guess 3100-3200 should be a strong support, that being the zone of 200 dema and 30 WMA. And previously it was a major resistance, so going ahead, it should provide solid support.
I have put up chart of GFL showing a longer term flag breakout above 3000, whose targets are 4500. And another recent channel wherein stock price rallied from 3150 to 4170 and now seems to be retracing. Today support was seen at lower end of the channel and we need to see in next couple of days if that holds, or else we might have to look out for support at lower levels mentioned above.
Fundamentally listening to the concall gives a sense that the company seems to be on a strong wicket in terms of growth for next 2-3 years atleast. The near term growth triggers seem to be HFC gases, New fluoropolymers capacities getting on stream and speciality chemicals capacities getting on stream. Longer term growth plans are already mentioned in the presentation, with capex of 1250 cr planned each for FY 23 and FY 24.
I consider price action the most important while reading charts. Volumes come next. The most important thing I have seen is that we need to see volumes when important resistances are crossed… E.g breakout from a pattern like cup and handle, inverted head and shoulders, or double bottom, or multi year breakout etc… This usually needs to happen with huge volumes… After that rally may continue with lesser volumes, and after a time consolidation happens on low volumes. Post consolidation, resumption of upmove again needs to happen with big volumes. And so on.
For stocks to go up, it needs efforts to push it up, and hence bigger volumes are needed as stock price moves against gravity. (except in manipulated stocks where stocks move in small circuits.) While falling, even a lack of buying and minimum selling pressure will create big falls because many a times, while stocks fall precipitously, the atmosphere around the stock or the market or both is very bearish.
@ishu Personally I am not a big fan of DCF based investing, so you will have to dig deeper and figure out where you can apply DCF if at all. The only thing I can say is that its applicable to predictable businesses.
Hi hitesh Bhai, have you taken a look at axis bank chart and numbers? It gave a 5 year break out from 830 and numbers are fantastic. It is positioned similarly like sbi and ICICI Bank 2 years ago. Would love to hear your view about it. Thanks in advance.
I have put up RBL bank chart below. Crucial level of breakout is around 133. Cup and handle target is at 189. Crucial resistance is between previous falling gap (marked in small dotted line) between 155-165, which is also the zone of falling trendline.
Axis bank had strong resistance around 800-820 which now has been crossed and stock price is above 900, at all time highs. It seems to be in strong momentum, and chart looks strong. I don’t follow it too closely fundamentally.
In fact most banks private and public have very strong chart set ups and looks like next big sector in fancy can be these.
This is my first technical analysis. Please pardon me for any incorrect analysis.
I am looking for chart of Equitas Small Finance Bank. I think it has successfully broken the cup and handle pattern around mid sept with decent volume. However, after that, it was twice faced the resistance around 51 and then tested at the support level at 47 and then stock has bounced back from the cup and handle level.
Can we consider the current level as good level to make entry or should wait for stock to break current resistance around 51 to make an
Hitesh bhai how do you view such market. Market have rallied from low of June - July and now very close to all time high. Broader market has not yet participated.
Ideally as per my understanding either broader market should start going up or markets may correct .
How to look at such markets to play swing trade.
Just curious as we have had such rallies in last 2 years.
Equitas SFB has broken out of a cup and handle pattern above 47-48 and post that, it is consolidating in a tight flag like pattern. Breakout from this pattern happens above 52. One can either buy now in the hope that a successful breakout happens above 52, or wait for actual breakout and then take a position. Targets for cup and handle breakout are 58. cmp 50. One can put appropriate stop loss.
A lot of these smaller public and private banks are showing bullish pattern breakouts. Some like karur vysya bank have more than doubled in last six months.
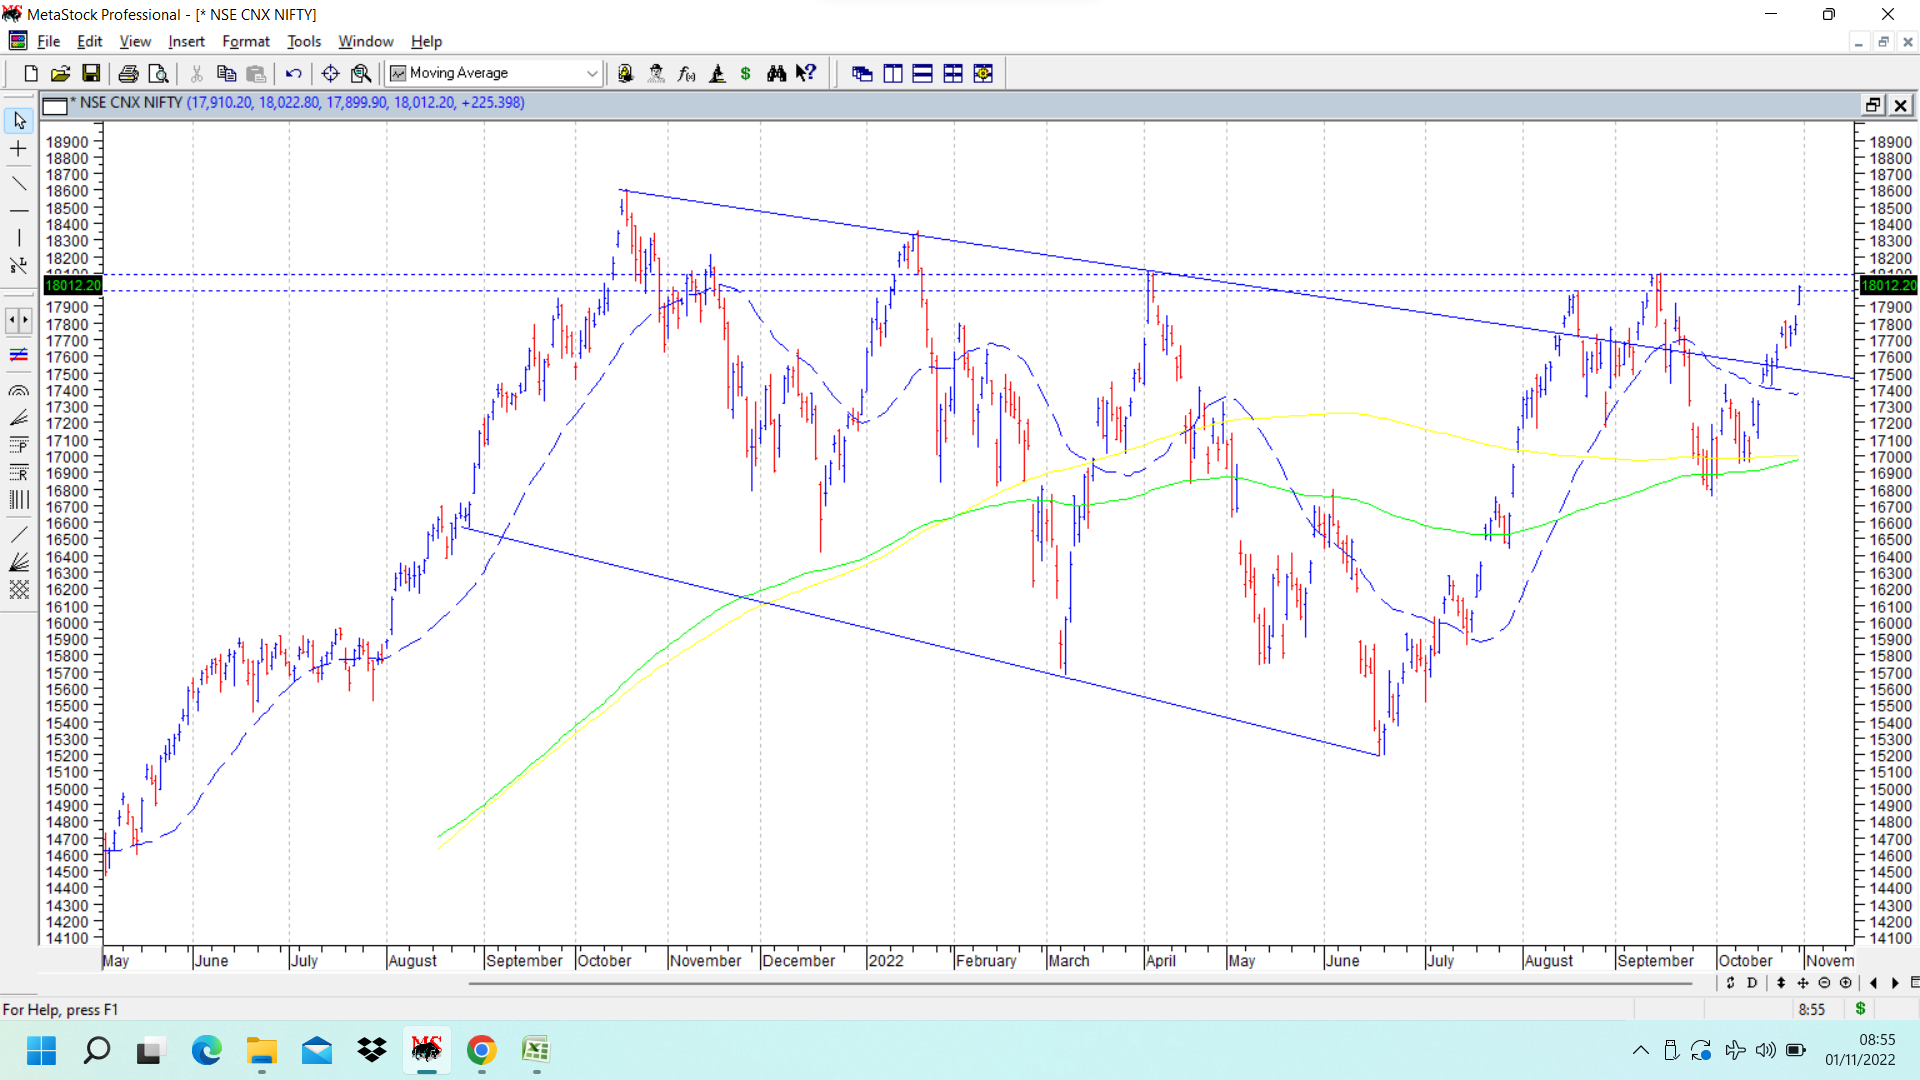
We have had many rallies and big falls since Oct 2021, when the correction in markets began. As put up in the past, it has taken the form of an expanding triangle. Now with current rally, we seem to have broken out on the upside in Nifty charts.
In the near term, 18000-18100 (rounded off) as marked by dotted lines in the chart is the key resistance. Once that is cleared, we could be looking at higher levels.
The market preference for large caps and small caps keeps on changing from time to time and often lasts few weeks and then the whole equation turns on its head.
These are tricky times for traders, who try to keep trading, as they are often caught on the wrong foot. Investors who can pick good companies are relatively better placed. And there are plenty of opportunities in sectors like Banking, Defence, Infra, etc spaces for trading/investing.
Till now, the prudent thing to do has been to raise cash levels once we approach 18000 and start deploying capital once we go below levels of 16500 or so. But if we are going to break out on the upside, then it may make sense to stay invested inspite of being above 18000. Its a tricky call for those wanting to time the markets.
Hitesh sir, any thoughts on smallcap space ? Index has been largely flat in last 4-5 years from 2018 peak. Many smallcaps i see are not going up despite earnings being quite robust and growing strongly. Any thoughts on what is happening in this space?