Revenue: The fourth quarter revenue was Rs. 1030 Crores as compared to Rs. 799 Crores in FY2021. The full year
revenue was Rs. 3765 Crores as compared to Rs. 3237 Crores in the previous year showing a growth of 16.3% over the
previous year. With supply constraints in API we have maximized our profitability by optimization of portfolio. Share of
revenue from Europe has gone up from 18% to 21% for the full year. Revenue share for other molecules stood at 19% on
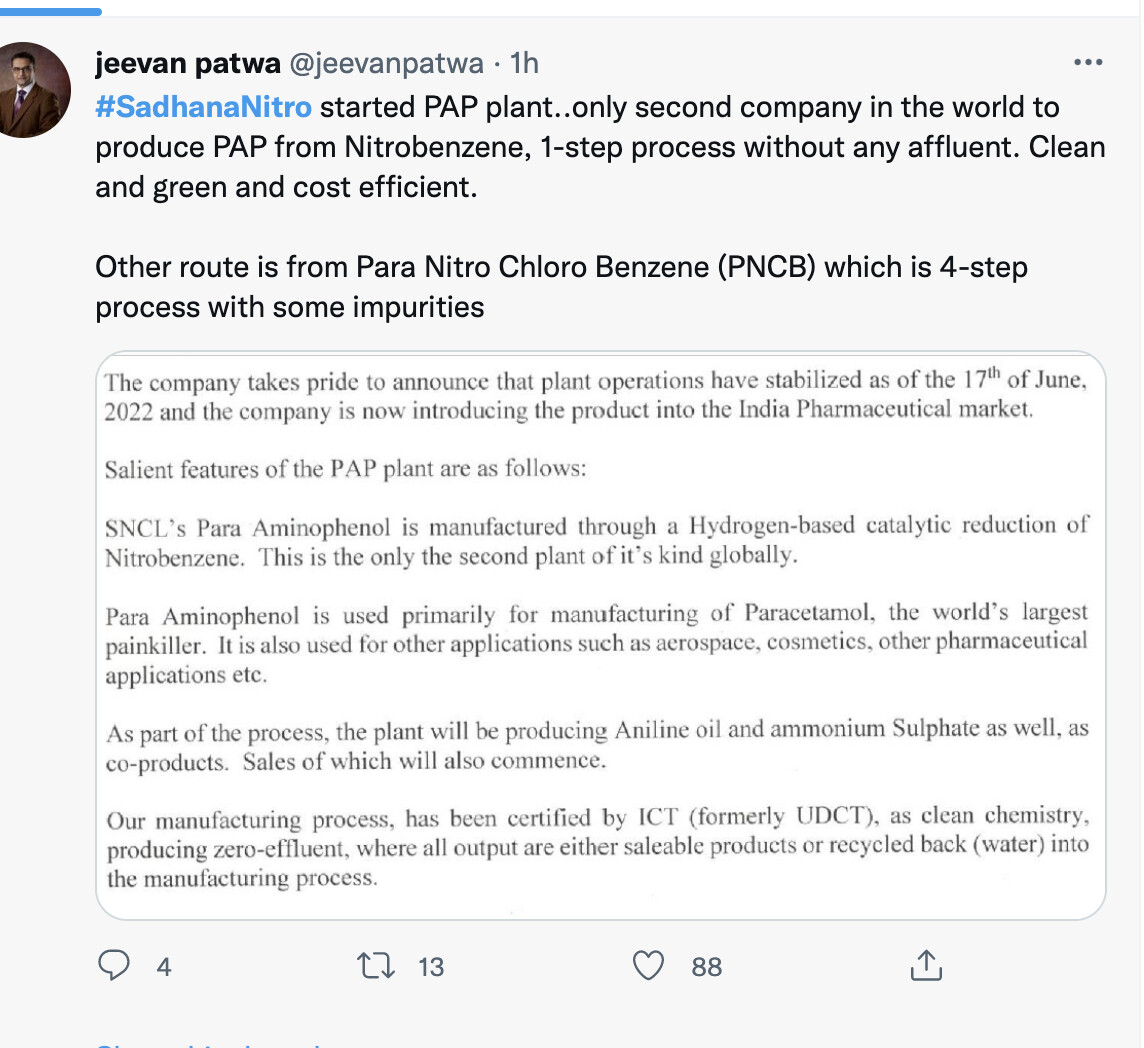
a full year basis versus 16% in the previous year in line with our strategy. Short supply of Para Amino Phenol (PAP) resulted in loss of Paracetamol API business. The gross margin loss was at least Rs. 65 Crores in FY2022. The sales
breakup as per business verticals and regions are presented in our investor presentation which is available on the website.
Gross margin: Our gross margins for Q4 contracted by 8.3% on Y-o-Y basis, but improved by 2.3% sequentially when
compared with Q3 of FY2022. For a full year basis the gross margins contracted by 7% over the previous year. Increase in key raw materials, solvents and other input materials and unrecovered freight cost have contributed to this contraction.You may like to note that raw material increase was in the range of 60% whereas solvent was in the range of 40% to 70% and freight was in the range of 70% in terms of hike. While we are able to recover the added cost from our B2B business the same was not recovered from the B2C business due to fixed nature of the contracts. Unrecovered freight and container cost, unrecovered increase in the material cost across all molecules and US price erosion has resulted in bottomline decline in this year.
EBITDA and EBITDA margin: EBITDA for the quarter was Rs. 193 Crores when compared to Rs. 202 Crores in the
previous year same quarter. On a full year basis EBITDA was Rs. 722 Crores in the previous year the same was Rs. 855
Crores thereby contracting 723 basis points in terms of EBITDA percentage on account of reasons explained above.
R&D: Our R&D spend for the quarter was Rs. 33.9 Crores when compared to Rs. 36 Crores in the same quarter previous
year. On a full year basis R&D spend was Rs. 143 Crores when compared to Rs. 100 Crores in the previous year. The
R&D spend would be monitored very closely throughout the next year and prioritization would be made as per the
strategic priorities across various technologies as alluded earlier by our JMD and CEO.
Net debt: Our net debt was Rs. 697 Crores as compared to Rs. 575 Crores a year ago mainly on the increased inventory
and receivable due to our increased sales. Our inventories were maintained at higher levels due to COVID and freight
delays and this was a strategic decision. We are constantly monitoring our working capital and efforts are underway to
reduce the same while keeping business interest and customer service level in mind.
Cash-to-cash cycle: Our cash-to-cash cycle was 138 days in the current year compared to 117 days in the previous year.
The increase of 21 days was mainly attributed to inventory increase due to reasons stated above. Receivable increase due
to increased business. We hope that the raw material situation stabilizes soon and then we could expect our CCC to improve further.
Operational cash flow: Operational cash flow for the quarter was Rs. 75 Crores when compared to Rs. 145 Crores in the
previous year same quarter. The full year operational cash flow was Rs. 332 Crores when compared to Rs. 432 Crores.
Increased working capital, reduced profit has contributed to the reduction in the operational cash flow. We have started
seeing improvement in the operational cash flow and free cash from Q3 onwards.
Capex: Capex spend during the year was Rs. 397 Crores compared to Rs. 271 Crores in the earlier year mainly on
account of increased spend in the MUPS block and MPP -II block in Vizag. Our capex spend will be in the range of Rs. 600 Crores for the next two years. Overall the year’s performance was quite good considering the challenges that we have
faced throughout the year.
A lot of elements in this business look good/ potential slow Good change coming about.
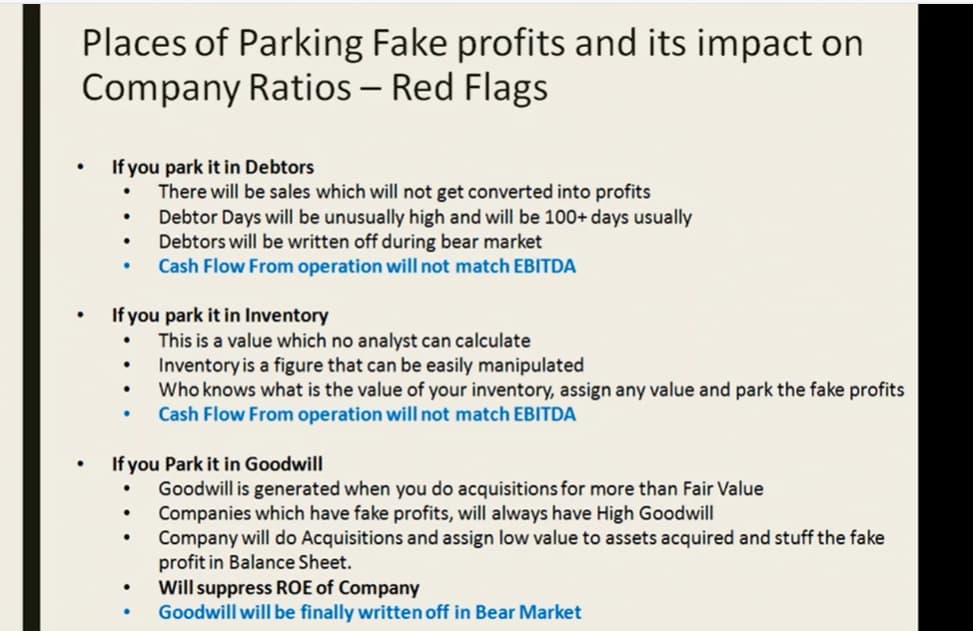
Few things that bother are their high receivables historically.
Receivables have always been >33% to sales and >25% total assets.
This number is quite high and shows larger percentage of its sales happening on a credit basis.
Couple this with average debtor days being > 125 and cash conversion cycle >133 days, the business starts looking a bit average despite them onboarding an amazing CEO recently.
Would appreciate any suggestions on the same from forum.
Thanks.
Disc: Not invested but studying closely.
Overall, business has been of below average quality historically. May not deserve even 5k mcap IMO. 1.2~1.4 mcap/sales does justice to such businesses (personal opinion)
That’s what I’m trying to highlight here. I did and even in comparison, they trend higher than others. Apart from that, due to these trends, these businesses don’t deserve average valuations IMO, even if you ignore the consistent price erosion in US generics.
Divis and laurus have higher receivable and inventory days than granules. Make what you will of that. There are ample examples of Wealth creation in companies with similar WC cycle. Stating the obvious here- A tighter WC cycle is always preferable but there are other things to consider.
Btw not sure why you think historically >33% of sales have been stuck in receivables (just once as far as i can see on screener)
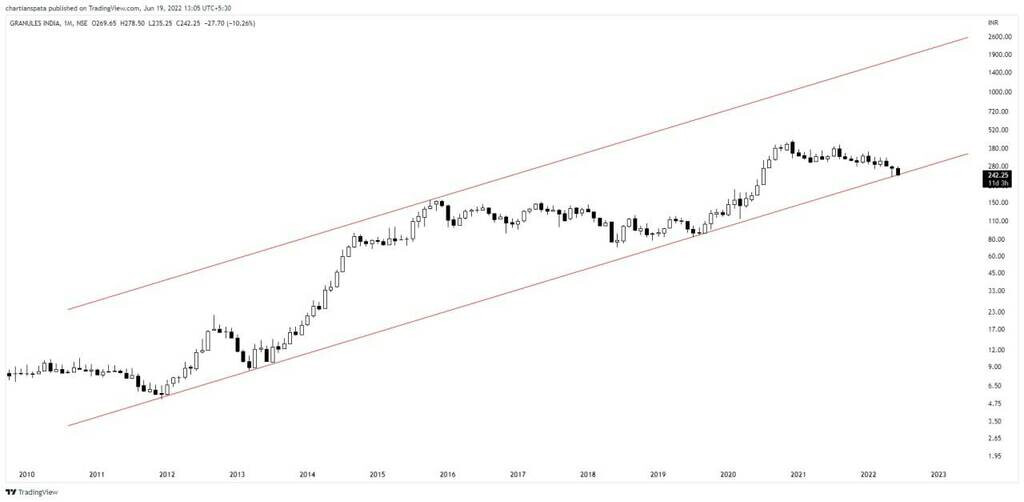
With regard to your comment on Valuations. It’s expensive if you believe the recent underperformance is permanent. Cheap if you believe that over the next 5 years they will repeat what they did between Fy14 and Fy19
In interest of public discussion, I would stop here. I guess comparing divis/laurus to granules makes sense to you, not me Sir. I picked the 33% figures from screener only.
Hope business improves as past is never an indicator for future business trends and performance.
Will be sitting on sidelines and watching this business keenly as I’m a fan of Rao Sir. Thanks.
That was precisely my point. Divis and laurus are better businesses (in my opinion) but granules has lower receivable days and inventory days. So looking at working capital in isolation can’t be a good idea right?
just like you even i use screener. That’s why I am a little confused when you say you got this from screener
Sir , I use screener’s excel sheet for intial screening.
I considered 2016 onward numbers excluding 2020 as the numbers were consistent during that period only.
I am still learning a lot so I might not be evaluate numbers as good as you. But currently, I continue to follow what current understanding of numbers tell me and refine the framework as & when I learn something new.
Attaching the snips here.
Receivables/sales
It’s ok. I only commented because i felt what you wrote is factually incorrect. That’s all. I am not married to any of the stocks mentioned so far:)
I see what happened though. you are looking at standalone numbers instead of consolidated
I downloaded the excel only for consolidated numbers earlier. But when I just now downloaded a fresh excel for granules , there seems to be a change in data sheet entries using which these are calculated and ratios indeed seem a bit less ugly. Thanks again. Seems like I have to re-evaluate other portfolio and watchlist entries once again.
Has anyone been tracking Granules India’s expected US launch of generic amphetamine mixed salts for ADHD? The last public news was from mid-March 2022, where they confirmed that their US plant in Virginia received a positive Establishment Inspection Report.
Does anyone have info on when they plan to start production and sales?
Container prices have finally started coming down. This should bode well for all pharma companies.
That has led to sharp falls in spot freight rates, which continue to drop as recession fears dampen peak season demand, according to analyst Linerlytica.
Freight rates from Asia to the US west coast slumped to $8,934 per 40-foot equivalent unit (feu) on 21 June, according to the Freightos Baltic Index.
Some carriers are reportedly offering rates below $7,000 per feu, which is less than half the average of about $15,000 per feu for most of the year.
The drop in spot rates is due to increased capacity, even though demand is picking up in the run-up to peak season, said Linerlytica.
Chief APIs made by the company - Paracetamol, Metformin, Methocarbamol, Ibuprofen and Guaifenesin. Revenues from API stand at 975 cr.
PFI - Pre formulation intermediates - largest PFI makers in the world. This makes Granules a preferred supplier for some of the most renowned global Pharma companies. Revenues from PFIs stand at 845 cr.
FDs - finished dosages - 52 pc of company revenues come from finished dosages @ 1944 cr.
Geography wise revenues break up -
North America - 52 pc
Latin America - 10 pc
Europe - 21 pc
India - 12 pc
RoW - 5 pc
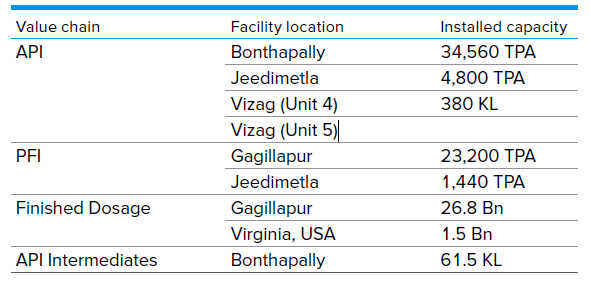
Manufacturing facilities -
Bonthapally ( Hyderabad ) - API - Paracetamol
Jeedimetla - multiple APIs and PFIs
Gagillapur ( Hyderabad ) - FDs and PFIs
Bonthapally ( Hyderabad ) - API intermediates
02 facilities at Paravada ( Vishakhapatnam ) - APIs and FDs
Virginia ( US ) - FDs
Gross margins for FY 21-22 at 1881 cr, a slight increase over the previous year despite steep increase in cost of solvents, RMs and freight.
Core of the company lies in its - Vertical Integration, continuous process improvements, enhancement of tech capabilities, economies of scale and stringent compliance with quality standards. Company aims at global cost leadership in select molecules.
Focus on technology - Company sees enzyme / protein engineering as an exciting future opportunity to improve cost competitiveness, manufacturing excellence, improved productivity and better sustainability. Bio catalysts are eco friendly, cost effective, allow fewer steps, easy purification and reduced capital investment vs synthetic processes.
Company is also leveraging its tech alliances to achieve backward integration for its key RMs - PAP and DCDA.
Company has completed a new FDs manufacturing block using MUPS technology ( multi unit pellet system ) with a capital outlay of Rs 240 cr. Company has received multiple approvals. Once it goes commercial, Granules would be largest supplier of MUPS capacity in the world for the approved molecules.
Last yr, company also completed submission of validation batches for various oncology products. Commercial production is likely to start as soon as the company receives regulatory approvals.
Buyback Approved:
Approved the proposal to buy back up to 62,50,000 (Sixty two lakhs fifty thousand only) fully paid up equity shares having a face value of = 1 (Rupee One Only) each (“Equity Shares” or “Shares”) representing up to 2.52% of the total number of equity shares in the paid-up equity share capital of the Company, at a price of ¥ 400/- (Rupees four hundred only) per Equity Share (“Buyback Price”) payable in cash for a maximum amount not exceeding % 250 crores (Rupees two hundred and fifty crores only) (‘““Buyback Size”), representing 9.93% and 9.92% of the aggregate of the fully paid-up equity share capital and free reserves of the Company as per the latest audited standalone and consolidated financial statements of the Company as at March 31, 2022 respectively and is within the 10% limit of paid- up, equity share capital and free reserves (including securities premium account) as per the latest audited standalone and consolidated financial statements of the Company as at March 31, 2022 respectively.